Flywheel Energy Storage Market Analysis, Size, and Forecast 2026-2030: North America (US, Canada, and Mexico), Europe (Germany, UK, and France), APAC (China, Japan, and India), Middle East and Africa (South Africa, UAE, and Saudi Arabia), South America (Brazil and Argentina), and Rest of World (ROW)

Flywheel Energy Storage Market Analysis, Size, and Forecast 2026-2030:
North America (US, Canada, and Mexico), Europe (Germany, UK, and France), APAC (China, Japan, and India), Middle East and Africa (South Africa, UAE, and Saudi Arabia), South America (Brazil and Argentina), and Rest of World (ROW)

Published: Dec 2025 300 Pages SKU: IRTNTR44188

Market Overview at a Glance

$283.5 Mn
Market Opportunity
9.9%
CAGR 2025 - 2030
38.8%
North America Growth
$285.8 Mn
Composite rims segment 2024

Flywheel Energy Storage Market Size 2026-2030

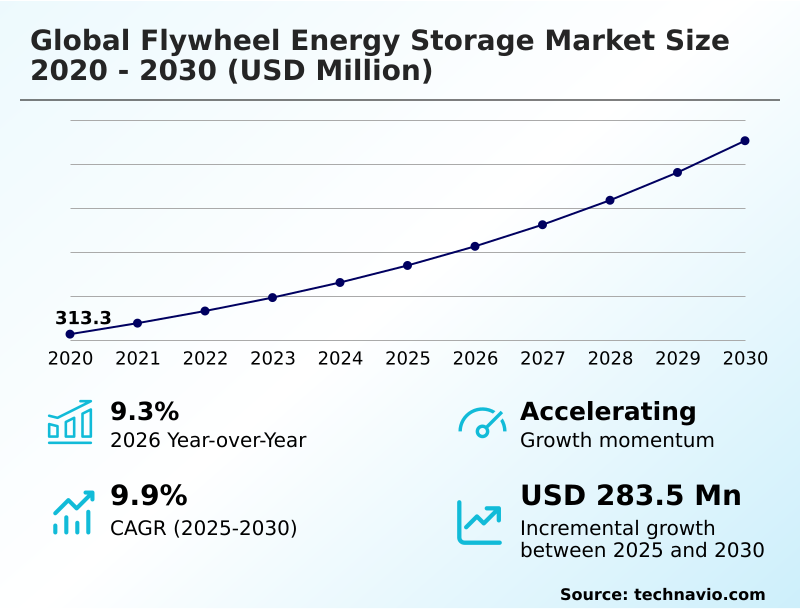
The flywheel energy storage market size is valued to increase by USD 283.5 million, at a CAGR of 9.9% from 2025 to 2030. Critical imperative for grid inertia and microgrid resiliency will drive the flywheel energy storage market.

Major Market Trends & Insights

  • North America dominated the market and accounted for a 38.8% growth during the forecast period.
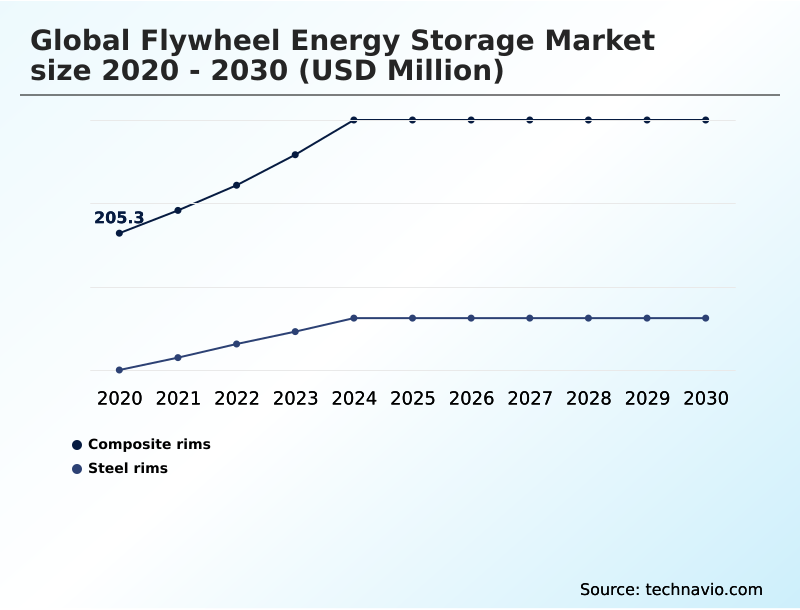
  • By Type - Composite rims segment was valued at USD 285.8 million in 2024
  • By Technology - UPS segment accounted for the largest market revenue share in 2024

Market Size & Forecast

  • Market Opportunities: USD 439.6 million
  • Market Future Opportunities: USD 283.5 million
  • CAGR from 2025 to 2030 : 9.9%

Market Summary

  • The flywheel energy storage market is becoming integral to modernizing energy infrastructure, offering a robust mechanical energy storage solution. A primary market driver is the growing need for grid inertia and synthetic inertia as renewable sources displace traditional power plants, creating demand for fast frequency regulation and ancillary services.
  • Key trends include the development of hybrid energy storage systems, where the superior cycle life of a kinetic energy storage system shields batteries from damaging, high-frequency use. For instance, a high-tech manufacturing facility requiring absolute power quality can deploy a flywheel-based ups.
  • This system provides instantaneous ride-through power during voltage sags, preventing costly production line stoppages that could occur in milliseconds. This application avoids the large footprint and chemical hazards of battery rooms. However, the technology faces challenges from the high initial capital expenditure compared to electrochemical alternatives and a physical limitation on energy discharge duration.
  • Advancements in carbon fiber composites and magnetic levitation are enhancing power density and efficiency, positioning these systems as critical for grid stabilization and industrial resilience. The focus remains on leveraging the long operational life and high-power capabilities of the flywheel rotor.

What will be the Size of the Flywheel Energy Storage Market during the forecast period?

Get Key Insights on Market Forecast (PDF) Request Free Sample

How is the Flywheel Energy Storage Market Segmented?

The flywheel energy storage industry research report provides comprehensive data (region-wise segment analysis), with forecasts and estimates in "USD million" for the period 2026-2030, as well as historical data from 2020-2024 for the following segments.

  • Type
    • Composite rims
    • Steel rims
  • Technology
    • UPS
    • Energy services
    • Transportation
    • Others
  • Component
    • Flywheel rotor
    • Motor-generator
    • Magnetic bearings
    • Others
  • Geography
    • North America
      • US
      • Canada
      • Mexico
    • Europe
      • Germany
      • UK
      • France
    • APAC
      • China
      • Japan
      • India
    • Middle East and Africa
      • South Africa
      • UAE
      • Saudi Arabia
    • South America
      • Brazil
      • Argentina
    • Rest of World (ROW)

By Type Insights

The composite rims segment is estimated to witness significant growth during the forecast period.

The composite rims segment is advancing through the adoption of high-speed rotor designs leveraging advanced carbon fiber composites. These systems are engineered to manage extreme centrifugal force, enabling higher rotational energy storage.

Innovations like the hubless rotor design, created through precision filament winding process, are targeting critical power applications and industrial power quality needs. This architecture enhances round-trip efficiency by over 15% in specific grid scenarios.

Such technology is pivotal for renewable energy integration and providing voltage sag compensation for sensitive loads.

The flywheel rotor in these systems is crucial for applications from railway energy recovery to supplying remote community power, demonstrating a significant shift from traditional steel-based designs.

Request Free Sample

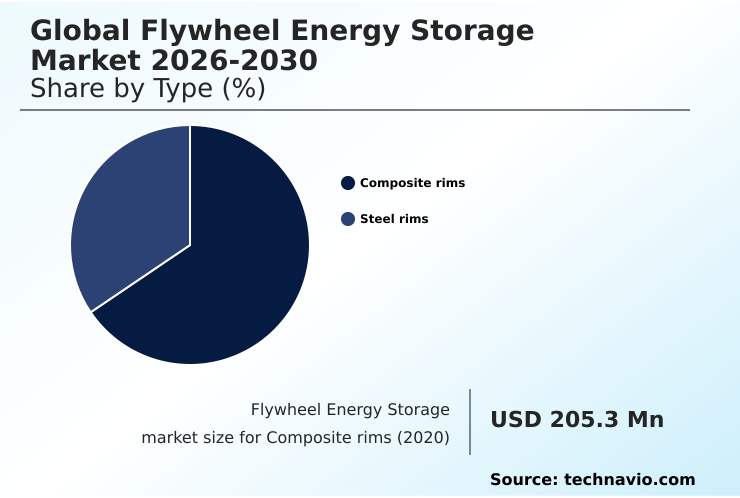
The Composite rims segment was valued at USD 285.8 million in 2024 and showed a gradual increase during the forecast period.

Request Free Sample

Regional Analysis

North America is estimated to contribute 38.8% to the growth of the global market during the forecast period.Technavio’s analysts have elaborately explained the regional trends and drivers that shape the market during the forecast period.

See How Flywheel Energy Storage Market Demand is Rising in North America Request Free Sample

The geographic landscape of the flywheel energy storage market is led by North America, which commands over 38% of the incremental growth opportunity.

This region's demand is heavily driven by the need for uninterruptible power supply solutions in the rapidly expanding AI data center sector, highlighted by single projects requiring up to 400 MW of power infrastructure.

In Europe, the focus is on grid stabilization services and the decarbonization of heavy industry. Meanwhile, the APAC region is adopting these systems for grid modernization and supporting its vast industrial base.

Across all regions, the technology serves as a key grid-forming asset, providing essential voltage stabilization and fast frequency response. Its role in off-grid power solutions and supporting distributed energy resources is also expanding, especially in areas with underdeveloped grid infrastructure.

Market Dynamics

Our researchers analyzed the data with 2025 as the base year, along with the key drivers, trends, and challenges. A holistic analysis of drivers will help companies refine their marketing strategies to gain a competitive advantage.

  • A comprehensive cost-benefit analysis of flywheel UPS systems reveals a complex trade-off when assessing flywheel vs battery for frequency response.
  • While the upfront investment for kinetic storage can be higher, a detailed lifecycle cost comparison of flywheel storage often demonstrates superior long-term value, with total cost of ownership potentially being 40% lower over a 20-year span due to minimal degradation and maintenance.
  • The high-speed flywheel design for energy density, often leveraging advanced materials, is critical for applications in semiconductor fabrication and data centers. In the transportation sector, the application of flywheels in railway regenerative braking and as flywheel power boosters for grid-constrained chargers showcases their versatility. Specifically, kinetic energy storage for EV fast charging is solving critical infrastructure bottlenecks.
  • The debate over carbon fiber rotor vs steel rotor performance continues, with each suited to different applications, from industrial peak shaving to providing synthetic inertia. The impact of magnetic bearing design on flywheel efficiency is a key area of R&D, as is the development of hybrid flywheel-battery storage system designs.
  • This technology is also finding a niche in specialized areas, with flywheel technology for directed energy weapons being explored.
  • Ultimately, the role of flywheels in grid inertia services and using flywheels for microgrid stabilization are becoming indispensable for a renewable-heavy energy future, especially for systems in off-highway machinery and flywheel UPS for hyperscale data centers, which require both reliability and efficiency.
  • Assessing flywheel round-trip efficiency remains a key performance metric for all these applications, as does their integration with renewable energy sources.

What are the key market drivers leading to the rise in the adoption of Flywheel Energy Storage Industry?

  • The critical imperative for enhanced grid inertia and improved microgrid resiliency is a key driver for the flywheel energy storage market.

  • The market is propelled by the need for synthetic inertia solutions as grids transition to intermittent renewables. Flywheels provide this critical grid inertia, offering instantaneous response to maintain stability.
  • This capability is vital for ancillary service contracts and ensuring microgrid resiliency. In the transport sector, flywheels are solving the last mile power problem for EV charging infrastructure support, enabling megawatt-level charging where grid connections are weak.
  • For instance, a single 400-megawatt contract for an AI data center highlights the demand for data center power protection. This demand is driven by the need for reliable, high-power density backup that can handle the volatile loads of modern computing.
  • The core flywheel rotor technology delivers the necessary power outage ride-through and short-duration discharge needed for these critical systems.

What are the market trends shaping the Flywheel Energy Storage Industry?

  • The emergence of hybrid storage architectures, which integrate flywheels with other assets like chemical batteries, is a defining market trend. This approach optimizes system performance by leveraging the distinct advantages of each technology.

  • A dominant trend is the move toward hybrid architectures and heavy machinery hybridization, where the flywheel-based UPS offers significant advantages. By integrating a kinetic power booster, industrial operators in construction and mining can achieve diesel generator downsizing by up to 60%, a significant operational efficiency.
  • These hybrid systems, which support the decarbonization of heavy industry, leverage the flywheel's high cycle life to handle frequent, high-power events, which can extend the operational lifespan of paired chemical batteries by over 50%. This synergy is creating new opportunities in railway energy recovery and for mission-critical power protection.
  • The underlying technologies, such as the power electronics interface and advancements in mechanical energy storage, are enabling more sophisticated grid stabilization services and dynamic load smoothing, reinforcing the value of kinetic solutions in a diverse range of applications.

What challenges does the Flywheel Energy Storage Industry face during its growth?

  • A key challenge affecting industry growth is the economic viability gap, which is increasingly driven by the rapidly falling costs of lithium-ion batteries.

  • The primary market challenge is the economic competition from electrochemical alternatives, as prices for certain battery cells have fallen by nearly 50% in under a year, amplifying the high initial capital expenditure of flywheel systems. This creates a difficult grid constraint problem for manufacturers.
  • Another significant hurdle is the inherent energy discharge duration mismatch; flywheels excel at providing high-power density for seconds or minutes, but the grid increasingly demands storage for four to twelve hours, a range where technologies like the long-duration flywheel are less practical.
  • Furthermore, the supply chain for high-performance components like carbon fiber composites and magnetic bearings, essential for managing centrifugal force, is volatile. This dependency limits production scalability for utility-scale frequency regulation and creates risks for projects requiring industrial pulsed power or virtual synchronous generator capabilities.

Exclusive Technavio Analysis on Customer Landscape

The flywheel energy storage market forecasting report includes the adoption lifecycle of the market, covering from the innovator’s stage to the laggard’s stage. It focuses on adoption rates in different regions based on penetration. Furthermore, the flywheel energy storage market report also includes key purchase criteria and drivers of price sensitivity to help companies evaluate and develop their market growth analysis strategies.

Customer Landscape of Flywheel Energy Storage Industry

Competitive Landscape

Companies are implementing various strategies, such as strategic alliances, flywheel energy storage market forecast, partnerships, mergers and acquisitions, geographical expansion, and product/service launches, to enhance their presence in the industry.

ABB Ltd. - Leading providers deliver advanced kinetic energy storage systems designed for grid stabilization, uninterruptible power supply, and industrial power quality, meeting demanding high-cycle, rapid-response application requirements.

The industry research and growth report includes detailed analyses of the competitive landscape of the market and information about key companies, including:

  • ABB Ltd.
  • Active Power Solutions Ltd.
  • Amber Kinetics Inc.
  • Beacon Power LLC
  • Calnetix Technologies LLC
  • Dumarey Group N.V.
  • ENERGIESTRO
  • EnerSys
  • Hitachi Energy Ltd.
  • Kinetic Traction Systems Inc.
  • Oxto Ltd.
  • Parker Hannifin Corp.
  • Piller Group GmbH
  • PowerTHRU, Inc
  • Revterra
  • Schneider Electric SE
  • Siemens AG
  • SOCOMEC Group
  • STORNETIC GmbH
  • VYCON Inc.

Qualitative and quantitative analysis of companies has been conducted to help clients understand the wider business environment as well as the strengths and weaknesses of key industry players. Data is qualitatively analyzed to categorize companies as pure play, category-focused, industry-focused, and diversified; it is quantitatively analyzed to categorize companies as dominant, leading, strong, tentative, and weak.

Recent Development and News in Flywheel energy storage market

  • In November, 2025, Piller Power Systems secured a 400-megawatt contract to supply power infrastructure, including its flywheel-based dynamic UPS technology, for a new artificial intelligence data center in the United States.
  • In October, 2025, Amber Kinetics finalized a strategic partnership with Indian Energy, a Native American-owned microgrid developer, to deploy its long-duration flywheel energy storage systems across tribal reservations in the United States.
  • In September, 2025, the Dumarey Group successfully deployed its Green Power Peak Power 200 flywheel system at Dubai Harbour to support a heavy-duty tower crane, demonstrating significant fuel and emissions reductions.
  • In March, 2025, Zooz Power presented its strategic roadmap at a major industry conference for deploying kinetic power boosters to establish ultra-fast charging corridors along key transport routes with weak grid infrastructure.

Dive into Technavio’s robust research methodology, blending expert interviews, extensive data synthesis, and validated models for unparalleled Flywheel Energy Storage Market insights. See full methodology.

Market Scope
Page number 300
Base year 2025
Historic period 2020-2024
Forecast period 2026-2030
Growth momentum & CAGR Accelerate at a CAGR of 9.9%
Market growth 2026-2030 USD 283.5 million
Market structure Fragmented
YoY growth 2025-2026(%) 9.3%
Key countries US, Canada, Mexico, Germany, UK, France, Italy, Spain, The Netherlands, China, Japan, India, South Korea, Australia, Indonesia, South Africa, UAE, Saudi Arabia, Egypt, Morocco, Brazil, Argentina and Chile
Competitive landscape Leading Companies, Market Positioning of Companies, Competitive Strategies, and Industry Risks

Request Free Sample

Research Analyst Overview

  • The flywheel energy storage market is evolving from a niche power quality solution to a foundational component of resilient energy systems. The technology's capacity for near-infinite cycle life and high-power density makes it essential for applications requiring rapid frequency regulation and voltage stabilization.
  • Systems utilizing advanced carbon fiber composites and magnetic levitation are pushing the boundaries of round-trip efficiency and energy storage capacity. Boardroom decisions are increasingly influenced by the ESG benefits of mechanical energy storage, as it provides a non-flammable, chemical-free alternative for uninterruptible power supply, aligning with corporate sustainability mandates.
  • Industrial applications report diesel generator downsizing by as much as 60%, a compelling operational advantage. Key components like the motor-generator and power conversion system, combined with sophisticated rotor balancing and vacuum containment, enable the flywheel-based UPS to function as a reliable grid-forming asset.
  • This technology is critical for peak shaving, regenerative braking, and ensuring power quality through its short-duration discharge capability, addressing grid frequency deviation and supporting ancillary services.
  • The development of the long-duration flywheel and hubless rotor design, using filament winding process to manage centrifugal force, is further expanding its role beyond that of a simple kinetic power booster to a versatile kinetic energy storage system with an advanced power electronics interface.

What are the Key Data Covered in this Flywheel Energy Storage Market Research and Growth Report?

  • What is the expected growth of the Flywheel Energy Storage Market between 2026 and 2030?

    • USD 283.5 million, at a CAGR of 9.9%

  • What segmentation does the market report cover?

    • The report is segmented by Type (Composite rims, and Steel rims), Technology (UPS, Energy services, Transportation, and Others), Component (Flywheel rotor, Motor-generator, Magnetic bearings, and Others) and Geography (North America, Europe, APAC, Middle East and Africa, South America)

  • Which regions are analyzed in the report?

    • North America, Europe, APAC, Middle East and Africa and South America

  • What are the key growth drivers and market challenges?

    • Critical imperative for grid inertia and microgrid resiliency, Economic viability gap driven by falling lithium-ion costs

  • Who are the major players in the Flywheel Energy Storage Market?

    • ABB Ltd., Active Power Solutions Ltd., Amber Kinetics Inc., Beacon Power LLC, Calnetix Technologies LLC, Dumarey Group N.V., ENERGIESTRO, EnerSys, Hitachi Energy Ltd., Kinetic Traction Systems Inc., Oxto Ltd., Parker Hannifin Corp., Piller Group GmbH, PowerTHRU, Inc, Revterra, Schneider Electric SE, Siemens AG, SOCOMEC Group, STORNETIC GmbH and VYCON Inc.

Market Research Insights

  • Market dynamics are shifting as flywheel systems enable new applications in challenging environments. The technology facilitates the decarbonization of heavy industry, with deployments demonstrating diesel generator downsizing by up to 60% by handling peak loads, a significant business outcome. This is achieved through effective dynamic load smoothing.
  • This performance is a key differentiator, particularly as competing battery cell costs fell by nearly 50% in the last year, which pressures the capital expenditure models for kinetic storage. Nevertheless, flywheel technology is proving indispensable for EV charging infrastructure support and mission-critical power protection in data centers.
  • Its role in ensuring microgrid resiliency and enabling broader renewable energy integration underscores its value beyond simple cost comparisons, focusing on long-term reliability and operational excellence.

We can help! Our analysts can customize this flywheel energy storage market research report to meet your requirements.

Get in touch

1. Executive Summary

1.1 Market overview

Executive Summary - Chart on Market Overview
Executive Summary - Data Table on Market Overview
Executive Summary - Chart on Global Market Characteristics
Executive Summary - Chart on Market by Geography
Executive Summary - Chart on Market Segmentation by Type
Executive Summary - Chart on Market Segmentation by Technology
Executive Summary - Chart on Market Segmentation by Component
Executive Summary - Chart on Incremental Growth
Executive Summary - Data Table on Incremental Growth
Executive Summary - Chart on Company Market Positioning

2. Technavio Analysis

2.1 Analysis of price sensitivity, lifecycle, customer purchase basket, adoption rates, and purchase criteria

2.2 Criticality of inputs and Factors of differentiation

Chart on Overview on criticality of inputs and factors of differentiation

2.3 Factors of disruption

Chart on Overview on factors of disruption

2.4 Impact of drivers and challenges

Chart on Impact of drivers and challenges in 2025 and 2030

3. Market Landscape

3.1 Market ecosystem

Chart on Parent Market
Data Table on - Parent Market

3.2 Market characteristics

Chart on Market characteristics analysis

3.3 Value chain analysis

Chart on Value chain analysis

4. Market Sizing

4.1 Market definition

Data Table on Offerings of companies included in the market definition

4.2 Market segment analysis

Market segments

4.3 Market size 2025

4.4 Market outlook: Forecast for 2025-2030

Chart on Global - Market size and forecast 2025-2030 ($ million)
Data Table on Global - Market size and forecast 2025-2030 ($ million)
Chart on Global Market: Year-over-year growth 2025-2030 (%)
Data Table on Global Market: Year-over-year growth 2025-2030 (%)

5. Historic Market Size

5.1 Global Flywheel Energy Storage Market 2020 - 2024

Historic Market Size - Data Table on Global Flywheel Energy Storage Market 2020 - 2024 ($ million)

5.2 Type segment analysis 2020 - 2024

Historic Market Size - Type Segment 2020 - 2024 ($ million)

5.3 Technology segment analysis 2020 - 2024

Historic Market Size - Technology Segment 2020 - 2024 ($ million)

5.4 Component segment analysis 2020 - 2024

Historic Market Size - Component Segment 2020 - 2024 ($ million)

5.5 Geography segment analysis 2020 - 2024

Historic Market Size - Geography Segment 2020 - 2024 ($ million)

5.6 Country segment analysis 2020 - 2024

Historic Market Size - Country Segment 2020 - 2024 ($ million)

6. Qualitative Analysis

6.1 Impact of AI in the Global Flywheel Energy Storage Market

7. Five Forces Analysis

7.1 Five forces summary

Five forces analysis - Comparison between 2025 and 2030

7.2 Bargaining power of buyers

Bargaining power of buyers - Impact of key factors 2025 and 2030

7.3 Bargaining power of suppliers

Bargaining power of suppliers - Impact of key factors in 2025 and 2030

7.4 Threat of new entrants

Threat of new entrants - Impact of key factors in 2025 and 2030

7.5 Threat of substitutes

Threat of substitutes - Impact of key factors in 2025 and 2030

7.6 Threat of rivalry

Threat of rivalry - Impact of key factors in 2025 and 2030

7.7 Market condition

Chart on Market condition - Five forces 2025 and 2030

8. Market Segmentation by Type

8.1 Market segments

Chart on Type - Market share 2025-2030 (%)
Data Table on Type - Market share 2025-2030 (%)

8.2 Comparison by Type

Chart on Comparison by Type
Data Table on Comparison by Type

8.3 Composite rims - Market size and forecast 2025-2030

Chart on Composite rims - Market size and forecast 2025-2030 ($ million)
Data Table on Composite rims - Market size and forecast 2025-2030 ($ million)
Chart on Composite rims - Year-over-year growth 2025-2030 (%)
Data Table on Composite rims - Year-over-year growth 2025-2030 (%)

8.4 Steel rims - Market size and forecast 2025-2030

Chart on Steel rims - Market size and forecast 2025-2030 ($ million)
Data Table on Steel rims - Market size and forecast 2025-2030 ($ million)
Chart on Steel rims - Year-over-year growth 2025-2030 (%)
Data Table on Steel rims - Year-over-year growth 2025-2030 (%)

8.5 Market opportunity by Type

Market opportunity by Type ($ million)
Data Table on Market opportunity by Type ($ million)

9. Market Segmentation by Technology

9.1 Market segments

Chart on Technology - Market share 2025-2030 (%)
Data Table on Technology - Market share 2025-2030 (%)

9.2 Comparison by Technology

Chart on Comparison by Technology
Data Table on Comparison by Technology

9.3 UPS - Market size and forecast 2025-2030

Chart on UPS - Market size and forecast 2025-2030 ($ million)
Data Table on UPS - Market size and forecast 2025-2030 ($ million)
Chart on UPS - Year-over-year growth 2025-2030 (%)
Data Table on UPS - Year-over-year growth 2025-2030 (%)

9.4 Energy services - Market size and forecast 2025-2030

Chart on Energy services - Market size and forecast 2025-2030 ($ million)
Data Table on Energy services - Market size and forecast 2025-2030 ($ million)
Chart on Energy services - Year-over-year growth 2025-2030 (%)
Data Table on Energy services - Year-over-year growth 2025-2030 (%)

9.5 Transportation - Market size and forecast 2025-2030

Chart on Transportation - Market size and forecast 2025-2030 ($ million)
Data Table on Transportation - Market size and forecast 2025-2030 ($ million)
Chart on Transportation - Year-over-year growth 2025-2030 (%)
Data Table on Transportation - Year-over-year growth 2025-2030 (%)

9.6 Others - Market size and forecast 2025-2030

Chart on Others - Market size and forecast 2025-2030 ($ million)
Data Table on Others - Market size and forecast 2025-2030 ($ million)
Chart on Others - Year-over-year growth 2025-2030 (%)
Data Table on Others - Year-over-year growth 2025-2030 (%)

9.7 Market opportunity by Technology

Market opportunity by Technology ($ million)
Data Table on Market opportunity by Technology ($ million)

10. Market Segmentation by Component

10.1 Market segments

Chart on Component - Market share 2025-2030 (%)
Data Table on Component - Market share 2025-2030 (%)

10.2 Comparison by Component

Chart on Comparison by Component
Data Table on Comparison by Component

10.3 Flywheel rotor - Market size and forecast 2025-2030

Chart on Flywheel rotor - Market size and forecast 2025-2030 ($ million)
Data Table on Flywheel rotor - Market size and forecast 2025-2030 ($ million)
Chart on Flywheel rotor - Year-over-year growth 2025-2030 (%)
Data Table on Flywheel rotor - Year-over-year growth 2025-2030 (%)

10.4 Motor-generator - Market size and forecast 2025-2030

Chart on Motor-generator - Market size and forecast 2025-2030 ($ million)
Data Table on Motor-generator - Market size and forecast 2025-2030 ($ million)
Chart on Motor-generator - Year-over-year growth 2025-2030 (%)
Data Table on Motor-generator - Year-over-year growth 2025-2030 (%)

10.5 Magnetic bearings - Market size and forecast 2025-2030

Chart on Magnetic bearings - Market size and forecast 2025-2030 ($ million)
Data Table on Magnetic bearings - Market size and forecast 2025-2030 ($ million)
Chart on Magnetic bearings - Year-over-year growth 2025-2030 (%)
Data Table on Magnetic bearings - Year-over-year growth 2025-2030 (%)

10.6 Others - Market size and forecast 2025-2030

Chart on Others - Market size and forecast 2025-2030 ($ million)
Data Table on Others - Market size and forecast 2025-2030 ($ million)
Chart on Others - Year-over-year growth 2025-2030 (%)
Data Table on Others - Year-over-year growth 2025-2030 (%)

10.7 Market opportunity by Component

Market opportunity by Component ($ million)
Data Table on Market opportunity by Component ($ million)

11. Customer Landscape

11.1 Customer landscape overview

Analysis of price sensitivity, lifecycle, customer purchase basket, adoption rates, and purchase criteria

12. Geographic Landscape

12.1 Geographic segmentation

Chart on Market share by geography 2025-2030 (%)
Data Table on Market share by geography 2025-2030 (%)

12.2 Geographic comparison

Chart on Geographic comparison
Data Table on Geographic comparison

12.3 North America - Market size and forecast 2025-2030

Chart on North America - Market size and forecast 2025-2030 ($ million)
Data Table on North America - Market size and forecast 2025-2030 ($ million)
Chart on North America - Year-over-year growth 2025-2030 (%)
Data Table on North America - Year-over-year growth 2025-2030 (%)
Chart on Regional Comparison - North America
Data Table on Regional Comparison - North America

12.3.1 US - Market size and forecast 2025-2030

Chart on US - Market size and forecast 2025-2030 ($ million)
Data Table on US - Market size and forecast 2025-2030 ($ million)
Chart on US - Year-over-year growth 2025-2030 (%)
Data Table on US - Year-over-year growth 2025-2030 (%)

12.3.2 Canada - Market size and forecast 2025-2030

Chart on Canada - Market size and forecast 2025-2030 ($ million)
Data Table on Canada - Market size and forecast 2025-2030 ($ million)
Chart on Canada - Year-over-year growth 2025-2030 (%)
Data Table on Canada - Year-over-year growth 2025-2030 (%)

12.3.3 Mexico - Market size and forecast 2025-2030

Chart on Mexico - Market size and forecast 2025-2030 ($ million)
Data Table on Mexico - Market size and forecast 2025-2030 ($ million)
Chart on Mexico - Year-over-year growth 2025-2030 (%)
Data Table on Mexico - Year-over-year growth 2025-2030 (%)

12.4 Europe - Market size and forecast 2025-2030

Chart on Europe - Market size and forecast 2025-2030 ($ million)
Data Table on Europe - Market size and forecast 2025-2030 ($ million)
Chart on Europe - Year-over-year growth 2025-2030 (%)
Data Table on Europe - Year-over-year growth 2025-2030 (%)
Chart on Regional Comparison - Europe
Data Table on Regional Comparison - Europe

12.4.1 Germany - Market size and forecast 2025-2030

Chart on Germany - Market size and forecast 2025-2030 ($ million)
Data Table on Germany - Market size and forecast 2025-2030 ($ million)
Chart on Germany - Year-over-year growth 2025-2030 (%)
Data Table on Germany - Year-over-year growth 2025-2030 (%)

12.4.2 UK - Market size and forecast 2025-2030

Chart on UK - Market size and forecast 2025-2030 ($ million)
Data Table on UK - Market size and forecast 2025-2030 ($ million)
Chart on UK - Year-over-year growth 2025-2030 (%)
Data Table on UK - Year-over-year growth 2025-2030 (%)

12.4.3 France - Market size and forecast 2025-2030

Chart on France - Market size and forecast 2025-2030 ($ million)
Data Table on France - Market size and forecast 2025-2030 ($ million)
Chart on France - Year-over-year growth 2025-2030 (%)
Data Table on France - Year-over-year growth 2025-2030 (%)

12.4.4 Italy - Market size and forecast 2025-2030

Chart on Italy - Market size and forecast 2025-2030 ($ million)
Data Table on Italy - Market size and forecast 2025-2030 ($ million)
Chart on Italy - Year-over-year growth 2025-2030 (%)
Data Table on Italy - Year-over-year growth 2025-2030 (%)

12.4.5 Spain - Market size and forecast 2025-2030

Chart on Spain - Market size and forecast 2025-2030 ($ million)
Data Table on Spain - Market size and forecast 2025-2030 ($ million)
Chart on Spain - Year-over-year growth 2025-2030 (%)
Data Table on Spain - Year-over-year growth 2025-2030 (%)

12.4.6 The Netherlands - Market size and forecast 2025-2030

Chart on The Netherlands - Market size and forecast 2025-2030 ($ million)
Data Table on The Netherlands - Market size and forecast 2025-2030 ($ million)
Chart on The Netherlands - Year-over-year growth 2025-2030 (%)
Data Table on The Netherlands - Year-over-year growth 2025-2030 (%)

12.5 APAC - Market size and forecast 2025-2030

Chart on APAC - Market size and forecast 2025-2030 ($ million)
Data Table on APAC - Market size and forecast 2025-2030 ($ million)
Chart on APAC - Year-over-year growth 2025-2030 (%)
Data Table on APAC - Year-over-year growth 2025-2030 (%)
Chart on Regional Comparison - APAC
Data Table on Regional Comparison - APAC

12.5.1 China - Market size and forecast 2025-2030

Chart on China - Market size and forecast 2025-2030 ($ million)
Data Table on China - Market size and forecast 2025-2030 ($ million)
Chart on China - Year-over-year growth 2025-2030 (%)
Data Table on China - Year-over-year growth 2025-2030 (%)

12.5.2 Japan - Market size and forecast 2025-2030

Chart on Japan - Market size and forecast 2025-2030 ($ million)
Data Table on Japan - Market size and forecast 2025-2030 ($ million)
Chart on Japan - Year-over-year growth 2025-2030 (%)
Data Table on Japan - Year-over-year growth 2025-2030 (%)

12.5.3 India - Market size and forecast 2025-2030

Chart on India - Market size and forecast 2025-2030 ($ million)
Data Table on India - Market size and forecast 2025-2030 ($ million)
Chart on India - Year-over-year growth 2025-2030 (%)
Data Table on India - Year-over-year growth 2025-2030 (%)

12.5.4 South Korea - Market size and forecast 2025-2030

Chart on South Korea - Market size and forecast 2025-2030 ($ million)
Data Table on South Korea - Market size and forecast 2025-2030 ($ million)
Chart on South Korea - Year-over-year growth 2025-2030 (%)
Data Table on South Korea - Year-over-year growth 2025-2030 (%)

12.5.5 Australia - Market size and forecast 2025-2030

Chart on Australia - Market size and forecast 2025-2030 ($ million)
Data Table on Australia - Market size and forecast 2025-2030 ($ million)
Chart on Australia - Year-over-year growth 2025-2030 (%)
Data Table on Australia - Year-over-year growth 2025-2030 (%)

12.5.6 Indonesia - Market size and forecast 2025-2030

Chart on Indonesia - Market size and forecast 2025-2030 ($ million)
Data Table on Indonesia - Market size and forecast 2025-2030 ($ million)
Chart on Indonesia - Year-over-year growth 2025-2030 (%)
Data Table on Indonesia - Year-over-year growth 2025-2030 (%)

12.6 Middle East and Africa - Market size and forecast 2025-2030

Chart on Middle East and Africa - Market size and forecast 2025-2030 ($ million)
Data Table on Middle East and Africa - Market size and forecast 2025-2030 ($ million)
Chart on Middle East and Africa - Year-over-year growth 2025-2030 (%)
Data Table on Middle East and Africa - Year-over-year growth 2025-2030 (%)
Chart on Regional Comparison - Middle East and Africa
Data Table on Regional Comparison - Middle East and Africa

12.6.1 South Africa - Market size and forecast 2025-2030

Chart on South Africa - Market size and forecast 2025-2030 ($ million)
Data Table on South Africa - Market size and forecast 2025-2030 ($ million)
Chart on South Africa - Year-over-year growth 2025-2030 (%)
Data Table on South Africa - Year-over-year growth 2025-2030 (%)

12.6.2 UAE - Market size and forecast 2025-2030

Chart on UAE - Market size and forecast 2025-2030 ($ million)
Data Table on UAE - Market size and forecast 2025-2030 ($ million)
Chart on UAE - Year-over-year growth 2025-2030 (%)
Data Table on UAE - Year-over-year growth 2025-2030 (%)

12.6.3 Saudi Arabia - Market size and forecast 2025-2030

Chart on Saudi Arabia - Market size and forecast 2025-2030 ($ million)
Data Table on Saudi Arabia - Market size and forecast 2025-2030 ($ million)
Chart on Saudi Arabia - Year-over-year growth 2025-2030 (%)
Data Table on Saudi Arabia - Year-over-year growth 2025-2030 (%)

12.6.4 Egypt - Market size and forecast 2025-2030

Chart on Egypt - Market size and forecast 2025-2030 ($ million)
Data Table on Egypt - Market size and forecast 2025-2030 ($ million)
Chart on Egypt - Year-over-year growth 2025-2030 (%)
Data Table on Egypt - Year-over-year growth 2025-2030 (%)

12.6.5 Morocco - Market size and forecast 2025-2030

Chart on Morocco - Market size and forecast 2025-2030 ($ million)
Data Table on Morocco - Market size and forecast 2025-2030 ($ million)
Chart on Morocco - Year-over-year growth 2025-2030 (%)
Data Table on Morocco - Year-over-year growth 2025-2030 (%)

12.7 South America - Market size and forecast 2025-2030

Chart on South America - Market size and forecast 2025-2030 ($ million)
Data Table on South America - Market size and forecast 2025-2030 ($ million)
Chart on South America - Year-over-year growth 2025-2030 (%)
Data Table on South America - Year-over-year growth 2025-2030 (%)
Chart on Regional Comparison - South America
Data Table on Regional Comparison - South America

12.7.1 Brazil - Market size and forecast 2025-2030

Chart on Brazil - Market size and forecast 2025-2030 ($ million)
Data Table on Brazil - Market size and forecast 2025-2030 ($ million)
Chart on Brazil - Year-over-year growth 2025-2030 (%)
Data Table on Brazil - Year-over-year growth 2025-2030 (%)

12.7.2 Argentina - Market size and forecast 2025-2030

Chart on Argentina - Market size and forecast 2025-2030 ($ million)
Data Table on Argentina - Market size and forecast 2025-2030 ($ million)
Chart on Argentina - Year-over-year growth 2025-2030 (%)
Data Table on Argentina - Year-over-year growth 2025-2030 (%)

12.7.3 Chile - Market size and forecast 2025-2030

Chart on Chile - Market size and forecast 2025-2030 ($ million)
Data Table on Chile - Market size and forecast 2025-2030 ($ million)
Chart on Chile - Year-over-year growth 2025-2030 (%)
Data Table on Chile - Year-over-year growth 2025-2030 (%)

12.8 Market opportunity by geography

Market opportunity by geography ($ million)
Data Tables on Market opportunity by geography ($ million)

13. Drivers, Challenges, and Opportunity

13.1 Market drivers

Critical imperative for grid inertia and microgrid resiliency
Enabling ultra-fast electric vehicle charging infrastructure
Uninterruptible power for hyperscale data centers and AI infrastructure

13.2 Market challenges

Economic viability gap driven by falling lithium-ion costs
Duration mismatch in evolving grid landscape
Vulnerability to specialized material supply chains

13.3 Impact of drivers and challenges

Impact of drivers and challenges in 2025 and 2030

13.4 Market opportunities

Emergence of hybrid storage architectures
Decarbonization of heavy industry via kinetic recovery
Distributed power boosting for EV charging corridors

14. Competitive Landscape

14.1 Overview

14.2

Overview on criticality of inputs and factors of differentiation

14.3 Landscape disruption

Overview on factors of disruption

14.4 Industry risks

Impact of key risks on business

15. Competitive Analysis

15.1 Companies profiled

Companies covered

15.2 Company ranking index

15.3 Market positioning of companies

Matrix on companies position and classification

15.4 ABB Ltd.

ABB Ltd. - Overview
ABB Ltd. - Business segments
ABB Ltd. - Key news
ABB Ltd. - Key offerings
ABB Ltd. - Segment focus
SWOT

15.5 Active Power Solutions Ltd.

Active Power Solutions Ltd. - Overview
Active Power Solutions Ltd. - Product / Service
Active Power Solutions Ltd. - Key offerings
SWOT

15.6 Amber Kinetics Inc.

Amber Kinetics Inc. - Overview
Amber Kinetics Inc. - Product / Service
Amber Kinetics Inc. - Key offerings
SWOT

15.7 Beacon Power LLC

Beacon Power LLC - Overview
Beacon Power LLC - Product / Service
Beacon Power LLC - Key offerings
SWOT

15.8 Calnetix Technologies LLC

Calnetix Technologies LLC - Overview
Calnetix Technologies LLC - Product / Service
Calnetix Technologies LLC - Key offerings
SWOT

15.9 Dumarey Group N.V.

Dumarey Group N.V. - Overview
Dumarey Group N.V. - Product / Service
Dumarey Group N.V. - Key offerings
SWOT

15.10 ENERGIESTRO

ENERGIESTRO - Overview
ENERGIESTRO - Product / Service
ENERGIESTRO - Key offerings
SWOT

15.11 EnerSys

EnerSys - Overview
EnerSys - Business segments
EnerSys - Key news
EnerSys - Key offerings
EnerSys - Segment focus
SWOT

15.12 Hitachi Energy Ltd.

Hitachi Energy Ltd. - Overview
Hitachi Energy Ltd. - Product / Service
Hitachi Energy Ltd. - Key offerings
SWOT

15.13 Kinetic Traction Systems Inc.

Kinetic Traction Systems Inc. - Overview
Kinetic Traction Systems Inc. - Product / Service
Kinetic Traction Systems Inc. - Key offerings
SWOT

15.14 Oxto Ltd.

Oxto Ltd. - Overview
Oxto Ltd. - Product / Service
Oxto Ltd. - Key offerings
SWOT

15.15 Piller Group GmbH

Piller Group GmbH - Overview
Piller Group GmbH - Product / Service
Piller Group GmbH - Key offerings
SWOT

15.16 Revterra

Revterra - Overview
Revterra - Product / Service
Revterra - Key offerings
SWOT

15.17 Schneider Electric SE

Schneider Electric SE - Overview
Schneider Electric SE - Business segments
Schneider Electric SE - Key news
Schneider Electric SE - Key offerings
Schneider Electric SE - Segment focus
SWOT

15.18 Siemens AG

Siemens AG - Overview
Siemens AG - Business segments
Siemens AG - Key news
Siemens AG - Key offerings
Siemens AG - Segment focus
SWOT

16. Appendix

16.1 Scope of the report

Market definition
Objectives
Notes and caveats

16.2 Inclusions and exclusions checklist

Inclusions checklist
Exclusions checklist

16.3 Currency conversion rates for US$

16.4 Research methodology

16.5 Data procurement

Information sources

16.6 Data validation

16.7 Validation techniques employed for market sizing

16.8 Data synthesis

16.9 360 degree market analysis

16.10 List of abbreviations

Research Methodology

Technavio presents a detailed picture of the market by way of study, synthesis, and summation of data from multiple sources. The analysts have presented the various facets of the market with a particular focus on identifying the key industry influencers. The data thus presented is comprehensive, reliable, and the result of extensive research, both primary and secondary.

INFORMATION SOURCES

Primary sources

  • Manufacturers and suppliers
  • Channel partners
  • Industry experts
  • Strategic decision makers

Secondary sources

  • Industry journals and periodicals
  • Government data
  • Financial reports of key industry players
  • Historical data
  • Press releases

DATA ANALYSIS

Data Synthesis

  • Collation of data
  • Estimation of key figures
  • Analysis of derived insights

Data Validation

  • Triangulation with data models
  • Reference against proprietary databases
  • Corroboration with industry experts

REPORT WRITING

Qualitative

  • Market drivers
  • Market challenges
  • Market trends
  • Five forces analysis

Quantitative

  • Market size and forecast
  • Market segmentation
  • Geographical insights
  • Competitive landscape

Interested in this report?

Get your sample now to see our research methodology and insights!

Download Now

Frequently Asked Questions

Flywheel Energy Storage market growth will increase by USD 283.5 million during 2026-2030.

The Flywheel Energy Storage market is expected to grow at a CAGR of 9.9% during 2026-2030.

Flywheel Energy Storage market is segmented by Type (Composite rims, Steel rims) Technology (UPS, Energy services, Transportation, Others) Component (Flywheel rotor, Motor-generator, Magnetic bearings, Others)

ABB Ltd., Active Power Solutions Ltd., Amber Kinetics Inc., Beacon Power LLC, Calnetix Technologies LLC, Dumarey Group N.V., ENERGIESTRO, EnerSys, Hitachi Energy Ltd., Kinetic Traction Systems Inc., Oxto Ltd., Parker Hannifin Corp., Piller Group GmbH, PowerTHRU, Inc, Revterra, Schneider Electric SE, Siemens AG, SOCOMEC Group, STORNETIC GmbH, VYCON Inc. are a few of the key vendors in the Flywheel Energy Storage market.

North America will register the highest growth rate of 38.8% among the other regions. Therefore, the Flywheel Energy Storage market in North America is expected to garner significant business opportunities for the vendors during the forecast period.

US, Canada, Mexico, Germany, UK, France, Italy, Spain, The Netherlands, China, Japan, India, South Korea, Australia, Indonesia, South Africa, UAE, Saudi Arabia, Egypt, Morocco, Brazil, Argentina, Chile

  • Critical imperative for grid inertia and microgrid resiliency is the driving factor this market.

The Flywheel Energy Storage market vendors should focus on grabbing business opportunities from the Type segment as it accounted for the largest market share in the base year.