Floating Solar Panels Market Analysis, Size, and Forecast 2025-2029: APAC (China, India, and Japan), North America (US, Canada, and Mexico), Europe (Germany, Spain, and France), Middle East and Africa (UAE, Saudi Arabia, and South Africa), South America (Brazil and Argentina), and Rest of World (ROW)

Floating Solar Panels Market Analysis, Size, and Forecast 2025-2029:
APAC (China, India, and Japan), North America (US, Canada, and Mexico), Europe (Germany, Spain, and France), Middle East and Africa (UAE, Saudi Arabia, and South Africa), South America (Brazil and Argentina), and Rest of World (ROW)

Published: Dec 2025 293 Pages SKU: IRTNTR73216

Market Overview at a Glance

$1.04 B
Market Opportunity
18.9%
CAGR 2024 - 2029
69.4%
APAC Growth
$588.7 Mn
Stationery segment 2023

Floating Solar Panels Market Size 2025-2029

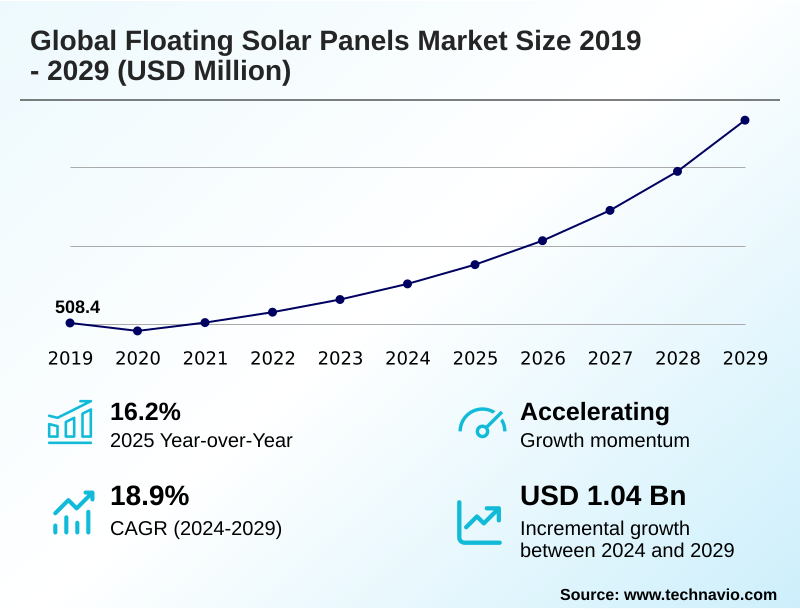
The floating solar panels market size is valued to increase by USD 1.04 billion, at a CAGR of 18.9% from 2024 to 2029. Increasing demand for renewable energy and government support will drive the floating solar panels market.

Major Market Trends & Insights

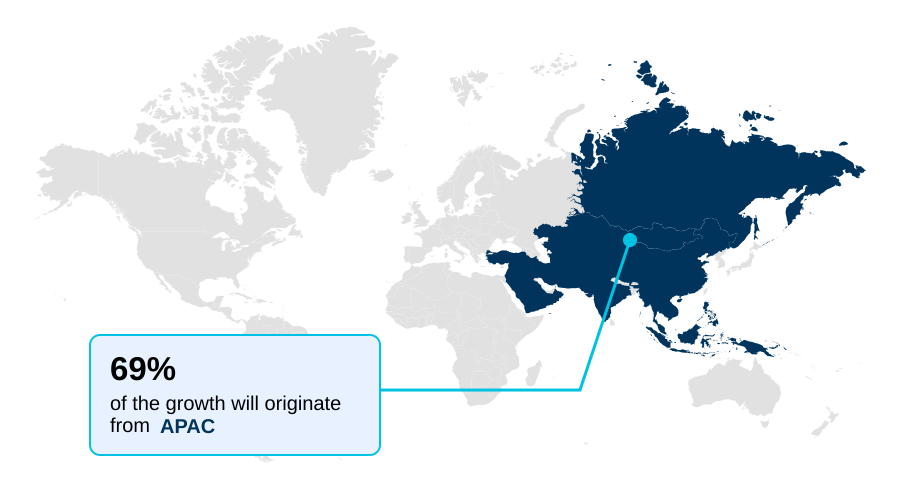
  • APAC dominated the market and accounted for a 69.4% growth during the forecast period.
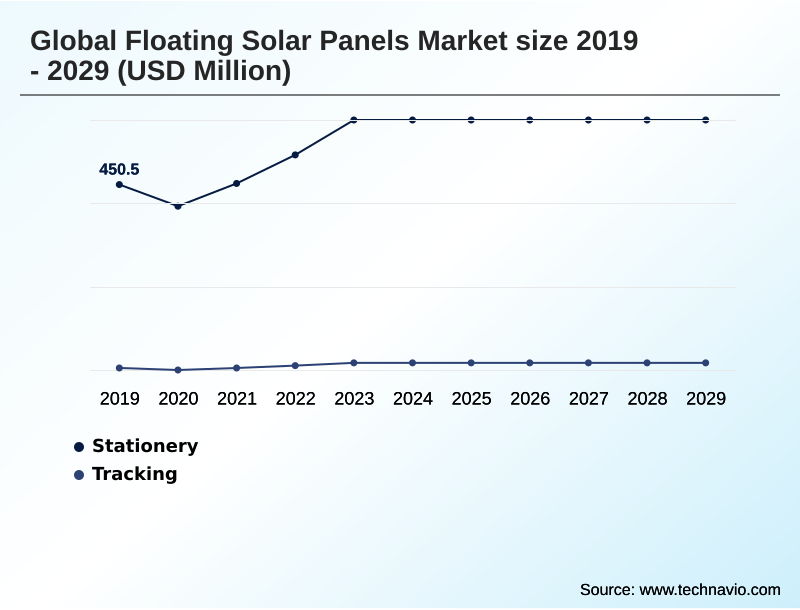
  • By Product - Stationery segment was valued at USD 588.7 million in 2023
  • By Technology - Photovoltaic (PV) segment accounted for the largest market revenue share in 2023

Market Size & Forecast

  • Market Opportunities: USD 1.29 billion
  • Market Future Opportunities: USD 1.04 billion
  • CAGR from 2024 to 2029 : 18.9%

Market Summary

  • The floating solar panels market is undergoing robust expansion, driven by the dual needs of increasing renewable energy capacity and overcoming land-use constraints. This technology, known as floatovoltaics, involves deploying photovoltaic systems on buoyant structures across water bodies like reservoirs and industrial ponds.
  • It offers distinct advantages over terrestrial installations, including enhanced energy yields from the natural cooling effect of water and reduced water evaporation. As governments worldwide intensify their decarbonization efforts, floating solar has emerged as a key solution, particularly for densely populated regions where land is scarce or expensive. A prime business scenario involves a utility company operating a hydropower facility.
  • By co-locating a floating solar array on the dam's reservoir, the utility can augment its power generation capacity, using the same grid connection infrastructure.
  • This hybrid approach smooths out daily power output, as solar generation peaks during the day while hydropower can be dispatched to meet evening demand, enhancing overall grid stability and creating a more resilient and efficient energy system without requiring additional land acquisition. This synergy is a powerful catalyst for market adoption and investment in integrated renewable energy projects.

What will be the Size of the Floating Solar Panels Market during the forecast period?

Get Key Insights on Market Forecast (PDF) Request Free Sample

How is the Floating Solar Panels Market Segmented?

The floating solar panels industry research report provides comprehensive data (region-wise segment analysis), with forecasts and estimates in "USD million" for the period 2025-2029, as well as historical data from 2019-2023 for the following segments.

  • Product
    • Stationery
    • Tracking
  • Technology
    • PV
    • CPV
    • CSP
  • Capacity
    • Below 5 MW
    • 5 to 50 MW
    • Above 50 MW
  • Geography
    • APAC
      • China
      • India
      • Japan
    • North America
      • US
      • Canada
      • Mexico
    • Europe
      • Germany
      • Spain
      • France
    • Middle East and Africa
      • UAE
      • Saudi Arabia
      • South Africa
    • South America
      • Brazil
      • Argentina
    • Rest of World (ROW)

By Product Insights

The stationery segment is estimated to witness significant growth during the forecast period.

The stationery sub-segment is foundational to the market, defined by fixed-tilt systems well-suited for calm water bodies.

These installations, often found on man-made reservoirs and in industrial pond solar solutions, leverage simpler engineering for their anchoring systems and FPV system components.

This approach reduces initial capital outlay and simplifies floating solar operational maintenance, accelerating project timelines for utility-scale floatovoltaics technology. The design prioritizes stability and durability, utilizing photovoltaic (PV) modules with high PID resistance and corrosion resistance.

While lacking the yield gains of tracking systems, stationery water body solar installations benefit from the natural water surface cooling effect, which can boost energy output by up to 15%.

This segment's growth is tied to its reliability and straightforward grid integration for FPV installation best practices.

Request Free Sample

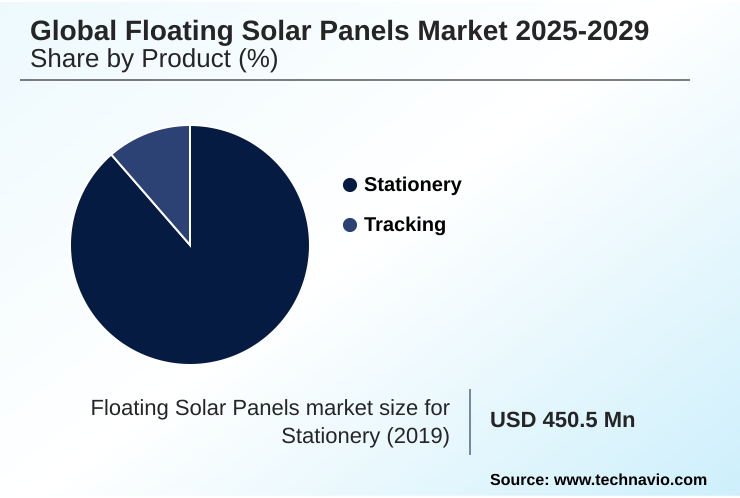
The Stationery segment was valued at USD 588.7 million in 2023 and showed a gradual increase during the forecast period.

Request Free Sample

Regional Analysis

APAC is estimated to contribute 69.4% to the growth of the global market during the forecast period.Technavio’s analysts have elaborately explained the regional trends and drivers that shape the market during the forecast period.

See How Floating Solar Panels Market Demand is Rising in APAC Request Free Sample

The geographic landscape of the market is predominantly led by the APAC region, which accounts for over 69% of the incremental growth, driven by ambitious floating solar project development in countries like China and India.

Europe is a rapidly maturing market, focusing on installations on quarry lakes and reservoirs, with countries like the Netherlands and France leading deployment. North America is an emerging market with significant potential, particularly for hybrid solar-hydropower configurations on existing dams.

The strategic focus in APAC is on large-scale reservoir solar farms, which require sophisticated floating PV system design and robust mooring systems.

In Europe, concerns around aquatic ecosystem management are driving innovation in materials and designs that support algae growth inhibition.

Across all regions, FPV project financing is increasingly tied to projects that offer grid stability services and incorporate advanced technologies like solar tracking systems and bifacial modules.

Market Dynamics

Our researchers analyzed the data with 2024 as the base year, along with the key drivers, trends, and challenges. A holistic analysis of drivers will help companies refine their marketing strategies to gain a competitive advantage.

  • Strategic decision-making in the floating solar sector requires a thorough cost-benefit analysis of floating solar vs land-based installations, factoring in land acquisition costs and enhanced energy yields.
  • The environmental impact of large-scale floating solar farms remains a critical consideration, necessitating detailed assessments of water quality impacts of floating solar panel shading and the development of effective decommissioning strategies for end-of-life floating solar farms.
  • Navigating the technological challenges in offshore floating solar projects, particularly advancements in mooring and anchoring for deep water FPV, is essential for unlocking new markets. Similarly, understanding the diverse regulatory frameworks for floating solar installations is crucial for successful permitting and stakeholder engagement for floating solar development.
  • For asset optimization, improving energy yield with floating solar tracking systems can provide returns that are over 25% higher than stationary setups. The long-term durability of floating solar components in water, analyzed through a comparison of different floating platform designs and materials, is fundamental to project bankability.
  • Many case studies of successful utility-scale floating solar projects showcase the economic viability of aquavoltaics for dual-income streams and the importance of integrating floating solar with existing hydropower infrastructure.
  • The role of floating solar in national decarbonization strategies is growing, but developers must address risk mitigation strategies for floating solar in extreme weather and overcome grid integration challenges for remote floating solar projects.
  • The market also sees significant potential for floating solar on industrial and wastewater ponds, though maintenance requirements and costs for floating solar installations remain a key planning factor.

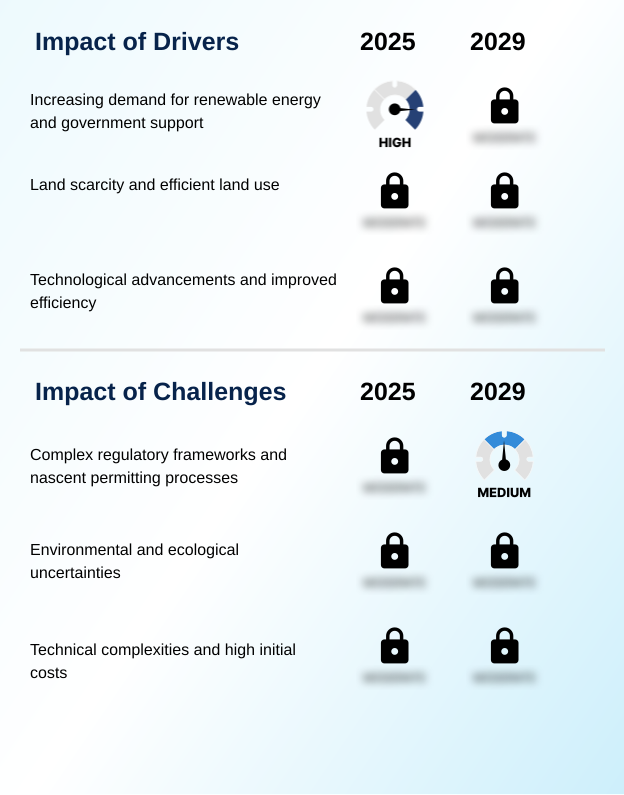
What are the key market drivers leading to the rise in the adoption of Floating Solar Panels Industry?

  • Increasing global demand for renewable energy, driven by decarbonization commitments and reinforced by supportive government policies, is a primary driver of market expansion.

  • Market growth is significantly driven by increasing land scarcity, positioning floating solar as a critical water surface land-use alternative for sustainable water infrastructure. This is particularly relevant for agricultural reservoir FPV and water treatment plant solar projects.
  • Technological advancements are another key driver, with innovations in floating substructures made from materials like high-density polyethylene (HDPE) enhancing durability and salt mist corrosion resistance for marine environment solar power.
  • The inherent water surface cooling effect naturally enhances panel efficiency by up to 15%, improving the economic viability of reservoir solar farms.
  • Furthermore, government support for renewable energy is accelerating the deployment of offshore FPV, which is supported by advancements in underwater cabling systems and hydro-ecological modeling to ensure minimal environmental disruption.

What are the market trends shaping the Floating Solar Panels Industry?

  • A predominant trend is the proliferation of large-scale projects and the expansion of installations into offshore environments. This strategic shift addresses land-use constraints and unlocks vast, untapped areas for solar energy generation.

  • A primary trend is the shift toward hybrid renewable energy systems and dual-use water surface applications, such as aquavoltaics, which maximize land and resource efficiency. The market is also seeing accelerated innovation in system components, with a focus on modular floating platforms and wave-dampening structures to enable larger utility-scale floating solar projects, including on inland water solar projects.
  • The adoption of advanced technologies like dual-axis trackers and panels with anti-soiling coating is increasing, with tracking systems capable of boosting floating solar energy generation by up to 25%. This focus on maximizing output is driving R&D into enhancing bifacial gain, which can be over 10% higher in aquatic settings.
  • These technological advancements in solar power on man-made lakes are essential for improving project economics.

What challenges does the Floating Solar Panels Industry face during its growth?

  • The industry's growth is challenged by complex regulatory frameworks and nascent permitting processes for floating solar projects.

  • A primary challenge in the floating solar market dynamics is the high initial capital cost, with projects often being 20-25% more expensive than land-based counterparts, complicating FPV project financing. Technical complexities surrounding floating solar array stability, especially the design of mooring systems for deep water, add to these costs.
  • The renewable energy permitting process is another significant hurdle, as it is often ill-defined for lake-mounted solar panels and requires detailed ecosystem impact analysis. Long-term environmental uncertainties are also a concern, as studies show that poorly designed industrial pond solar solutions can increase greenhouse gas emissions by nearly 27%.
  • Ensuring the durability of components like inter-module connectors against moisture requires advanced materials with high corrosion resistance, further impacting project costs.

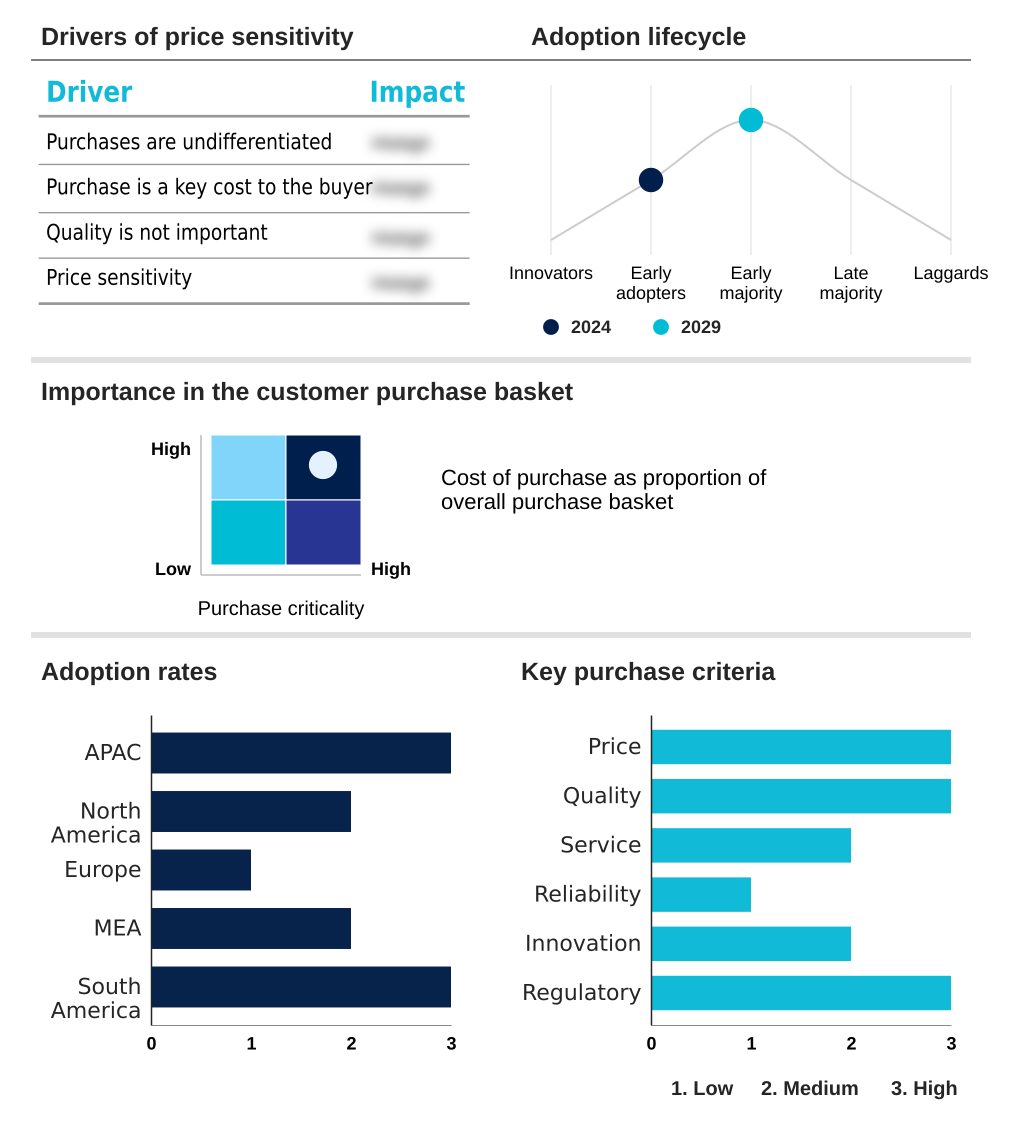
Exclusive Technavio Analysis on Customer Landscape

The floating solar panels market forecasting report includes the adoption lifecycle of the market, covering from the innovator’s stage to the laggard’s stage. It focuses on adoption rates in different regions based on penetration. Furthermore, the floating solar panels market report also includes key purchase criteria and drivers of price sensitivity to help companies evaluate and develop their market growth analysis strategies.

Customer Landscape of Floating Solar Panels Industry

Competitive Landscape

Companies are implementing various strategies, such as strategic alliances, floating solar panels market forecast, partnerships, mergers and acquisitions, geographical expansion, and product/service launches, to enhance their presence in the industry.

Ciel and Terre International - Offers patented, large-scale floating PV plant solutions, including the globally adopted Hydrelio floating solar system, which is utilized for diverse water-based installations worldwide.

The industry research and growth report includes detailed analyses of the competitive landscape of the market and information about key companies, including:

  • Ciel and Terre International
  • GCL System Integration Technology Co. Ltd.
  • Hanwha Group
  • JA Solar Technology Co. Ltd.
  • JinkoSolar Holding Co. Ltd.
  • KYOCERA Corp.
  • LONGi Green Energy Technology Co. Ltd.
  • Maxeon Solar Technologies Ltd.
  • Ocean Sun AS
  • Pristine Sun Corp.
  • Quant Solar
  • Sharp Corp.
  • Sungrow FPV SCI and TECH Co. Ltd.
  • Swimsol GmbH
  • Tata Power Co. Ltd.
  • Topper Floating Solar PV Mounting Manufacturer Co. Ltd.
  • Trina Solar Co. Ltd.
  • Vari Pontoons Pvt. Ltd.
  • Vikram Solar Ltd.

Qualitative and quantitative analysis of companies has been conducted to help clients understand the wider business environment as well as the strengths and weaknesses of key industry players. Data is qualitatively analyzed to categorize companies as pure play, category-focused, industry-focused, and diversified; it is quantitatively analyzed to categorize companies as dominant, leading, strong, tentative, and weak.

Recent Development and News in Floating solar panels market

  • In August 2024, Indonesian state utility PT PLN partnered with a Saudi Arabian firm to develop a 60-MW floating solar power plant at the Saguling Reservoir, signaling continued international investment in the region's renewable sector.
  • In October 2024, a subsidiary of Coal India issued an e-tender for a 5 MW grid-connected floating solar power project, highlighting the increasing adoption of the technology by state-owned enterprises in the energy sector to diversify their portfolios.
  • In January 2025, European industry experts advocated for prioritizing floating solar project development on man-made water bodies like sand pits to minimize ecological disruption and streamline permitting processes, reflecting a strategic shift toward sustainable siting.
  • In April 2025, Third Pillar announced an agreement with Diamond Infrastructure Solutions to develop 500 MW of utility-scale floating solar projects on water reservoirs across the United States, representing a major expansion of large-scale FPV capacity in North America.

Dive into Technavio’s robust research methodology, blending expert interviews, extensive data synthesis, and validated models for unparalleled Floating Solar Panels Market insights. See full methodology.

Market Scope
Page number 293
Base year 2024
Historic period 2019-2023
Forecast period 2025-2029
Growth momentum & CAGR Accelerate at a CAGR of 18.9%
Market growth 2025-2029 USD 1041.7 million
Market structure Fragmented
YoY growth 2024-2025(%) 16.2%
Key countries China, India, Japan, South Korea, Australia, Indonesia, US, Canada, Mexico, Germany, Spain, France, Italy, The Netherlands, UK, UAE, Saudi Arabia, Egypt, South Africa, Morocco, Brazil, Chile and Argentina
Competitive landscape Leading Companies, Market Positioning of Companies, Competitive Strategies, and Industry Risks

Request Free Sample

Research Analyst Overview

  • The market is characterized by rapid technological evolution, moving beyond standard photovoltaic (PV) modules to embrace advanced solutions. Innovations in bifacial modules, optimized for high bifacial gain over water, are becoming central to system design.
  • Component development is focused on improving the durability of floaters and buoyancy supports, with high-density polyethylene (HDPE) gaining prominence for its corrosion resistance and UV radiation resistance. The performance of anchoring systems and mooring systems is critical, especially for offshore FPV and nearshore FPV installations facing harsh marine conditions.
  • At a strategic level, the trend toward hybrid solar-hydropower systems is influencing boardroom decisions on capital allocation, as companies seek dispatchable power generation and grid stability services. The integration of advanced solar tracking systems, including dual-axis trackers on modular floating platforms, can increase energy yields by over 20%.
  • Attention is also turning to lifecycle management, including environmental impact assessment protocols and the development of materials with superior PID resistance and salt mist corrosion resistance to ensure long-term asset performance.

What are the Key Data Covered in this Floating Solar Panels Market Research and Growth Report?

  • What is the expected growth of the Floating Solar Panels Market between 2025 and 2029?

    • USD 1.04 billion, at a CAGR of 18.9%

  • What segmentation does the market report cover?

    • The report is segmented by Product (Stationery, and Tracking), Technology (Photovoltaic (PV), Concentrator photovoltaics (CPV), and Concentrated solar power (CSP)), Capacity (Below 5 MW, 5 to 50 MW, and Above 50 MW) and Geography (APAC, North America, Europe, Middle East and Africa, South America)

  • Which regions are analyzed in the report?

    • APAC, North America, Europe, Middle East and Africa and South America

  • What are the key growth drivers and market challenges?

    • Increasing demand for renewable energy and government support, Complex regulatory frameworks and nascent permitting processes

  • Who are the major players in the Floating Solar Panels Market?

    • Ciel and Terre International, GCL System Integration Technology Co. Ltd., Hanwha Group, JA Solar Technology Co. Ltd., JinkoSolar Holding Co. Ltd., KYOCERA Corp., LONGi Green Energy Technology Co. Ltd., Maxeon Solar Technologies Ltd., Ocean Sun AS, Pristine Sun Corp., Quant Solar, Sharp Corp., Sungrow FPV SCI and TECH Co. Ltd., Swimsol GmbH, Tata Power Co. Ltd., Topper Floating Solar PV Mounting Manufacturer Co. Ltd., Trina Solar Co. Ltd., Vari Pontoons Pvt. Ltd. and Vikram Solar Ltd.

Market Research Insights

  • The dynamics of the floating solar panels market are shaped by a strategic push for renewable energy portfolio diversification. The adoption of floatovoltaics technology is accelerating as developers pursue dual-use water surface applications, moving beyond traditional land-based projects.
  • FPV system efficiency is a key advantage, with the water surface cooling effect improving energy yields by up to 15% compared to terrestrial counterparts. Furthermore, advanced solar tracking systems can boost output by an additional 20%, a critical factor in the economic modeling for FPV project financing.
  • While initial capital expenditure can be 20-25% higher than for ground-mounted systems, the benefits of water conservation and the viability of co-located energy projects often justify the investment. Effective floating solar asset management and adherence to FPV installation best practices are crucial for optimizing long-term returns and ensuring system reliability.

We can help! Our analysts can customize this floating solar panels market research report to meet your requirements.

Get in touch

1. Executive Summary

1.1 Market overview

Executive Summary - Chart on Market Overview
Executive Summary - Data Table on Market Overview
Executive Summary - Chart on Global Market Characteristics
Executive Summary - Chart on Market by Geography
Executive Summary - Chart on Market Segmentation by Product
Executive Summary - Chart on Market Segmentation by Technology
Executive Summary - Chart on Market Segmentation by Capacity
Executive Summary - Chart on Incremental Growth
Executive Summary - Data Table on Incremental Growth
Executive Summary - Chart on Company Market Positioning

2. Technavio Analysis

2.1 Analysis of price sensitivity, lifecycle, customer purchase basket, adoption rates, and purchase criteria

2.2 Criticality of inputs and Factors of differentiation

Chart on Overview on criticality of inputs and factors of differentiation

2.3 Factors of disruption

Chart on Overview on factors of disruption

2.4 Impact of drivers and challenges

Chart on Impact of drivers and challenges in 2024 and 2029

3. Market Landscape

3.1 Market ecosystem

Chart on Parent Market
Data Table on - Parent Market

3.2 Market characteristics

Chart on Market characteristics analysis

3.3 Value chain analysis

Chart on Value chain analysis

4. Market Sizing

4.1 Market definition

Data Table on Offerings of companies included in the market definition

4.2 Market segment analysis

Market segments

4.3 Market size 2024

4.4 Market outlook: Forecast for 2024-2029

Chart on Global - Market size and forecast 2024-2029 ($ million)
Data Table on Global - Market size and forecast 2024-2029 ($ million)
Chart on Global Market: Year-over-year growth 2024-2029 (%)
Data Table on Global Market: Year-over-year growth 2024-2029 (%)

5. Historic Market Size

5.1 Global Floating Solar Panels Market 2019 - 2023

Historic Market Size - Data Table on Global Floating Solar Panels Market 2019 - 2023 ($ million)

5.2 Product segment analysis 2019 - 2023

Historic Market Size - Product Segment 2019 - 2023 ($ million)

5.3 Technology segment analysis 2019 - 2023

Historic Market Size - Technology Segment 2019 - 2023 ($ million)

5.4 Capacity segment analysis 2019 - 2023

Historic Market Size - Capacity Segment 2019 - 2023 ($ million)

5.5 Geography segment analysis 2019 - 2023

Historic Market Size - Geography Segment 2019 - 2023 ($ million)

5.6 Country segment analysis 2019 - 2023

Historic Market Size - Country Segment 2019 - 2023 ($ million)

6. Qualitative Analysis

6.1 The AI impact on Global Floating Solar Panels Market

7. Five Forces Analysis

7.1 Five forces summary

Five forces analysis - Comparison between 2024 and 2029

7.2 Bargaining power of buyers

Bargaining power of buyers - Impact of key factors 2024 and 2029

7.3 Bargaining power of suppliers

Bargaining power of suppliers - Impact of key factors in 2024 and 2029

7.4 Threat of new entrants

Threat of new entrants - Impact of key factors in 2024 and 2029

7.5 Threat of substitutes

Threat of substitutes - Impact of key factors in 2024 and 2029

7.6 Threat of rivalry

Threat of rivalry - Impact of key factors in 2024 and 2029

7.7 Market condition

Chart on Market condition - Five forces 2024 and 2029

8. Market Segmentation by Product

8.1 Market segments

Chart on Product - Market share 2024-2029 (%)
Data Table on Product - Market share 2024-2029 (%)

8.2 Comparison by Product

Chart on Comparison by Product
Data Table on Comparison by Product

8.3 Stationery - Market size and forecast 2024-2029

Chart on Stationery - Market size and forecast 2024-2029 ($ million)
Data Table on Stationery - Market size and forecast 2024-2029 ($ million)
Chart on Stationery - Year-over-year growth 2024-2029 (%)
Data Table on Stationery - Year-over-year growth 2024-2029 (%)

8.4 Tracking - Market size and forecast 2024-2029

Chart on Tracking - Market size and forecast 2024-2029 ($ million)
Data Table on Tracking - Market size and forecast 2024-2029 ($ million)
Chart on Tracking - Year-over-year growth 2024-2029 (%)
Data Table on Tracking - Year-over-year growth 2024-2029 (%)

8.5 Market opportunity by Product

Market opportunity by Product ($ million)
Data Table on Market opportunity by Product ($ million)

9. Market Segmentation by Technology

9.1 Market segments

Chart on Technology - Market share 2024-2029 (%)
Data Table on Technology - Market share 2024-2029 (%)

9.2 Comparison by Technology

Chart on Comparison by Technology
Data Table on Comparison by Technology

9.3 PV - Market size and forecast 2024-2029

Chart on PV - Market size and forecast 2024-2029 ($ million)
Data Table on PV - Market size and forecast 2024-2029 ($ million)
Chart on PV - Year-over-year growth 2024-2029 (%)
Data Table on PV - Year-over-year growth 2024-2029 (%)

9.4 CPV - Market size and forecast 2024-2029

Chart on CPV - Market size and forecast 2024-2029 ($ million)
Data Table on CPV - Market size and forecast 2024-2029 ($ million)
Chart on CPV - Year-over-year growth 2024-2029 (%)
Data Table on CPV - Year-over-year growth 2024-2029 (%)

9.5 CSP - Market size and forecast 2024-2029

Chart on CSP - Market size and forecast 2024-2029 ($ million)
Data Table on CSP - Market size and forecast 2024-2029 ($ million)
Chart on CSP - Year-over-year growth 2024-2029 (%)
Data Table on CSP - Year-over-year growth 2024-2029 (%)

9.6 Market opportunity by Technology

Market opportunity by Technology ($ million)
Data Table on Market opportunity by Technology ($ million)

10. Market Segmentation by Capacity

10.1 Market segments

Chart on Capacity - Market share 2024-2029 (%)
Data Table on Capacity - Market share 2024-2029 (%)

10.2 Comparison by Capacity

Chart on Comparison by Capacity
Data Table on Comparison by Capacity

10.3 Below 5 MW - Market size and forecast 2024-2029

Chart on Below 5 MW - Market size and forecast 2024-2029 ($ million)
Data Table on Below 5 MW - Market size and forecast 2024-2029 ($ million)
Chart on Below 5 MW - Year-over-year growth 2024-2029 (%)
Data Table on Below 5 MW - Year-over-year growth 2024-2029 (%)

10.4 5 to 50 MW - Market size and forecast 2024-2029

Chart on 5 to 50 MW - Market size and forecast 2024-2029 ($ million)
Data Table on 5 to 50 MW - Market size and forecast 2024-2029 ($ million)
Chart on 5 to 50 MW - Year-over-year growth 2024-2029 (%)
Data Table on 5 to 50 MW - Year-over-year growth 2024-2029 (%)

10.5 Above 50 MW - Market size and forecast 2024-2029

Chart on Above 50 MW - Market size and forecast 2024-2029 ($ million)
Data Table on Above 50 MW - Market size and forecast 2024-2029 ($ million)
Chart on Above 50 MW - Year-over-year growth 2024-2029 (%)
Data Table on Above 50 MW - Year-over-year growth 2024-2029 (%)

10.6 Market opportunity by Capacity

Market opportunity by Capacity ($ million)
Data Table on Market opportunity by Capacity ($ million)

11. Customer Landscape

11.1 Customer landscape overview

Analysis of price sensitivity, lifecycle, customer purchase basket, adoption rates, and purchase criteria

12. Geographic Landscape

12.1 Geographic segmentation

Chart on Market share by geography 2024-2029 (%)
Data Table on Market share by geography 2024-2029 (%)

12.2 Geographic comparison

Chart on Geographic comparison
Data Table on Geographic comparison

12.3 APAC - Market size and forecast 2024-2029

Chart on APAC - Market size and forecast 2024-2029 ($ million)
Data Table on APAC - Market size and forecast 2024-2029 ($ million)
Chart on APAC - Year-over-year growth 2024-2029 (%)
Data Table on APAC - Year-over-year growth 2024-2029 (%)
Chart on Regional Comparison - APAC
Data Table on Regional Comparison - APAC

12.3.1 China - Market size and forecast 2024-2029

Chart on China - Market size and forecast 2024-2029 ($ million)
Data Table on China - Market size and forecast 2024-2029 ($ million)
Chart on China - Year-over-year growth 2024-2029 (%)
Data Table on China - Year-over-year growth 2024-2029 (%)

12.3.2 India - Market size and forecast 2024-2029

Chart on India - Market size and forecast 2024-2029 ($ million)
Data Table on India - Market size and forecast 2024-2029 ($ million)
Chart on India - Year-over-year growth 2024-2029 (%)
Data Table on India - Year-over-year growth 2024-2029 (%)

12.3.3 Japan - Market size and forecast 2024-2029

Chart on Japan - Market size and forecast 2024-2029 ($ million)
Data Table on Japan - Market size and forecast 2024-2029 ($ million)
Chart on Japan - Year-over-year growth 2024-2029 (%)
Data Table on Japan - Year-over-year growth 2024-2029 (%)

12.3.4 South Korea - Market size and forecast 2024-2029

Chart on South Korea - Market size and forecast 2024-2029 ($ million)
Data Table on South Korea - Market size and forecast 2024-2029 ($ million)
Chart on South Korea - Year-over-year growth 2024-2029 (%)
Data Table on South Korea - Year-over-year growth 2024-2029 (%)

12.3.5 Australia - Market size and forecast 2024-2029

Chart on Australia - Market size and forecast 2024-2029 ($ million)
Data Table on Australia - Market size and forecast 2024-2029 ($ million)
Chart on Australia - Year-over-year growth 2024-2029 (%)
Data Table on Australia - Year-over-year growth 2024-2029 (%)

12.3.6 Indonesia - Market size and forecast 2024-2029

Chart on Indonesia - Market size and forecast 2024-2029 ($ million)
Data Table on Indonesia - Market size and forecast 2024-2029 ($ million)
Chart on Indonesia - Year-over-year growth 2024-2029 (%)
Data Table on Indonesia - Year-over-year growth 2024-2029 (%)

12.4 North America - Market size and forecast 2024-2029

Chart on North America - Market size and forecast 2024-2029 ($ million)
Data Table on North America - Market size and forecast 2024-2029 ($ million)
Chart on North America - Year-over-year growth 2024-2029 (%)
Data Table on North America - Year-over-year growth 2024-2029 (%)
Chart on Regional Comparison - North America
Data Table on Regional Comparison - North America

12.4.1 US - Market size and forecast 2024-2029

Chart on US - Market size and forecast 2024-2029 ($ million)
Data Table on US - Market size and forecast 2024-2029 ($ million)
Chart on US - Year-over-year growth 2024-2029 (%)
Data Table on US - Year-over-year growth 2024-2029 (%)

12.4.2 Canada - Market size and forecast 2024-2029

Chart on Canada - Market size and forecast 2024-2029 ($ million)
Data Table on Canada - Market size and forecast 2024-2029 ($ million)
Chart on Canada - Year-over-year growth 2024-2029 (%)
Data Table on Canada - Year-over-year growth 2024-2029 (%)

12.4.3 Mexico - Market size and forecast 2024-2029

Chart on Mexico - Market size and forecast 2024-2029 ($ million)
Data Table on Mexico - Market size and forecast 2024-2029 ($ million)
Chart on Mexico - Year-over-year growth 2024-2029 (%)
Data Table on Mexico - Year-over-year growth 2024-2029 (%)

12.5 Europe - Market size and forecast 2024-2029

Chart on Europe - Market size and forecast 2024-2029 ($ million)
Data Table on Europe - Market size and forecast 2024-2029 ($ million)
Chart on Europe - Year-over-year growth 2024-2029 (%)
Data Table on Europe - Year-over-year growth 2024-2029 (%)
Chart on Regional Comparison - Europe
Data Table on Regional Comparison - Europe

12.5.1 Germany - Market size and forecast 2024-2029

Chart on Germany - Market size and forecast 2024-2029 ($ million)
Data Table on Germany - Market size and forecast 2024-2029 ($ million)
Chart on Germany - Year-over-year growth 2024-2029 (%)
Data Table on Germany - Year-over-year growth 2024-2029 (%)

12.5.2 Spain - Market size and forecast 2024-2029

Chart on Spain - Market size and forecast 2024-2029 ($ million)
Data Table on Spain - Market size and forecast 2024-2029 ($ million)
Chart on Spain - Year-over-year growth 2024-2029 (%)
Data Table on Spain - Year-over-year growth 2024-2029 (%)

12.5.3 France - Market size and forecast 2024-2029

Chart on France - Market size and forecast 2024-2029 ($ million)
Data Table on France - Market size and forecast 2024-2029 ($ million)
Chart on France - Year-over-year growth 2024-2029 (%)
Data Table on France - Year-over-year growth 2024-2029 (%)

12.5.4 Italy - Market size and forecast 2024-2029

Chart on Italy - Market size and forecast 2024-2029 ($ million)
Data Table on Italy - Market size and forecast 2024-2029 ($ million)
Chart on Italy - Year-over-year growth 2024-2029 (%)
Data Table on Italy - Year-over-year growth 2024-2029 (%)

12.5.5 The Netherlands - Market size and forecast 2024-2029

Chart on The Netherlands - Market size and forecast 2024-2029 ($ million)
Data Table on The Netherlands - Market size and forecast 2024-2029 ($ million)
Chart on The Netherlands - Year-over-year growth 2024-2029 (%)
Data Table on The Netherlands - Year-over-year growth 2024-2029 (%)

12.5.6 UK - Market size and forecast 2024-2029

Chart on UK - Market size and forecast 2024-2029 ($ million)
Data Table on UK - Market size and forecast 2024-2029 ($ million)
Chart on UK - Year-over-year growth 2024-2029 (%)
Data Table on UK - Year-over-year growth 2024-2029 (%)

12.6 Middle East and Africa - Market size and forecast 2024-2029

Chart on Middle East and Africa - Market size and forecast 2024-2029 ($ million)
Data Table on Middle East and Africa - Market size and forecast 2024-2029 ($ million)
Chart on Middle East and Africa - Year-over-year growth 2024-2029 (%)
Data Table on Middle East and Africa - Year-over-year growth 2024-2029 (%)
Chart on Regional Comparison - Middle East and Africa
Data Table on Regional Comparison - Middle East and Africa

12.6.1 UAE - Market size and forecast 2024-2029

Chart on UAE - Market size and forecast 2024-2029 ($ million)
Data Table on UAE - Market size and forecast 2024-2029 ($ million)
Chart on UAE - Year-over-year growth 2024-2029 (%)
Data Table on UAE - Year-over-year growth 2024-2029 (%)

12.6.2 Saudi Arabia - Market size and forecast 2024-2029

Chart on Saudi Arabia - Market size and forecast 2024-2029 ($ million)
Data Table on Saudi Arabia - Market size and forecast 2024-2029 ($ million)
Chart on Saudi Arabia - Year-over-year growth 2024-2029 (%)
Data Table on Saudi Arabia - Year-over-year growth 2024-2029 (%)

12.6.3 Egypt - Market size and forecast 2024-2029

Chart on Egypt - Market size and forecast 2024-2029 ($ million)
Data Table on Egypt - Market size and forecast 2024-2029 ($ million)
Chart on Egypt - Year-over-year growth 2024-2029 (%)
Data Table on Egypt - Year-over-year growth 2024-2029 (%)

12.6.4 South Africa - Market size and forecast 2024-2029

Chart on South Africa - Market size and forecast 2024-2029 ($ million)
Data Table on South Africa - Market size and forecast 2024-2029 ($ million)
Chart on South Africa - Year-over-year growth 2024-2029 (%)
Data Table on South Africa - Year-over-year growth 2024-2029 (%)

12.6.5 Morocco - Market size and forecast 2024-2029

Chart on Morocco - Market size and forecast 2024-2029 ($ million)
Data Table on Morocco - Market size and forecast 2024-2029 ($ million)
Chart on Morocco - Year-over-year growth 2024-2029 (%)
Data Table on Morocco - Year-over-year growth 2024-2029 (%)

12.7 South America - Market size and forecast 2024-2029

Chart on South America - Market size and forecast 2024-2029 ($ million)
Data Table on South America - Market size and forecast 2024-2029 ($ million)
Chart on South America - Year-over-year growth 2024-2029 (%)
Data Table on South America - Year-over-year growth 2024-2029 (%)
Chart on Regional Comparison - South America
Data Table on Regional Comparison - South America

12.7.1 Brazil - Market size and forecast 2024-2029

Chart on Brazil - Market size and forecast 2024-2029 ($ million)
Data Table on Brazil - Market size and forecast 2024-2029 ($ million)
Chart on Brazil - Year-over-year growth 2024-2029 (%)
Data Table on Brazil - Year-over-year growth 2024-2029 (%)

12.7.2 Chile - Market size and forecast 2024-2029

Chart on Chile - Market size and forecast 2024-2029 ($ million)
Data Table on Chile - Market size and forecast 2024-2029 ($ million)
Chart on Chile - Year-over-year growth 2024-2029 (%)
Data Table on Chile - Year-over-year growth 2024-2029 (%)

12.7.3 Argentina - Market size and forecast 2024-2029

Chart on Argentina - Market size and forecast 2024-2029 ($ million)
Data Table on Argentina - Market size and forecast 2024-2029 ($ million)
Chart on Argentina - Year-over-year growth 2024-2029 (%)
Data Table on Argentina - Year-over-year growth 2024-2029 (%)

12.8 Market opportunity by geography

Market opportunity by geography ($ million)
Data Tables on Market opportunity by geography ($ million)

13. Drivers, Challenges, and Opportunity

13.1 Market drivers

Increasing demand for renewable energy and government support
Land scarcity and efficient land use
Technological advancements and improved efficiency

13.2 Market challenges

Complex regulatory frameworks and nascent permitting processes
Environmental and ecological uncertainties
Technical complexities and high initial costs

13.3 Impact of drivers and challenges

Impact of drivers and challenges in 2024 and 2029

13.4 Market opportunities

Proliferation of large scale and offshore projects
Accelerated innovation in system components and technology
Hybridization with other renewables and multifunctional water use

14. Competitive Landscape

14.1 Overview

14.2

Overview on criticality of inputs and factors of differentiation

14.3 Landscape disruption

Overview on factors of disruption

14.4 Industry risks

Impact of key risks on business

15. Competitive Analysis

15.1 Companies profiled

Companies covered

15.2 Company ranking index

15.3 Market positioning of companies

Matrix on companies position and classification

15.4 Ciel and Terre International

Ciel and Terre International - Overview
Ciel and Terre International - Product / Service
Ciel and Terre International - Key offerings
SWOT

15.5 GCL System Integration Technology Co. Ltd.

GCL System Integration Technology Co. Ltd. - Overview
GCL System Integration Technology Co. Ltd. - Business segments
GCL System Integration Technology Co. Ltd. - Key offerings
GCL System Integration Technology Co. Ltd. - Segment focus
SWOT

15.6 Hanwha Group

Hanwha Group - Overview
Hanwha Group - Product / Service
Hanwha Group - Key news
Hanwha Group - Key offerings
SWOT

15.7 JA Solar Technology Co. Ltd.

JA Solar Technology Co. Ltd. - Overview
JA Solar Technology Co. Ltd. - Product / Service
JA Solar Technology Co. Ltd. - Key news
JA Solar Technology Co. Ltd. - Key offerings
SWOT

15.8 JinkoSolar Holding Co. Ltd.

JinkoSolar Holding Co. Ltd. - Overview
JinkoSolar Holding Co. Ltd. - Product / Service
JinkoSolar Holding Co. Ltd. - Key news
JinkoSolar Holding Co. Ltd. - Key offerings
SWOT

15.9 KYOCERA Corp.

KYOCERA Corp. - Overview
KYOCERA Corp. - Business segments
KYOCERA Corp. - Key news
KYOCERA Corp. - Key offerings
KYOCERA Corp. - Segment focus
SWOT

15.10 LONGi Green Energy Technology Co. Ltd.

LONGi Green Energy Technology Co. Ltd. - Overview
LONGi Green Energy Technology Co. Ltd. - Product / Service
LONGi Green Energy Technology Co. Ltd. - Key news
LONGi Green Energy Technology Co. Ltd. - Key offerings
SWOT

15.11 Maxeon Solar Technologies Ltd.

Maxeon Solar Technologies Ltd. - Overview
Maxeon Solar Technologies Ltd. - Product / Service
Maxeon Solar Technologies Ltd. - Key offerings
SWOT

15.12 Ocean Sun AS

Ocean Sun AS - Overview
Ocean Sun AS - Product / Service
Ocean Sun AS - Key offerings
SWOT

15.13 Sharp Corp.

Sharp Corp. - Overview
Sharp Corp. - Business segments
Sharp Corp. - Key news
Sharp Corp. - Key offerings
Sharp Corp. - Segment focus
SWOT

15.14 Sungrow FPV SCI and TECH Co. Ltd.

Sungrow FPV SCI and TECH Co. Ltd. - Overview
Sungrow FPV SCI and TECH Co. Ltd. - Product / Service
Sungrow FPV SCI and TECH Co. Ltd. - Key offerings
SWOT

15.15 Swimsol GmbH

Swimsol GmbH - Overview
Swimsol GmbH - Product / Service
Swimsol GmbH - Key offerings
SWOT

15.16 Tata Power Co. Ltd.

Tata Power Co. Ltd. - Overview
Tata Power Co. Ltd. - Business segments
Tata Power Co. Ltd. - Key offerings
Tata Power Co. Ltd. - Segment focus
SWOT

15.17 Trina Solar Co. Ltd.

Trina Solar Co. Ltd. - Overview
Trina Solar Co. Ltd. - Product / Service
Trina Solar Co. Ltd. - Key news
Trina Solar Co. Ltd. - Key offerings
SWOT

15.18 Vikram Solar Ltd.

Vikram Solar Ltd. - Overview
Vikram Solar Ltd. - Product / Service
Vikram Solar Ltd. - Key offerings
SWOT

16. Appendix

16.1 Scope of the report

Market definition
Objectives
Notes and caveats

16.2 Inclusions and exclusions checklist

Inclusions checklist
Exclusions checklist

16.3 Currency conversion rates for US$

16.4 Research methodology

16.5 Data procurement

Information sources

16.6 Data validation

16.7 Validation techniques employed for market sizing

16.8 Data synthesis

16.9 360 degree market analysis

16.10 List of abbreviations

Research Methodology

Technavio presents a detailed picture of the market by way of study, synthesis, and summation of data from multiple sources. The analysts have presented the various facets of the market with a particular focus on identifying the key industry influencers. The data thus presented is comprehensive, reliable, and the result of extensive research, both primary and secondary.

INFORMATION SOURCES

Primary sources

  • Manufacturers and suppliers
  • Channel partners
  • Industry experts
  • Strategic decision makers

Secondary sources

  • Industry journals and periodicals
  • Government data
  • Financial reports of key industry players
  • Historical data
  • Press releases

DATA ANALYSIS

Data Synthesis

  • Collation of data
  • Estimation of key figures
  • Analysis of derived insights

Data Validation

  • Triangulation with data models
  • Reference against proprietary databases
  • Corroboration with industry experts

REPORT WRITING

Qualitative

  • Market drivers
  • Market challenges
  • Market trends
  • Five forces analysis

Quantitative

  • Market size and forecast
  • Market segmentation
  • Geographical insights
  • Competitive landscape

Interested in this report?

Get your sample now to see our research methodology and insights!

Download Now

Frequently Asked Questions

Floating Solar Panels market growth will increase by USD 1041.7 million during 2025-2029.

The Floating Solar Panels market is expected to grow at a CAGR of 18.9% during 2025-2029.

Floating Solar Panels market is segmented by Product (Stationery, Tracking) Technology (PV, CPV, CSP) Capacity (Below 5 MW, 5 to 50 MW, Above 50 MW)

Ciel and Terre International, GCL System Integration Technology Co. Ltd., Hanwha Group, JA Solar Technology Co. Ltd., JinkoSolar Holding Co. Ltd., KYOCERA Corp., LONGi Green Energy Technology Co. Ltd., Maxeon Solar Technologies Ltd., Ocean Sun AS, Pristine Sun Corp., Quant Solar, Sharp Corp., Sungrow FPV SCI and TECH Co. Ltd., Swimsol GmbH, Tata Power Co. Ltd., Topper Floating Solar PV Mounting Manufacturer Co. Ltd., Trina Solar Co. Ltd., Vari Pontoons Pvt. Ltd., Vikram Solar Ltd. are a few of the key vendors in the Floating Solar Panels market.

APAC will register the highest growth rate of 69.4% among the other regions. Therefore, the Floating Solar Panels market in APAC is expected to garner significant business opportunities for the vendors during the forecast period.

China, India, Japan, South Korea, Australia, Indonesia, US, Canada, Mexico, Germany, Spain, France, Italy, The Netherlands, UK, UAE, Saudi Arabia, Egypt, South Africa, Morocco, Brazil, Chile, Argentina

  • Increasing demand for renewable energy and government support is the driving factor this market.

The Floating Solar Panels market vendors should focus on grabbing business opportunities from the Product segment as it accounted for the largest market share in the base year.