Flexographic Printing Machine Market Analysis Europe, North America, APAC, South America, Middle East and Africa - US, China, Japan, Germany, France - Size and Forecast 2024-2028

Flexographic Printing Machine Market Analysis Europe, North America, APAC, South America, Middle East and Africa - US, China, Japan, Germany, France - Size and Forecast 2024-2028

Published: Mar 2024 168 Pages SKU: IRTNTR46470

Market Overview at a Glance

$591.49 Mn
Market Opportunity
6.33%
CAGR
6.15
YoY growth 2023-2024(%)

Flexographic Printing Machine Market Size 2024-2028 

The flexographic printing machine market size is forecast to increase by USD 591.49 million at a CAGR of 6.33% between 2023 and 2028.

  • The market is experiencing significant growth, driven by high demand volumes from the packaging industry. This sector's expansion is fueled by the increasing preference for flexo-digital hybrid label printing solutions. This technology plays a significant role in the e-commerce and online shopping sectors, where efficient and cost-effective packaging solutions are essential.
  • Cutting-edge technologies combine the advantages of flexographic and digital printing, delivering high-quality images with faster turnaround times. However, the market faces challenges, particularly the volatility of raw material prices for flexographic printing machines. Despite this obstacle, the market holds strong growth potential, driven by the packaging industry's sustained demand for flexographic printing and continuous advancements in hybrid printing solutions.

What will be the Flexographic Printing Machine Market Size During the Forecast Period?

Flexographic Printing Machine Market Size

 Request Free Sample

  • The market encompasses the production and sale of machinery used for creating self-adhesive labels, flexible packaging, and various other packaging materials such as bags, cartons, and labels. This technology employs print media like plastic bags, foil wrappings, and medical supplies, utilizing substrates in the food packaging sector. The machinery incorporates relief plates made of rubber or photo-polymer, operated by four rollers including an ink roller, meter roller, plate cylinder, and impression cylinder.
  • In addition, an Anilox roller distributes ink evenly across the plate surface. The Flexographic printing process produces raised-relief image plates, resulting in high-quality prints. Skilled operators ensure the optimal functioning of these machines, ensuring the production of high-quality packaging materials.

How is this market segmented and which is the largest segment?

The market research report provides comprehensive data (region-wise segment analysis), with forecasts and estimates in "USD million" for the period 2024-2028, as well as historical data from 2018-2022 for the following segments.

  • Application
    • Flexible packaging
    • Print media
    • Others
  • Product
    • Wide web
    • Medium web
    • Narrow web
  • Geography
    • Europe
      • Germany
      • France
    • North America
      • US
    • APAC
      • China
      • Japan
    • South America
    • Middle East and Africa

By Application Insights

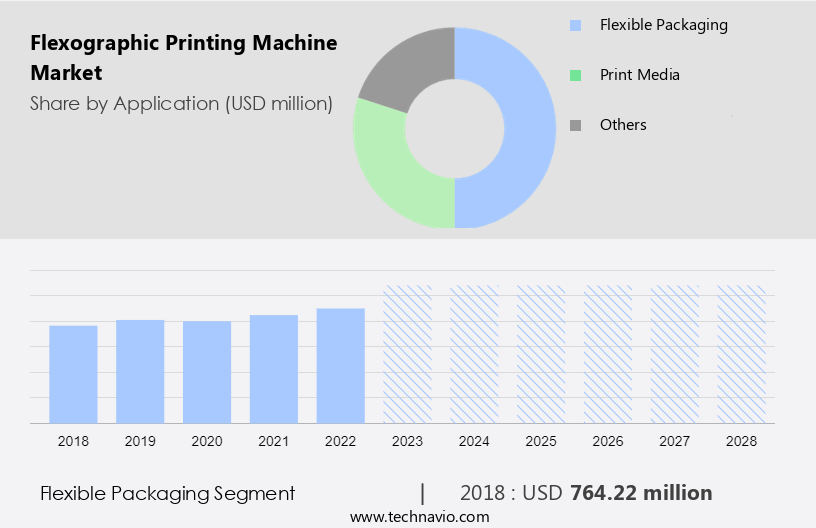
  • The flexible packaging segment is estimated to witness significant growth during the forecast period.

The market experiences significant growth in the packaging industry, primarily due to the increasing demand for flexible packaging in various sectors. Beverages and personal care items are major consumers of this type of packaging, as it offers superior barrier properties against moisture, oxygen, and light. Flexible packaging's ability to protect content from external factors is a key factor driving its popularity. Manufacturers and retailers benefit from its lightweight nature, which reduces transportation costs. Packaging printing companies leverage advanced flexographic printing technologies to produce high-quality, customized designs on these flexible packages, further enhancing their appeal.

Flexographic Printing Machine Market Size

Get a glance at the market report of share of various segments Request Free Sample

The flexible packaging segment was valued at USD 764.22 million in 2018 and showed a gradual increase during the forecast period.

Regional Analysis

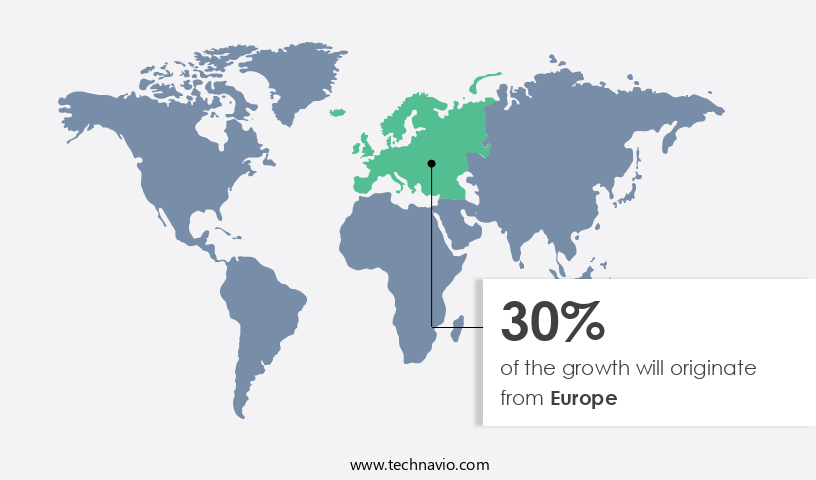
  • Europe is estimated to contribute 30% to the growth of the global market during the forecast period.

Technavio's analysts have elaborately explained the regional trends and drivers that shape the market during the forecast period.

Flexographic Printing Machine Market Share by Geography

For more insights on the market share of various regions Request Free Sample

The market in Europe, particularly Western Europe, has attained maturity due to the widespread use of smartphones and digital devices for e-reading. This region's shift from print to eBooks is evident in the increasing adoption of electronic devices for reading in countries like Germany and France. In the educational sector, the European Union (EU) has made significant strides in digitalizing education through initiatives like the Digital Agenda, which is one of the seven pillars of the Europe 2020 Strategy. Regarding the flexographic printing industry, this technology employs various components such as ink rollers, meter rollers, plate cylinders, and impression cylinders.

Market Dynamics

Our researchers analyzed the data with 2023 as the base year, along with the key drivers, trends, and challenges. A holistic analysis of drivers will help companies refine their marketing strategies to gain a competitive advantage.

What are the key market drivers leading to the rise in adoption of Flexographic Printing Machine Market?

High demand volumes from packaging industry is the key driver of the market.

  • In the realm of packaging, the demand for flexible packaging solutions has escalated, driven by the burgeoning consumer goods industry and technological innovations like AptarGroup's VersaPouch closure. This closure boasts a flip-cap, a built-in pull ring, and an anti-spill SimpliSqueeze valve. The expansion of the global packaging industry has catalyzed the growth of the market. The food and beverage sector, as the largest end-user, plays a pivotal role in market expansion due to the escalating demand for packaged foods, beverages, and frozen items. Flexographic printing machines are indispensable in flexible packaging plants, enabling the production of print labels on various packaging materials.
  • In addition, quick-drying inks ensure efficient printing processes, while skilled operators manage the printing of individualized text, QR codes, and serialized labels. Flexible packaging materials, such as recyclable high-barrier laminates, are essential for various industries, including wine, corrugated cardboard, and the logistics industry. The printing process for these materials is carried out using flexographic printers, which offer shorter print runs and on-demand printing capabilities.

What are the market trends shaping the Flexographic Printing Machine Market?

Increasing demand for flexo-digital hybrid label printing solutions is the upcoming trend in the market.

  • In the realm of packaging solutions, flexographic printing holds a significant position, particularly in the production of labels and flexible packaging. This printing process is renowned for its compatibility with various materials, including recyclable high-barrier laminates, and its ability to print on a wide range of substrates such as corrugated cardboard and laminators. Flexographic printing is a preferred choice for industries like logistics, pharmaceuticals, and wine, where quick-drying inks and the ability to print individualized text, QR codes, and serialized labels are essential. In the age of online shopping, this printing method ensures shipping-friendly designs and enhances unboxing experiences.
  • In addition, flexographic printers offer shorter print runs and on-demand printing, making them an attractive option for price-sensitive brands dealing with various SKUs, seasonal promotions, or limited edition products. Flexographic printing also caters to industrial-scale applications, such as those in the production of grains, cement, and industrial goods. The use of flexographic printing technology in labeling and packaging design allows for the integration of branding elements, ensuring a cohesive and professional appearance for printed products.

What challenges does Flexographic Printing Machine Market face during the growth?

Fluctuation in raw material prices for flexographic printing machines is a key challenge affecting the market growth.

  • In the realm of flexible packaging and labeling, the demand for quick-drying inks in the flexographic printing process continues to surge. This printing method is extensively utilized in various industries, including the logistics sector for print labels on corrugated cardboard, the wine industry for printed bottles, and the labeling of recyclable high-barrier laminates in the packaging material market. Skilled operators manage the printing process, ensuring variable data printing for individualized text, QR codes, and serialized labels. Flexographic printing machines are indispensable in creating packaging designs for a multitude of materials, from paper and plastics to industrial-scale applications such as large-scale packaging materials for grains, cement, and other industrial goods.
  • In addition, the printing process allows for shorter print runs and on-demand printing, catering to price-sensitive brands. Bobst, a leading manufacturer of equipment for packaging materials, plays a significant role in the production of these printing machines. The technology enables the creation of shipping-friendly designs, enhancing unboxing experiences and contributing to the overall branding elements of the packaged products.

Exclusive Customer Landscape

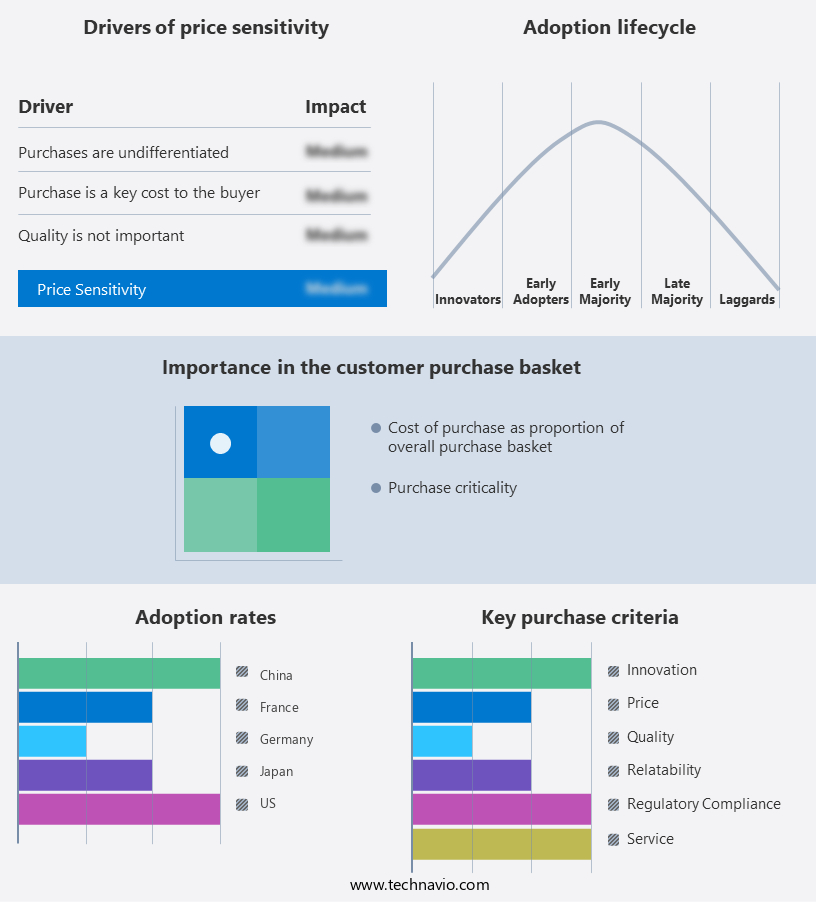
The market forecasting report includes the adoption lifecycle of the market, covering from the innovator's stage to the laggard's stage. It focuses on adoption rates in different regions based on penetration. Furthermore, the market report also includes key purchase criteria and drivers of price sensitivity to help companies evaluate and develop their market growth analysis strategies.

Flexographic Printing Machine Market Share by Geography

 Customer Landscape

Key Companies & Market Insights

Companies are implementing various strategies, such as strategic alliances, market forecast, partnerships, mergers and acquisitions, geographical expansion, and product/service launches, to enhance their presence in the market.

The market research and growth report includes detailed analyses of the competitive landscape of the market and information about key companies, including:

  • Barry Wehmiller Group Inc.
  • BFM Srl
  • Bobst Group SA
  • Comexi Group Industries SAU
  • Edale Ltd.
  • Heidelberger Druckmaschinen AG
  • Koenig and Bauer AG
  • LohiaGroup
  • Mark Andy Inc.
  • MPS Systems BV
  • Nilpeter
  • OMET Srl
  • OMSO SpA
  • ORIENT SOGYO Co. Ltd.
  • Rotatek
  • Star Flex International
  • Taiyang Machinery Co. Ltd.
  • Uteco Converting SpA
  • Windmoller and Holscher KG
  • Wolverine Flexographic LLC

Qualitative and quantitative analysis of companies has been conducted to help clients understand the wider business environment as well as the strengths and weaknesses of key market players. Data is qualitatively analyzed to categorize companies as pure play, category-focused, industry-focused, and diversified; it is quantitatively analyzed to categorize companies as dominant, leading, strong, tentative, and weak.

Research Analyst Overview

Flexographic printing machines have gained significant traction in the printing industry due to their versatility and ability to print on various substrates. The market for these machines is driven by the increasing demand for flexible packaging and labels. The printing technology offers several advantages such as high print quality, fast production speeds, and cost-effectiveness. Flexible packaging and labels are widely used in various end-use industries including food and beverage, pharmaceuticals, and cosmetics. The growing consumer preference for convenient and portable packaging solutions is fueling the demand for these printing machines. Moreover, the ongoing trend towards sustainable packaging is also expected to boost the market growth.

Furthermore, the market for flexographic printing machines is segmented based on machine type, application, and end-use industry. The market is highly competitive with key players focusing on product innovation and expansion of their product portfolio to cater to the evolving market demands. The future outlook for the market is promising with several trends such as the increasing adoption of digital technologies and the growing demand for eco-friendly printing solutions. These trends are expected to provide new opportunities for market players and drive the growth of the flexographic printing machines market.

Market Scope

Report Coverage

Details

Page number

168

Base year

2023

Historic period

2018-2022

Forecast period

2024-2028

Growth momentum & CAGR

Accelerate at a CAGR of 6.33%

Market growth 2024-2028

USD 591.49 million

Market structure

Fragmented

YoY growth 2023-2024(%)

6.15

Key countries

US, China, Japan, Germany, and France

Competitive landscape

Leading Companies, Market Positioning of Companies, Competitive Strategies, and Industry Risks

Request Free Sample

What are the Key Data Covered in this Market Research and Growth Report?

  • CAGR of the market during the forecast period
  • Detailed information on factors that will drive the market growth and forecasting between 2024 and 2028
  • Precise estimation of the size of the market  and its contribution of the market in focus to the parent market
  • Accurate predictions about upcoming market growth and trends and changes in consumer behaviour
  • Growth of the market across Europe, North America, APAC, South America, and Middle East and Africa
  • Thorough analysis of the market's competitive landscape and detailed information about companies
  • Comprehensive analysis of factors that will challenge the growth of market companies

We can help! Our analysts can customize this market research report to meet your requirements. Get in touch

1 Executive Summary

  • 1.1 Market overview
    • Exhibit 01: Executive Summary – Chart on Market Overview
    • Exhibit 02: Executive Summary – Data Table on Market Overview
    • Exhibit 03: Executive Summary – Chart on Global Market Characteristics
    • Exhibit 04: Executive Summary – Chart on Market by Geography
    • Exhibit 05: Executive Summary – Chart on Market Segmentation by Application
    • Exhibit 06: Executive Summary – Chart on Market Segmentation by Product
    • Exhibit 07: Executive Summary – Chart on Incremental Growth
    • Exhibit 08: Executive Summary – Data Table on Incremental Growth
    • Exhibit 09: Executive Summary – Chart on Vendor Market Positioning

2 Market Landscape

  • 2.1 Market ecosystem
    • Exhibit 10: Parent market
    • Exhibit 11: Market Characteristics

3 Market Sizing

  • 3.1 Market definition
    • Exhibit 12: Offerings of vendors included in the market definition
  • 3.2 Market segment analysis
    • Exhibit 13: Market segments
  • 3.3 Market size 2023
    • 3.4 Market outlook: Forecast for 2023-2028
      • Exhibit 14: Chart on Global - Market size and forecast 2023-2028 ($ million)
      • Exhibit 15: Data Table on Global - Market size and forecast 2023-2028 ($ million)
      • Exhibit 16: Chart on Global Market: Year-over-year growth 2023-2028 (%)
      • Exhibit 17: Data Table on Global Market: Year-over-year growth 2023-2028 (%)

    4 Historic Market Size

    • 4.1 Global flexographic printing machine market 2018 - 2022
      • Exhibit 18: Historic Market Size – Data Table on global flexographic printing machine market 2018 - 2022 ($ million)
    • 4.2 Application Segment Analysis 2018 - 2022
      • Exhibit 19: Historic Market Size – Application Segment 2018 - 2022 ($ million)
    • 4.3 Product Segment Analysis 2018 - 2022
      • Exhibit 20: Historic Market Size – Product Segment 2018 - 2022 ($ million)
    • 4.4 Geography Segment Analysis 2018 - 2022
      • Exhibit 21: Historic Market Size – Geography Segment 2018 - 2022 ($ million)
    • 4.5 Country Segment Analysis 2018 - 2022
      • Exhibit 22: Historic Market Size – Country Segment 2018 - 2022 ($ million)

    5 Five Forces Analysis

    • 5.1 Five forces summary
      • Exhibit 23: Five forces analysis - Comparison between 2023 and 2028
    • 5.2 Bargaining power of buyers
      • Exhibit 24: Chart on Bargaining power of buyers – Impact of key factors 2023 and 2028
    • 5.3 Bargaining power of suppliers
      • Exhibit 25: Bargaining power of suppliers – Impact of key factors in 2023 and 2028
    • 5.4 Threat of new entrants
      • Exhibit 26: Threat of new entrants – Impact of key factors in 2023 and 2028
    • 5.5 Threat of substitutes
      • Exhibit 27: Threat of substitutes – Impact of key factors in 2023 and 2028
    • 5.6 Threat of rivalry
      • Exhibit 28: Threat of rivalry – Impact of key factors in 2023 and 2028
    • 5.7 Market condition
      • Exhibit 29: Chart on Market condition - Five forces 2023 and 2028

    6 Market Segmentation by Application

    • 6.1 Market segments
      • Exhibit 30: Chart on Application - Market share 2023-2028 (%)
      • Exhibit 31: Data Table on Application - Market share 2023-2028 (%)
    • 6.2 Comparison by Application
      • Exhibit 32: Chart on Comparison by Application
      • Exhibit 33: Data Table on Comparison by Application
    • 6.3 Flexible packaging - Market size and forecast 2023-2028
      • Exhibit 34: Chart on Flexible packaging - Market size and forecast 2023-2028 ($ million)
      • Exhibit 35: Data Table on Flexible packaging - Market size and forecast 2023-2028 ($ million)
      • Exhibit 36: Chart on Flexible packaging - Year-over-year growth 2023-2028 (%)
      • Exhibit 37: Data Table on Flexible packaging - Year-over-year growth 2023-2028 (%)
    • 6.4 Print media - Market size and forecast 2023-2028
      • Exhibit 38: Chart on Print media - Market size and forecast 2023-2028 ($ million)
      • Exhibit 39: Data Table on Print media - Market size and forecast 2023-2028 ($ million)
      • Exhibit 40: Chart on Print media - Year-over-year growth 2023-2028 (%)
      • Exhibit 41: Data Table on Print media - Year-over-year growth 2023-2028 (%)
    • 6.5 Others - Market size and forecast 2023-2028
      • Exhibit 42: Chart on Others - Market size and forecast 2023-2028 ($ million)
      • Exhibit 43: Data Table on Others - Market size and forecast 2023-2028 ($ million)
      • Exhibit 44: Chart on Others - Year-over-year growth 2023-2028 (%)
      • Exhibit 45: Data Table on Others - Year-over-year growth 2023-2028 (%)
    • 6.6 Market opportunity by Application
      • Exhibit 46: Market opportunity by Application ($ million)
      • Exhibit 47: Data Table on Market opportunity by Application ($ million)

    7 Market Segmentation by Product

    • 7.1 Market segments
      • Exhibit 48: Chart on Product - Market share 2023-2028 (%)
      • Exhibit 49: Data Table on Product - Market share 2023-2028 (%)
    • 7.2 Comparison by Product
      • Exhibit 50: Chart on Comparison by Product
      • Exhibit 51: Data Table on Comparison by Product
    • 7.3 Wide web - Market size and forecast 2023-2028
      • Exhibit 52: Chart on Wide web - Market size and forecast 2023-2028 ($ million)
      • Exhibit 53: Data Table on Wide web - Market size and forecast 2023-2028 ($ million)
      • Exhibit 54: Chart on Wide web - Year-over-year growth 2023-2028 (%)
      • Exhibit 55: Data Table on Wide web - Year-over-year growth 2023-2028 (%)
    • 7.4 Medium web - Market size and forecast 2023-2028
      • Exhibit 56: Chart on Medium web - Market size and forecast 2023-2028 ($ million)
      • Exhibit 57: Data Table on Medium web - Market size and forecast 2023-2028 ($ million)
      • Exhibit 58: Chart on Medium web - Year-over-year growth 2023-2028 (%)
      • Exhibit 59: Data Table on Medium web - Year-over-year growth 2023-2028 (%)
    • 7.5 Narrow web - Market size and forecast 2023-2028
      • Exhibit 60: Chart on Narrow web - Market size and forecast 2023-2028 ($ million)
      • Exhibit 61: Data Table on Narrow web - Market size and forecast 2023-2028 ($ million)
      • Exhibit 62: Chart on Narrow web - Year-over-year growth 2023-2028 (%)
      • Exhibit 63: Data Table on Narrow web - Year-over-year growth 2023-2028 (%)
    • 7.6 Market opportunity by Product
      • Exhibit 64: Market opportunity by Product ($ million)
      • Exhibit 65: Data Table on Market opportunity by Product ($ million)

    8 Customer Landscape

    • 8.1 Customer landscape overview
      • Exhibit 66: Analysis of price sensitivity, lifecycle, customer purchase basket, adoption rates, and purchase criteria

    9 Geographic Landscape

    • 9.1 Geographic segmentation
      • Exhibit 67: Chart on Market share by geography 2023-2028 (%)
      • Exhibit 68: Data Table on Market share by geography 2023-2028 (%)
    • 9.2 Geographic comparison
      • Exhibit 69: Chart on Geographic comparison
      • Exhibit 70: Data Table on Geographic comparison
    • 9.3 Europe - Market size and forecast 2023-2028
      • Exhibit 71: Chart on Europe - Market size and forecast 2023-2028 ($ million)
      • Exhibit 72: Data Table on Europe - Market size and forecast 2023-2028 ($ million)
      • Exhibit 73: Chart on Europe - Year-over-year growth 2023-2028 (%)
      • Exhibit 74: Data Table on Europe - Year-over-year growth 2023-2028 (%)
    • 9.4 North America - Market size and forecast 2023-2028
      • Exhibit 75: Chart on North America - Market size and forecast 2023-2028 ($ million)
      • Exhibit 76: Data Table on North America - Market size and forecast 2023-2028 ($ million)
      • Exhibit 77: Chart on North America - Year-over-year growth 2023-2028 (%)
      • Exhibit 78: Data Table on North America - Year-over-year growth 2023-2028 (%)
    • 9.5 APAC - Market size and forecast 2023-2028
      • Exhibit 79: Chart on APAC - Market size and forecast 2023-2028 ($ million)
      • Exhibit 80: Data Table on APAC - Market size and forecast 2023-2028 ($ million)
      • Exhibit 81: Chart on APAC - Year-over-year growth 2023-2028 (%)
      • Exhibit 82: Data Table on APAC - Year-over-year growth 2023-2028 (%)
    • 9.6 South America - Market size and forecast 2023-2028
      • Exhibit 83: Chart on South America - Market size and forecast 2023-2028 ($ million)
      • Exhibit 84: Data Table on South America - Market size and forecast 2023-2028 ($ million)
      • Exhibit 85: Chart on South America - Year-over-year growth 2023-2028 (%)
      • Exhibit 86: Data Table on South America - Year-over-year growth 2023-2028 (%)
    • 9.7 Middle East and Africa - Market size and forecast 2023-2028
      • Exhibit 87: Chart on Middle East and Africa - Market size and forecast 2023-2028 ($ million)
      • Exhibit 88: Data Table on Middle East and Africa - Market size and forecast 2023-2028 ($ million)
      • Exhibit 89: Chart on Middle East and Africa - Year-over-year growth 2023-2028 (%)
      • Exhibit 90: Data Table on Middle East and Africa - Year-over-year growth 2023-2028 (%)
    • 9.8 US - Market size and forecast 2023-2028
      • Exhibit 91: Chart on US - Market size and forecast 2023-2028 ($ million)
      • Exhibit 92: Data Table on US - Market size and forecast 2023-2028 ($ million)
      • Exhibit 93: Chart on US - Year-over-year growth 2023-2028 (%)
      • Exhibit 94: Data Table on US - Year-over-year growth 2023-2028 (%)
    • 9.9 China - Market size and forecast 2023-2028
      • Exhibit 95: Chart on China - Market size and forecast 2023-2028 ($ million)
      • Exhibit 96: Data Table on China - Market size and forecast 2023-2028 ($ million)
      • Exhibit 97: Chart on China - Year-over-year growth 2023-2028 (%)
      • Exhibit 98: Data Table on China - Year-over-year growth 2023-2028 (%)
    • 9.10 Germany - Market size and forecast 2023-2028
      • Exhibit 99: Chart on Germany - Market size and forecast 2023-2028 ($ million)
      • Exhibit 100: Data Table on Germany - Market size and forecast 2023-2028 ($ million)
      • Exhibit 101: Chart on Germany - Year-over-year growth 2023-2028 (%)
      • Exhibit 102: Data Table on Germany - Year-over-year growth 2023-2028 (%)
    • 9.11 France - Market size and forecast 2023-2028
      • Exhibit 103: Chart on France - Market size and forecast 2023-2028 ($ million)
      • Exhibit 104: Data Table on France - Market size and forecast 2023-2028 ($ million)
      • Exhibit 105: Chart on France - Year-over-year growth 2023-2028 (%)
      • Exhibit 106: Data Table on France - Year-over-year growth 2023-2028 (%)
    • 9.12 Japan - Market size and forecast 2023-2028
      • Exhibit 107: Chart on Japan - Market size and forecast 2023-2028 ($ million)
      • Exhibit 108: Data Table on Japan - Market size and forecast 2023-2028 ($ million)
      • Exhibit 109: Chart on Japan - Year-over-year growth 2023-2028 (%)
      • Exhibit 110: Data Table on Japan - Year-over-year growth 2023-2028 (%)
    • 9.13 Market opportunity by geography
      • Exhibit 111: Market opportunity by geography ($ million)
      • Exhibit 112: Data Tables on Market opportunity by geography ($ million)

    10 Drivers, Challenges, and Trends

    • 10.1 Market drivers
      • 10.2 Market challenges
        • 10.3 Impact of drivers and challenges
          • Exhibit 113: Impact of drivers and challenges in 2023 and 2028
        • 10.4 Market trends

          11 Vendor Landscape

          • 11.1 Overview
            • 11.2 Vendor landscape
              • Exhibit 114: Overview on Criticality of inputs and Factors of differentiation
            • 11.3 Landscape disruption
              • Exhibit 115: Overview on factors of disruption
            • 11.4 Industry risks
              • Exhibit 116: Impact of key risks on business

            12 Vendor Analysis

            • 12.1 Vendors covered
              • Exhibit 117: Vendors covered
            • 12.2 Market positioning of vendors
              • Exhibit 118: Matrix on vendor position and classification
            • 12.3 Barry Wehmiller Group Inc.
              • Exhibit 119: Barry Wehmiller Group Inc. - Overview
              • Exhibit 120: Barry Wehmiller Group Inc. - Product / Service
              • Exhibit 121: Barry Wehmiller Group Inc. - Key offerings
            • 12.4 BFM Srl
              • Exhibit 122: BFM Srl - Overview
              • Exhibit 123: BFM Srl - Product / Service
              • Exhibit 124: BFM Srl - Key offerings
            • 12.5 Bobst Group SA
              • Exhibit 125: Bobst Group SA - Overview
              • Exhibit 126: Bobst Group SA - Business segments
              • Exhibit 127: Bobst Group SA - Key offerings
              • Exhibit 128: Bobst Group SA - Segment focus
            • 12.6 Comexi Group Industries SAU
              • Exhibit 129: Comexi Group Industries SAU - Overview
              • Exhibit 130: Comexi Group Industries SAU - Product / Service
              • Exhibit 131: Comexi Group Industries SAU - Key offerings
            • 12.7 Edale Ltd.
              • Exhibit 132: Edale Ltd. - Overview
              • Exhibit 133: Edale Ltd. - Product / Service
              • Exhibit 134: Edale Ltd. - Key offerings
            • 12.8 Heidelberger Druckmaschinen AG
              • Exhibit 135: Heidelberger Druckmaschinen AG - Overview
              • Exhibit 136: Heidelberger Druckmaschinen AG - Business segments
              • Exhibit 137: Heidelberger Druckmaschinen AG - Key offerings
              • Exhibit 138: Heidelberger Druckmaschinen AG - Segment focus
            • 12.9 Koenig and Bauer AG
              • Exhibit 139: Koenig and Bauer AG - Overview
              • Exhibit 140: Koenig and Bauer AG - Business segments
              • Exhibit 141: Koenig and Bauer AG - Key offerings
              • Exhibit 142: Koenig and Bauer AG - Segment focus
            • 12.10 LohiaGroup
              • Exhibit 143: LohiaGroup - Overview
              • Exhibit 144: LohiaGroup - Product / Service
              • Exhibit 145: LohiaGroup - Key offerings
            • 12.11 Mark Andy Inc.
              • Exhibit 146: Mark Andy Inc. - Overview
              • Exhibit 147: Mark Andy Inc. - Product / Service
              • Exhibit 148: Mark Andy Inc. - Key offerings
            • 12.12 MPS Systems BV
              • Exhibit 149: MPS Systems BV - Overview
              • Exhibit 150: MPS Systems BV - Product / Service
              • Exhibit 151: MPS Systems BV - Key offerings
            • 12.13 Nilpeter
              • Exhibit 152: Nilpeter - Overview
              • Exhibit 153: Nilpeter - Product / Service
              • Exhibit 154: Nilpeter - Key offerings
            • 12.14 OMET Srl
              • Exhibit 155: OMET Srl - Overview
              • Exhibit 156: OMET Srl - Product / Service
              • Exhibit 157: OMET Srl - Key offerings
            • 12.15 OMSO SpA
              • Exhibit 158: OMSO SpA - Overview
              • Exhibit 159: OMSO SpA - Product / Service
              • Exhibit 160: OMSO SpA - Key offerings
            • 12.16 ORIENT SOGYO Co. Ltd.
              • Exhibit 161: ORIENT SOGYO Co. Ltd. - Overview
              • Exhibit 162: ORIENT SOGYO Co. Ltd. - Product / Service
              • Exhibit 163: ORIENT SOGYO Co. Ltd. - Key offerings
            • 12.17 Rotatek
              • Exhibit 164: Rotatek - Overview
              • Exhibit 165: Rotatek - Product / Service
              • Exhibit 166: Rotatek - Key offerings

            13 Appendix

            • 13.1 Scope of the report
              • 13.2 Inclusions and exclusions checklist
                • Exhibit 167: Inclusions checklist
                • Exhibit 168: Exclusions checklist
              • 13.3 Currency conversion rates for US$
                • Exhibit 169: Currency conversion rates for US$
              • 13.4 Research methodology
                • Exhibit 170: Research methodology
                • Exhibit 171: Validation techniques employed for market sizing
                • Exhibit 172: Information sources
              • 13.5 List of abbreviations
                • Exhibit 173: List of abbreviations

              Research Methodology

              Technavio presents a detailed picture of the market by way of study, synthesis, and summation of data from multiple sources. The analysts have presented the various facets of the market with a particular focus on identifying the key industry influencers. The data thus presented is comprehensive, reliable, and the result of extensive research, both primary and secondary.

              INFORMATION SOURCES

              Primary sources

              • Manufacturers and suppliers
              • Channel partners
              • Industry experts
              • Strategic decision makers

              Secondary sources

              • Industry journals and periodicals
              • Government data
              • Financial reports of key industry players
              • Historical data
              • Press releases

              DATA ANALYSIS

              Data Synthesis

              • Collation of data
              • Estimation of key figures
              • Analysis of derived insights

              Data Validation

              • Triangulation with data models
              • Reference against proprietary databases
              • Corroboration with industry experts

              REPORT WRITING

              Qualitative

              • Market drivers
              • Market challenges
              • Market trends
              • Five forces analysis

              Quantitative

              • Market size and forecast
              • Market segmentation
              • Geographical insights
              • Competitive landscape

              Interested in this report?

              Get your sample now to see our research methodology and insights!

              Download Now

              Frequently Asked Questions

              Flexographic Printing Machine market growth will increase by $ 591.49 mn during 2024-2028.

              The Flexographic Printing Machine market is expected to grow at a CAGR of 6.33% during 2024-2028.

              Flexographic Printing Machine market is segmented by Application( Flexible packaging, Print media, Others) Product( Wide web, Medium web, Narrow web, South America, Middle East and Africa)

              Barry Wehmiller Group Inc., BFM Srl, Bobst Group SA, Comexi Group Industries SAU, Edale Ltd., Heidelberger Druckmaschinen AG, Koenig and Bauer AG, LohiaGroup, Mark Andy Inc., MPS Systems BV, Nilpeter, OMET Srl, OMSO SpA, ORIENT SOGYO Co. Ltd., Rotatek, Star Flex International, Taiyang Machinery Co. Ltd., Uteco Converting SpA, Windmoller and Holscher KG, Wolverine Flexographic LLC are a few of the key vendors in the Flexographic Printing Machine market.

              Europe will register the highest growth rate of 30% among the other regions. Therefore, the Flexographic Printing Machine market in Europe is expected to garner significant business opportunities for the vendors during the forecast period.

              US, China, Japan, Germany, France

              • High demand volumes from packaging industryThe growth of the packaging industry contributes to the increase in demand for flexible packaging due to the thriving consumer goods industry and technological advances such as AptarGroups patented VersaPouch closure that features a flip-cap is the driving factor this market.
              • a built-in pull ring is the driving factor this market.
              • and an anti-spill SimpliSqueeze valve. The growth of the global packaging industry has had a significant impact on the development and expansion of the global flexographic printing machine market. The food and beverage industry is estimated to be the largest end-user of flexographic printing machines and a major growth contributor owing to the rising demand for packaged foods is the driving factor this market.
              • packed beverages is the driving factor this market.
              • and frozen foods. In addition is the driving factor this market.
              • growing awareness and concerns about the quality of packaged food and beverages have fostered the growth of the food and beverage packaging industry is the driving factor this market.
              • which is the driving factor this market.
              • in turn is the driving factor this market.
              • will contribute to the growth of the flexographic printing machines industry. Packaging is used as a primary tool for marketing and brand promotion is the driving factor this market.
              • which attracts the attention of buyers. The growing population is the driving factor this market.
              • coupled with the rising demand for consumer goods and the increase in disposable income in developing countries such as India is the driving factor this market.
              • Brazil is the driving factor this market.
              • and China is the driving factor this market.
              • are expected to increase the demand for the packaging industry is the driving factor this market.
              • which will further drive the growth of the global flexographic printing machine market during the forecast period. is the driving factor this market.

              The Flexographic Printing Machine market vendors should focus on grabbing business opportunities from the Flexible packaging segment as it accounted for the largest market share in the base year.