Flexible Office Market Analysis, Size, and Forecast 2026-2030: APAC (China, Japan, and India), Europe (Germany, UK, and France), North America (US, Canada, and Mexico), Middle East and Africa (Saudi Arabia, UAE, and South Africa), South America (Brazil, Argentina, and Colombia), and Rest of World (ROW)

Flexible Office Market Analysis, Size, and Forecast 2026-2030:
APAC (China, Japan, and India), Europe (Germany, UK, and France), North America (US, Canada, and Mexico), Middle East and Africa (Saudi Arabia, UAE, and South Africa), South America (Brazil, Argentina, and Colombia), and Rest of World (ROW)

Published: Dec 2025 295 Pages SKU: IRTNTR80154

Market Overview at a Glance

$34.21 B
Market Opportunity
9.4%
CAGR 2025 - 2030
39.9%
APAC Growth
$25.19 B
Coworking spaces segment 2024

Flexible Office Market Size 2026-2030

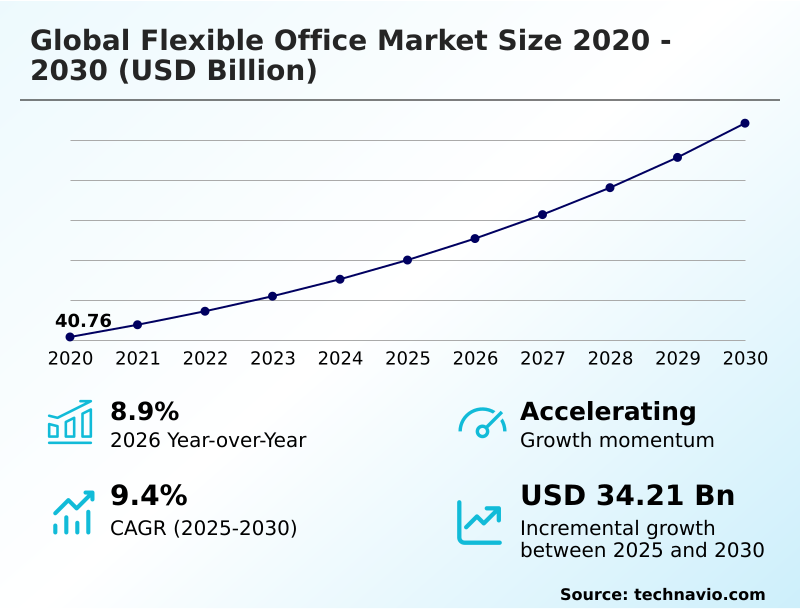
The flexible office market size is valued to increase by USD 34.21 billion, at a CAGR of 9.4% from 2025 to 2030. Rise in shift towards remote and hybrid modes of work will drive the flexible office market.

Major Market Trends & Insights

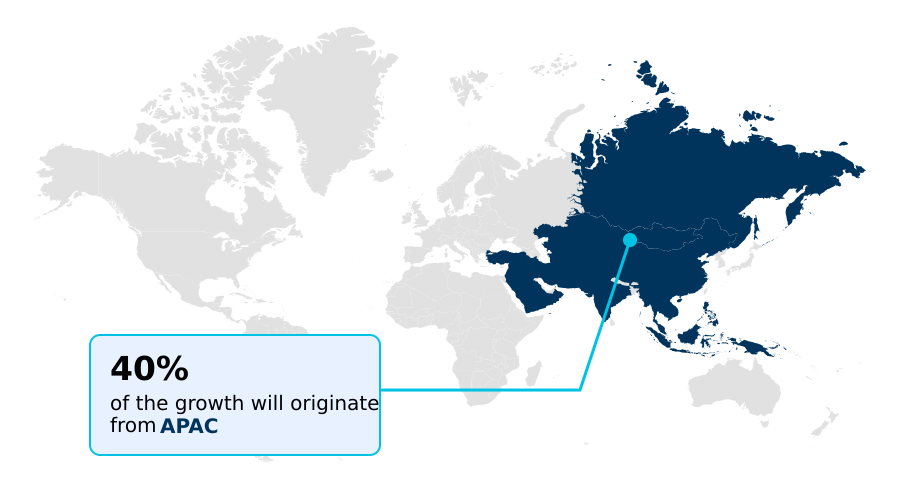
  • APAC dominated the market and accounted for a 39.9% growth during the forecast period.
  • By Type - Coworking spaces segment was valued at USD 25.19 billion in 2024
  • By End-user - IT segment accounted for the largest market revenue share in 2024

Market Size & Forecast

  • Market Opportunities: USD 53.44 billion
  • Market Future Opportunities: USD 34.21 billion
  • CAGR from 2025 to 2030 : 9.4%

Market Summary

  • The flexible office market is undergoing a significant transformation, driven by the corporate adoption of hybrid work policies and a strategic shift toward portfolio agility. Organizations are increasingly leveraging these dynamic environments to reduce long-term lease liabilities, enhance talent attraction, and support distributed teams.
  • The core offering has evolved beyond shared desks to encompass a range of solutions, including private branded suites, on-demand meeting rooms, and comprehensive managed office services. This model provides the scalability necessary for modern business, allowing companies to expand or contract their physical footprint in response to market changes.
  • For instance, a technology firm can establish a new project team in a different region within days by utilizing a turnkey workspace, bypassing the months-long process and capital expenditure associated with traditional office fit-outs. This agile real estate strategy enables operational efficiency and cost control.
  • As providers focus on enterprise-grade security and hospitality-led services, flexible workspaces are solidifying their role as an indispensable component of corporate real estate strategy, catering to businesses from startups to large multinational corporations.

What will be the Size of the Flexible Office Market during the forecast period?

Get Key Insights on Market Forecast (PDF) Request Free Sample

How is the Flexible Office Market Segmented?

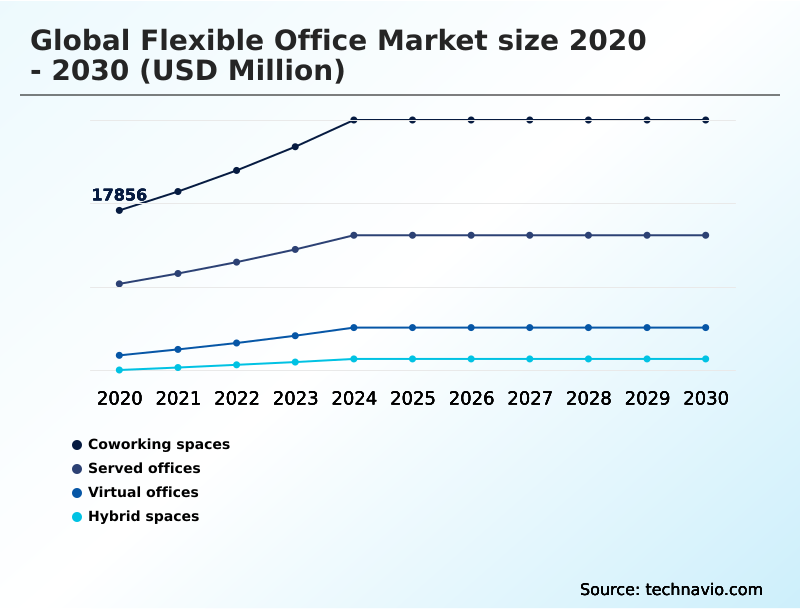
The flexible office industry research report provides comprehensive data (region-wise segment analysis), with forecasts and estimates in "USD million" for the period 2026-2030, as well as historical data from 2020-2024 for the following segments.

  • Type
    • Coworking spaces
    • Served offices
    • Virtual offices
    • Hybrid spaces
  • End-user
    • IT
    • BFSI
    • Retail and consumer
    • Others
  • Organization size
    • Large enterprise
    • SMEs
    • Startups
  • Geography
    • APAC
      • China
      • Japan
      • India
    • Europe
      • Germany
      • UK
      • France
    • North America
      • US
      • Canada
      • Mexico
    • Middle East and Africa
      • Saudi Arabia
      • UAE
      • South Africa
    • South America
      • Brazil
      • Argentina
      • Colombia
    • Rest of World (ROW)

By Type Insights

The coworking spaces segment is estimated to witness significant growth during the forecast period.

The market is segmented by offerings such as coworking spaces, serviced offices, and hybrid spaces. Coworking spaces have matured, moving from a growth-at-all-costs model toward sustainable profitability through managed office solutions.

This evolution is validated by strong investor confidence, with one operator's initial public offering being oversubscribed by more than 108 times, signaling a definitive shift toward asset-light management.

This corporate real estate strategy is increasingly favored for its operational cost reduction benefits. Providers are delivering enterprise flex environments and turnkey workspaces to meet rising demand from companies implementing a hub-and-spoke model.

The focus on landlord-operator partnerships and bespoke design solutions further enhances employee productivity and supports business process outsourcing, making these collaborative work environments a core part of modern real estate portfolio optimization.

Request Free Sample

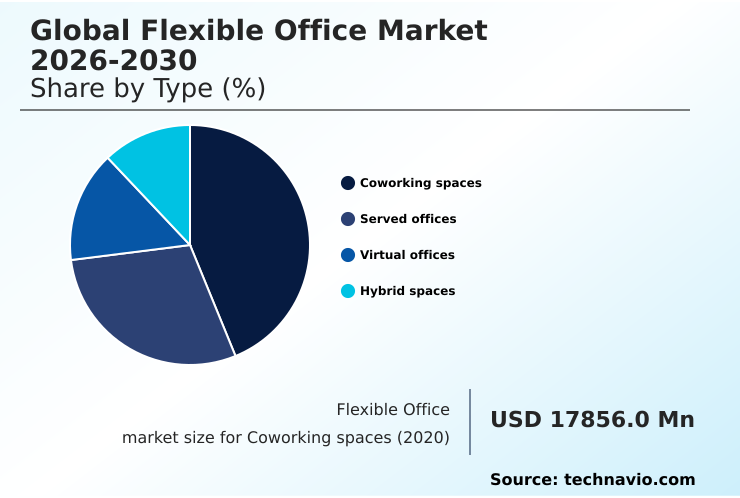
The Coworking spaces segment was valued at USD 25.19 billion in 2024 and showed a gradual increase during the forecast period.

Request Free Sample

Regional Analysis

APAC is estimated to contribute 39.9% to the growth of the global market during the forecast period.Technavio’s analysts have elaborately explained the regional trends and drivers that shape the market during the forecast period.

See How Flexible Office Market Demand is Rising in APAC Request Free Sample

The geographic landscape of the flexible office market is diversifying, with significant activity extending beyond traditional hubs. The market is segmented by region, including North America, Europe, APAC, Middle East and Africa, and South America.

While mature markets are defined by a flight to quality and amenity-rich environments, emerging regions are experiencing rapid growth driven by government initiatives and corporate expansion.

For example, demand in Riyadh surged by 58% due to programs encouraging international firms to establish regional headquarters.

Overall, APAC is projected to contribute 39.9% of the market's incremental growth, fueled by tier two city expansion and the establishment of satellite offices. This trend reflects the broader adoption of the hub-and-spoke model and workspace-as-a-service concepts.

The demand for virtual offices and flexible leasing terms is also growing globally, supporting the work-from-anywhere capability and talent attraction and retention for distributed workforce models.

Market Dynamics

Our researchers analyzed the data with 2025 as the base year, along with the key drivers, trends, and challenges. A holistic analysis of drivers will help companies refine their marketing strategies to gain a competitive advantage.

  • The global flexible office market 2026-2030 is increasingly shaped by sophisticated enterprise requirements that go beyond basic desk rentals. A detailed cost-benefit analysis of coworking spaces reveals that while upfront savings are significant, the true value lies in long-term operational agility. For large enterprises, designing amenity-rich flexible workspaces is now a strategic imperative for talent retention.
  • The roi of agile real estate is realized through the adoption of hub-and-spoke real estate models and workspace-as-a-service adoption drivers, which allow companies to scale without massive capital outlay. Managing data security in coworking remains a critical concern, pushing providers to offer enterprise-grade security in shared offices.
  • Technology integration in smart offices and the impact of proptech on workspace management are central to optimizing space with utilization data. Turnkey solutions for corporate teams now often include sustainable flexible office certifications and features that focus on integrating wellness into office design, a trend gaining traction faster than traditional sustainability metrics.
  • The distinction between lease arbitrage vs management agreements is also becoming a key consideration in operator strategy. Furthermore, the virtual office for business registration is seeing renewed interest due to stricter legal compliance for virtual offices.
  • These specialized applications, including flexible office for bpo operations and flexible office solutions for startups, highlight a market that is maturing rapidly to meet diverse corporate needs.

What are the key market drivers leading to the rise in the adoption of Flexible Office Industry?

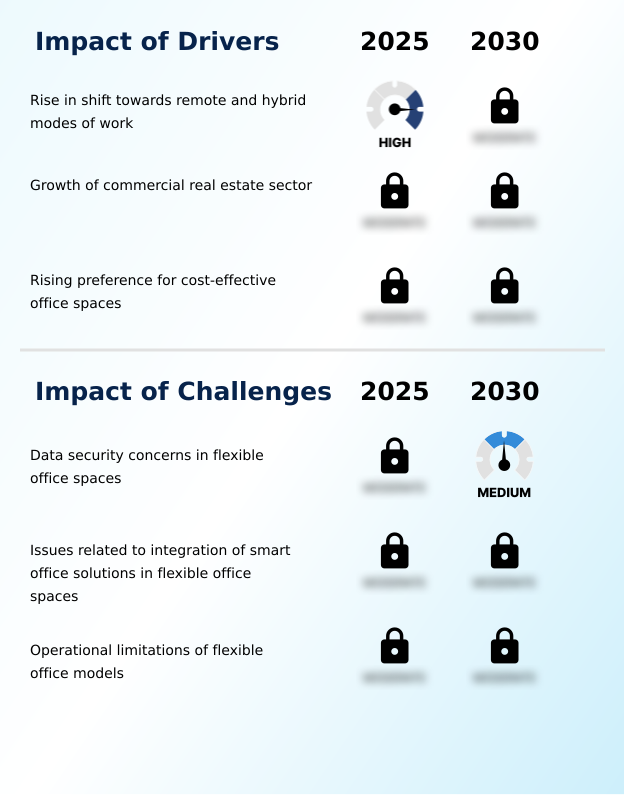
  • The rise in the shift toward remote and hybrid modes of work is a key driver influencing the market's growth.

  • Primary market drivers are centered on financial efficiency and operational agility, compelling organizations to adopt new real estate strategies. The focus on capital expenditure avoidance is paramount, with companies increasingly choosing short-term lease agreements over traditional long-term commitments.
  • This shift is fueling the demand for premium flexible workspace and has led to a 163% year-over-year surge in demand in nearshoring hotspots.
  • Remote work adoption continues to be a significant factor, reinforcing the need for cost-efficient office spaces that enhance employee well-being. The growth of the commercial real estate investment market is also pivotal, as developers create more collaborative work environments.
  • This focus has resulted in some operators reporting leasing performance significantly ahead of market rental values, demonstrating the high value placed on flexibility and service.

What are the market trends shaping the Flexible Office Industry?

  • The increasing demand for flexible office spaces is a significant market trend. This is driven by the growing need for agile and cost-effective workspace solutions across various industries.

  • Key market trends are redefining workspace consumption, driven by the rising adoption of plug-and-play infrastructure and managed partnership agreements. The market is witnessing a pronounced shift towards tier two city expansion as companies seek to attract talent beyond primary metropolitan areas, a strategy that supports decentralized operations.
  • This trend is amplified by the growing preference for hybrid work models, which has led to a 23% increase in market growth in some regions. The demand for custom build-outs and bespoke design solutions is also rising, as enterprises want their flexible spaces to reflect their brand and culture.
  • The expansion of startup ecosystem hubs is further fueling momentum, with real estate technology (proptech) playing a crucial role in enhancing the user experience. With over 106,000 seats absorbed in a six-month period in one key market, the demand for flexible workspace solutions is clearly accelerating.

What challenges does the Flexible Office Industry face during its growth?

  • Data security concerns associated with shared infrastructure in flexible office spaces present a key challenge to market growth.

  • The primary challenge facing the market is balancing flexibility with security and operational control. The integration of managed aggregation models introduces complexities in maintaining consistent service levels and data protection across diverse locations.
  • Issues arise from the need to secure shared office environments, where the risk of data breaches is perceived to be higher, often mandating the use of robust VPNs and secure platforms. The project-based team spaces model, while agile, can strain IT resources.
  • Furthermore, high office vacancy rates in some major cities, reaching up to 22%, create intense price competition, impacting the profitability of office hotelification and other innovative concepts.
  • Selecting the right enterprise client solutions is also difficult, as many organizations lack the expertise to integrate new platforms with legacy systems, hindering the adoption of advanced workspace utilization analytics and tenant retention strategies.

Exclusive Technavio Analysis on Customer Landscape

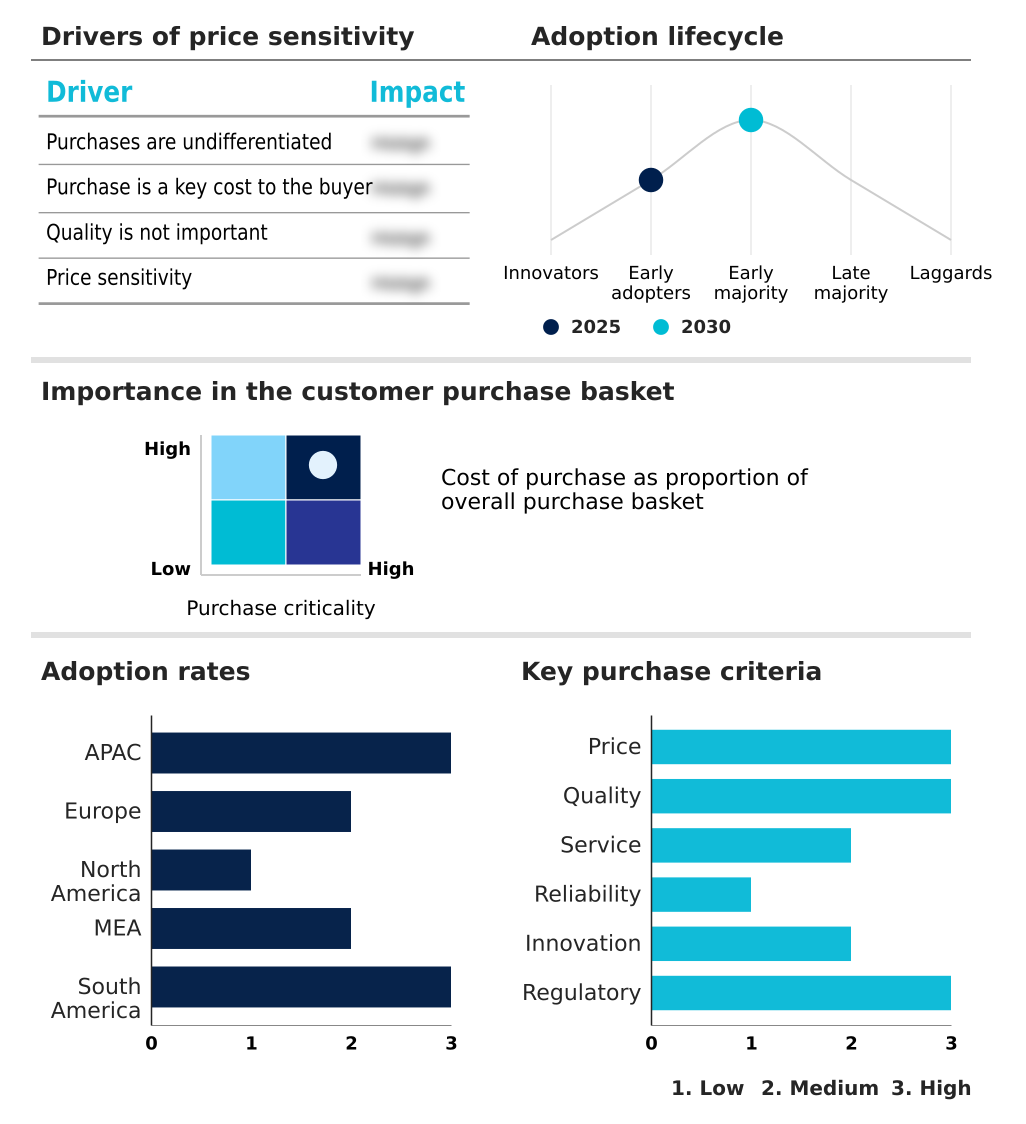
The flexible office market forecasting report includes the adoption lifecycle of the market, covering from the innovator’s stage to the laggard’s stage. It focuses on adoption rates in different regions based on penetration. Furthermore, the flexible office market report also includes key purchase criteria and drivers of price sensitivity to help companies evaluate and develop their market growth analysis strategies.

Customer Landscape of Flexible Office Industry

Competitive Landscape

Companies are implementing various strategies, such as strategic alliances, flexible office market forecast, partnerships, mergers and acquisitions, geographical expansion, and product/service launches, to enhance their presence in the industry.

Ally Spaces - Offerings include flexible office solutions such as fully amenitized coworking spaces tailored for businesses of all sizes, supporting agile work environments in prime locations.

The industry research and growth report includes detailed analyses of the competitive landscape of the market and information about key companies, including:

  • Ally Spaces
  • Awfis Space Solutions Ltd.
  • BizSpace Ltd.
  • Bond Collective
  • CBRE Group Inc.
  • Hub Australia Pty Ltd
  • Incuspaze Solutions Pvt Ltd.
  • Industrious
  • International Workplace Group plc
  • Mindspace Ltd.
  • Premier Office Centers LLC
  • Serendipity Labs
  • Servcorp Ltd.
  • Techspace Group Ltd.
  • The Office Group
  • United Franchise Group
  • Vast Coworking Group
  • WeWork Inc.
  • Workbar

Qualitative and quantitative analysis of companies has been conducted to help clients understand the wider business environment as well as the strengths and weaknesses of key industry players. Data is qualitatively analyzed to categorize companies as pure play, category-focused, industry-focused, and diversified; it is quantitatively analyzed to categorize companies as dominant, leading, strong, tentative, and weak.

Recent Development and News in Flexible office market

  • In May 2024, Awfis Space Solutions Ltd. launched its Initial Public Offering, becoming the first flexible workspace operator in India to be publicly listed and demonstrating strong investor confidence with an oversubscription of more than 108 times.
  • In June 2024, WeWork Inc. officially emerged from Chapter 11 bankruptcy in the US and Canada, having eliminated billions in debt and renegotiated numerous leases to focus on sustainable, profitable operations.
  • In December 2024, International Workplace Group plc announced plans to open 17 new hybrid working centers in the Philippines, targeting both urban hubs and regional provinces to serve decentralized workforces.
  • In January 2025, CBRE Group Inc. announced the acquisition of the remaining equity interest in Industrious to create a new business segment focused on building operations and experience, signaling the maturation of flexible workspace as a core asset class.

Dive into Technavio’s robust research methodology, blending expert interviews, extensive data synthesis, and validated models for unparalleled Flexible Office Market insights. See full methodology.

Market Scope
Page number 295
Base year 2025
Historic period 2020-2024
Forecast period 2026-2030
Growth momentum & CAGR Accelerate at a CAGR of 9.4%
Market growth 2026-2030 USD 34207.1 million
Market structure Fragmented
YoY growth 2025-2026(%) 8.9%
Key countries China, Japan, India, South Korea, Indonesia, Australia, Germany, UK, France, Italy, Spain, The Netherlands, US, Canada, Mexico, Saudi Arabia, UAE, South Africa, Israel, Turkey, Brazil, Argentina and Colombia
Competitive landscape Leading Companies, Market Positioning of Companies, Competitive Strategies, and Industry Risks

Request Free Sample

Research Analyst Overview

  • The flexible office market is defined by a strategic shift from traditional real estate leasing to dynamic, service-oriented models. Key offerings include coworking spaces, serviced offices, virtual offices, and fully integrated hybrid spaces. The industry's momentum is sustained by the corporate adoption of agile real estate strategy, with a focus on asset-light management and managed office solutions.
  • Companies are implementing the core-plus-flex model to optimize their portfolios, utilizing satellite offices and enterprise flex environments to support distributed teams. The workspace-as-a-service concept, facilitated by digital booking systems and smart building technology, is becoming standard. This transition allows for flexible leasing terms and on-demand meeting rooms, which are critical for businesses prioritizing agility.
  • The market's evolution is also marked by a move toward hospitality-led service, with operators providing amenity-rich environments and turnkey workspaces. In some premium markets, these fully managed spaces have demonstrated leasing performance significantly ahead of traditional market rental values, reflecting strong demand.
  • As a result, providers are increasingly offering private branded suites with enterprise-grade security to attract and retain high-value corporate clients.

What are the Key Data Covered in this Flexible Office Market Research and Growth Report?

  • What is the expected growth of the Flexible Office Market between 2026 and 2030?

    • USD 34.21 billion, at a CAGR of 9.4%

  • What segmentation does the market report cover?

    • The report is segmented by Type (Coworking spaces, Served offices, Virtual offices, and Hybrid spaces), End-user (IT, BFSI, Retail and consumer, and Others), Organization Size (Large enterprise, SMEs, and Startups) and Geography (APAC, Europe, North America, Middle East and Africa, South America)

  • Which regions are analyzed in the report?

    • APAC, Europe, North America, Middle East and Africa and South America

  • What are the key growth drivers and market challenges?

    • Rise in shift towards remote and hybrid modes of work, Data security concerns in flexible office spaces

  • Who are the major players in the Flexible Office Market?

    • Ally Spaces, Awfis Space Solutions Ltd., BizSpace Ltd., Bond Collective, CBRE Group Inc., Hub Australia Pty Ltd, Incuspaze Solutions Pvt Ltd., Industrious, International Workplace Group plc, Mindspace Ltd., Premier Office Centers LLC, Serendipity Labs, Servcorp Ltd., Techspace Group Ltd., The Office Group, United Franchise Group, Vast Coworking Group, WeWork Inc. and Workbar

Market Research Insights

  • The dynamics of the flexible office market are shaped by corporate efforts to optimize real estate portfolios and enhance workforce agility. The adoption of distributed workforce models has become a cornerstone of modern corporate real estate strategy, leading to a 14% year-over-year increase in inquiries for flexible space.
  • This flight to quality is evident as companies prioritize premium, amenity-rich environments, causing median desk rates in prime locations to rise by approximately 7%. Businesses are focused on capital expenditure avoidance and operational cost reduction, making the value proposition of flexible leasing highly attractive. Consequently, landlord-operator partnerships are becoming more prevalent, enabling facility management integration and better workspace utilization analytics.
  • These trends support talent attraction and retention by offering employees superior work environments and reduced commute times, aligning with evolving return-to-office mandates and employee well-being initiatives.

We can help! Our analysts can customize this flexible office market research report to meet your requirements.

Get in touch

1. Executive Summary

1.1 Market overview

Executive Summary - Chart on Market Overview
Executive Summary - Data Table on Market Overview
Executive Summary - Chart on Global Market Characteristics
Executive Summary - Chart on Market by Geography
Executive Summary - Chart on Market Segmentation by Type
Executive Summary - Chart on Market Segmentation by End-user
Executive Summary - Chart on Market Segmentation by Organization Size
Executive Summary - Chart on Incremental Growth
Executive Summary - Data Table on Incremental Growth
Executive Summary - Chart on Company Market Positioning

2. Technavio Analysis

2.1 Analysis of price sensitivity, lifecycle, customer purchase basket, adoption rates, and purchase criteria

2.2 Criticality of inputs and Factors of differentiation

Chart on Overview on criticality of inputs and factors of differentiation

2.3 Factors of disruption

Chart on Overview on factors of disruption

2.4 Impact of drivers and challenges

Chart on Impact of drivers and challenges in 2025 and 2030

3. Market Landscape

3.1 Market ecosystem

Chart on Parent Market
Data Table on - Parent Market

3.2 Market characteristics

Chart on Market characteristics analysis

3.3 Value chain analysis

Chart on Value chain analysis

4. Market Sizing

4.1 Market definition

Data Table on Offerings of companies included in the market definition

4.2 Market segment analysis

Market segments

4.3 Market size 2025

4.4 Market outlook: Forecast for 2025-2030

Chart on Global - Market size and forecast 2025-2030 ($ million)
Data Table on Global - Market size and forecast 2025-2030 ($ million)
Chart on Global Market: Year-over-year growth 2025-2030 (%)
Data Table on Global Market: Year-over-year growth 2025-2030 (%)

5. Historic Market Size

5.1 Global Flexible Office Market 2020 - 2024

Historic Market Size - Data Table on Global Flexible Office Market 2020 - 2024 ($ million)

5.2 Type segment analysis 2020 - 2024

Historic Market Size - Type Segment 2020 - 2024 ($ million)

5.3 End-user segment analysis 2020 - 2024

Historic Market Size - End-user Segment 2020 - 2024 ($ million)

5.4 Organization Size segment analysis 2020 - 2024

Historic Market Size - Organization Size Segment 2020 - 2024 ($ million)

5.5 Geography segment analysis 2020 - 2024

Historic Market Size - Geography Segment 2020 - 2024 ($ million)

5.6 Country segment analysis 2020 - 2024

Historic Market Size - Country Segment 2020 - 2024 ($ million)

6. Qualitative Analysis

6.1 Impact of AI in global flexible office market

7. Five Forces Analysis

7.1 Five forces summary

Five forces analysis - Comparison between 2025 and 2030

7.2 Bargaining power of buyers

Bargaining power of buyers - Impact of key factors 2025 and 2030

7.3 Bargaining power of suppliers

Bargaining power of suppliers - Impact of key factors in 2025 and 2030

7.4 Threat of new entrants

Threat of new entrants - Impact of key factors in 2025 and 2030

7.5 Threat of substitutes

Threat of substitutes - Impact of key factors in 2025 and 2030

7.6 Threat of rivalry

Threat of rivalry - Impact of key factors in 2025 and 2030

7.7 Market condition

Chart on Market condition - Five forces 2025 and 2030

8. Market Segmentation by Type

8.1 Market segments

Chart on Type - Market share 2025-2030 (%)
Data Table on Type - Market share 2025-2030 (%)

8.2 Comparison by Type

Chart on Comparison by Type
Data Table on Comparison by Type

8.3 Coworking spaces - Market size and forecast 2025-2030

Chart on Coworking spaces - Market size and forecast 2025-2030 ($ million)
Data Table on Coworking spaces - Market size and forecast 2025-2030 ($ million)
Chart on Coworking spaces - Year-over-year growth 2025-2030 (%)
Data Table on Coworking spaces - Year-over-year growth 2025-2030 (%)

8.4 Served offices - Market size and forecast 2025-2030

Chart on Served offices - Market size and forecast 2025-2030 ($ million)
Data Table on Served offices - Market size and forecast 2025-2030 ($ million)
Chart on Served offices - Year-over-year growth 2025-2030 (%)
Data Table on Served offices - Year-over-year growth 2025-2030 (%)

8.5 Virtual offices - Market size and forecast 2025-2030

Chart on Virtual offices - Market size and forecast 2025-2030 ($ million)
Data Table on Virtual offices - Market size and forecast 2025-2030 ($ million)
Chart on Virtual offices - Year-over-year growth 2025-2030 (%)
Data Table on Virtual offices - Year-over-year growth 2025-2030 (%)

8.6 Hybrid spaces - Market size and forecast 2025-2030

Chart on Hybrid spaces - Market size and forecast 2025-2030 ($ million)
Data Table on Hybrid spaces - Market size and forecast 2025-2030 ($ million)
Chart on Hybrid spaces - Year-over-year growth 2025-2030 (%)
Data Table on Hybrid spaces - Year-over-year growth 2025-2030 (%)

8.7 Market opportunity by Type

Market opportunity by Type ($ million)
Data Table on Market opportunity by Type ($ million)

9. Market Segmentation by End-user

9.1 Market segments

Chart on End-user - Market share 2025-2030 (%)
Data Table on End-user - Market share 2025-2030 (%)

9.2 Comparison by End-user

Chart on Comparison by End-user
Data Table on Comparison by End-user

9.3 IT - Market size and forecast 2025-2030

Chart on IT - Market size and forecast 2025-2030 ($ million)
Data Table on IT - Market size and forecast 2025-2030 ($ million)
Chart on IT - Year-over-year growth 2025-2030 (%)
Data Table on IT - Year-over-year growth 2025-2030 (%)

9.4 BFSI - Market size and forecast 2025-2030

Chart on BFSI - Market size and forecast 2025-2030 ($ million)
Data Table on BFSI - Market size and forecast 2025-2030 ($ million)
Chart on BFSI - Year-over-year growth 2025-2030 (%)
Data Table on BFSI - Year-over-year growth 2025-2030 (%)

9.5 Retail and consumer - Market size and forecast 2025-2030

Chart on Retail and consumer - Market size and forecast 2025-2030 ($ million)
Data Table on Retail and consumer - Market size and forecast 2025-2030 ($ million)
Chart on Retail and consumer - Year-over-year growth 2025-2030 (%)
Data Table on Retail and consumer - Year-over-year growth 2025-2030 (%)

9.6 Others - Market size and forecast 2025-2030

Chart on Others - Market size and forecast 2025-2030 ($ million)
Data Table on Others - Market size and forecast 2025-2030 ($ million)
Chart on Others - Year-over-year growth 2025-2030 (%)
Data Table on Others - Year-over-year growth 2025-2030 (%)

9.7 Market opportunity by End-user

Market opportunity by End-user ($ million)
Data Table on Market opportunity by End-user ($ million)

10. Market Segmentation by Organization Size

10.1 Market segments

Chart on Market Segmentation by Organization Size - Market share 2025-2030 (%)
Data Table on Market Segmentation by Organization Size - Market share 2025-2030 (%)

10.2 Comparison by Market Segmentation by Organization Size

Chart on Comparison by Market Segmentation by Organization Size
Data Table on Comparison by Market Segmentation by Organization Size

10.3 Large enterprise - Market size and forecast 2025-2030

Chart on Large enterprise - Market size and forecast 2025-2030 ($ million)
Data Table on Large enterprise - Market size and forecast 2025-2030 ($ million)
Chart on Large enterprise - Year-over-year growth 2025-2030 (%)
Data Table on Large enterprise - Year-over-year growth 2025-2030 (%)

10.4 SMEs - Market size and forecast 2025-2030

Chart on SMEs - Market size and forecast 2025-2030 ($ million)
Data Table on SMEs - Market size and forecast 2025-2030 ($ million)
Chart on SMEs - Year-over-year growth 2025-2030 (%)
Data Table on SMEs - Year-over-year growth 2025-2030 (%)

10.5 Startups - Market size and forecast 2025-2030

Chart on Startups - Market size and forecast 2025-2030 ($ million)
Data Table on Startups - Market size and forecast 2025-2030 ($ million)
Chart on Startups - Year-over-year growth 2025-2030 (%)
Data Table on Startups - Year-over-year growth 2025-2030 (%)

10.6 Market opportunity by Market Segmentation by Organization Size

Market opportunity by Market Segmentation by Organization Size ($ million)
Data Table on Market opportunity by Market Segmentation by Organization Size ($ million)

11. Customer Landscape

11.1 Customer landscape overview

Analysis of price sensitivity, lifecycle, customer purchase basket, adoption rates, and purchase criteria

12. Geographic Landscape

12.1 Geographic segmentation

Chart on Market share by geography 2025-2030 (%)
Data Table on Market share by geography 2025-2030 (%)

12.2 Geographic comparison

Chart on Geographic comparison
Data Table on Geographic comparison

12.3 APAC - Market size and forecast 2025-2030

Chart on APAC - Market size and forecast 2025-2030 ($ million)
Data Table on APAC - Market size and forecast 2025-2030 ($ million)
Chart on APAC - Year-over-year growth 2025-2030 (%)
Data Table on APAC - Year-over-year growth 2025-2030 (%)
Chart on Regional Comparison - APAC
Data Table on Regional Comparison - APAC

12.3.1 China - Market size and forecast 2025-2030

Chart on China - Market size and forecast 2025-2030 ($ million)
Data Table on China - Market size and forecast 2025-2030 ($ million)
Chart on China - Year-over-year growth 2025-2030 (%)
Data Table on China - Year-over-year growth 2025-2030 (%)

12.3.2 Japan - Market size and forecast 2025-2030

Chart on Japan - Market size and forecast 2025-2030 ($ million)
Data Table on Japan - Market size and forecast 2025-2030 ($ million)
Chart on Japan - Year-over-year growth 2025-2030 (%)
Data Table on Japan - Year-over-year growth 2025-2030 (%)

12.3.3 India - Market size and forecast 2025-2030

Chart on India - Market size and forecast 2025-2030 ($ million)
Data Table on India - Market size and forecast 2025-2030 ($ million)
Chart on India - Year-over-year growth 2025-2030 (%)
Data Table on India - Year-over-year growth 2025-2030 (%)

12.3.4 South Korea - Market size and forecast 2025-2030

Chart on South Korea - Market size and forecast 2025-2030 ($ million)
Data Table on South Korea - Market size and forecast 2025-2030 ($ million)
Chart on South Korea - Year-over-year growth 2025-2030 (%)
Data Table on South Korea - Year-over-year growth 2025-2030 (%)

12.3.5 Indonesia - Market size and forecast 2025-2030

Chart on Indonesia - Market size and forecast 2025-2030 ($ million)
Data Table on Indonesia - Market size and forecast 2025-2030 ($ million)
Chart on Indonesia - Year-over-year growth 2025-2030 (%)
Data Table on Indonesia - Year-over-year growth 2025-2030 (%)

12.3.6 Australia - Market size and forecast 2025-2030

Chart on Australia - Market size and forecast 2025-2030 ($ million)
Data Table on Australia - Market size and forecast 2025-2030 ($ million)
Chart on Australia - Year-over-year growth 2025-2030 (%)
Data Table on Australia - Year-over-year growth 2025-2030 (%)

12.4 Europe - Market size and forecast 2025-2030

Chart on Europe - Market size and forecast 2025-2030 ($ million)
Data Table on Europe - Market size and forecast 2025-2030 ($ million)
Chart on Europe - Year-over-year growth 2025-2030 (%)
Data Table on Europe - Year-over-year growth 2025-2030 (%)
Chart on Regional Comparison - Europe
Data Table on Regional Comparison - Europe

12.4.1 Germany - Market size and forecast 2025-2030

Chart on Germany - Market size and forecast 2025-2030 ($ million)
Data Table on Germany - Market size and forecast 2025-2030 ($ million)
Chart on Germany - Year-over-year growth 2025-2030 (%)
Data Table on Germany - Year-over-year growth 2025-2030 (%)

12.4.2 UK - Market size and forecast 2025-2030

Chart on UK - Market size and forecast 2025-2030 ($ million)
Data Table on UK - Market size and forecast 2025-2030 ($ million)
Chart on UK - Year-over-year growth 2025-2030 (%)
Data Table on UK - Year-over-year growth 2025-2030 (%)

12.4.3 France - Market size and forecast 2025-2030

Chart on France - Market size and forecast 2025-2030 ($ million)
Data Table on France - Market size and forecast 2025-2030 ($ million)
Chart on France - Year-over-year growth 2025-2030 (%)
Data Table on France - Year-over-year growth 2025-2030 (%)

12.4.4 Italy - Market size and forecast 2025-2030

Chart on Italy - Market size and forecast 2025-2030 ($ million)
Data Table on Italy - Market size and forecast 2025-2030 ($ million)
Chart on Italy - Year-over-year growth 2025-2030 (%)
Data Table on Italy - Year-over-year growth 2025-2030 (%)

12.4.5 Spain - Market size and forecast 2025-2030

Chart on Spain - Market size and forecast 2025-2030 ($ million)
Data Table on Spain - Market size and forecast 2025-2030 ($ million)
Chart on Spain - Year-over-year growth 2025-2030 (%)
Data Table on Spain - Year-over-year growth 2025-2030 (%)

12.4.6 The Netherlands - Market size and forecast 2025-2030

Chart on The Netherlands - Market size and forecast 2025-2030 ($ million)
Data Table on The Netherlands - Market size and forecast 2025-2030 ($ million)
Chart on The Netherlands - Year-over-year growth 2025-2030 (%)
Data Table on The Netherlands - Year-over-year growth 2025-2030 (%)

12.5 North America - Market size and forecast 2025-2030

Chart on North America - Market size and forecast 2025-2030 ($ million)
Data Table on North America - Market size and forecast 2025-2030 ($ million)
Chart on North America - Year-over-year growth 2025-2030 (%)
Data Table on North America - Year-over-year growth 2025-2030 (%)
Chart on Regional Comparison - North America
Data Table on Regional Comparison - North America

12.5.1 US - Market size and forecast 2025-2030

Chart on US - Market size and forecast 2025-2030 ($ million)
Data Table on US - Market size and forecast 2025-2030 ($ million)
Chart on US - Year-over-year growth 2025-2030 (%)
Data Table on US - Year-over-year growth 2025-2030 (%)

12.5.2 Canada - Market size and forecast 2025-2030

Chart on Canada - Market size and forecast 2025-2030 ($ million)
Data Table on Canada - Market size and forecast 2025-2030 ($ million)
Chart on Canada - Year-over-year growth 2025-2030 (%)
Data Table on Canada - Year-over-year growth 2025-2030 (%)

12.5.3 Mexico - Market size and forecast 2025-2030

Chart on Mexico - Market size and forecast 2025-2030 ($ million)
Data Table on Mexico - Market size and forecast 2025-2030 ($ million)
Chart on Mexico - Year-over-year growth 2025-2030 (%)
Data Table on Mexico - Year-over-year growth 2025-2030 (%)

12.6 Middle East and Africa - Market size and forecast 2025-2030

Chart on Middle East and Africa - Market size and forecast 2025-2030 ($ million)
Data Table on Middle East and Africa - Market size and forecast 2025-2030 ($ million)
Chart on Middle East and Africa - Year-over-year growth 2025-2030 (%)
Data Table on Middle East and Africa - Year-over-year growth 2025-2030 (%)
Chart on Regional Comparison - Middle East and Africa
Data Table on Regional Comparison - Middle East and Africa

12.6.1 Saudi Arabia - Market size and forecast 2025-2030

Chart on Saudi Arabia - Market size and forecast 2025-2030 ($ million)
Data Table on Saudi Arabia - Market size and forecast 2025-2030 ($ million)
Chart on Saudi Arabia - Year-over-year growth 2025-2030 (%)
Data Table on Saudi Arabia - Year-over-year growth 2025-2030 (%)

12.6.2 UAE - Market size and forecast 2025-2030

Chart on UAE - Market size and forecast 2025-2030 ($ million)
Data Table on UAE - Market size and forecast 2025-2030 ($ million)
Chart on UAE - Year-over-year growth 2025-2030 (%)
Data Table on UAE - Year-over-year growth 2025-2030 (%)

12.6.3 South Africa - Market size and forecast 2025-2030

Chart on South Africa - Market size and forecast 2025-2030 ($ million)
Data Table on South Africa - Market size and forecast 2025-2030 ($ million)
Chart on South Africa - Year-over-year growth 2025-2030 (%)
Data Table on South Africa - Year-over-year growth 2025-2030 (%)

12.6.4 Israel - Market size and forecast 2025-2030

Chart on Israel - Market size and forecast 2025-2030 ($ million)
Data Table on Israel - Market size and forecast 2025-2030 ($ million)
Chart on Israel - Year-over-year growth 2025-2030 (%)
Data Table on Israel - Year-over-year growth 2025-2030 (%)

12.6.5 Turkey - Market size and forecast 2025-2030

Chart on Turkey - Market size and forecast 2025-2030 ($ million)
Data Table on Turkey - Market size and forecast 2025-2030 ($ million)
Chart on Turkey - Year-over-year growth 2025-2030 (%)
Data Table on Turkey - Year-over-year growth 2025-2030 (%)

12.7 South America - Market size and forecast 2025-2030

Chart on South America - Market size and forecast 2025-2030 ($ million)
Data Table on South America - Market size and forecast 2025-2030 ($ million)
Chart on South America - Year-over-year growth 2025-2030 (%)
Data Table on South America - Year-over-year growth 2025-2030 (%)
Chart on Regional Comparison - South America
Data Table on Regional Comparison - South America

12.7.1 Brazil - Market size and forecast 2025-2030

Chart on Brazil - Market size and forecast 2025-2030 ($ million)
Data Table on Brazil - Market size and forecast 2025-2030 ($ million)
Chart on Brazil - Year-over-year growth 2025-2030 (%)
Data Table on Brazil - Year-over-year growth 2025-2030 (%)

12.7.2 Argentina - Market size and forecast 2025-2030

Chart on Argentina - Market size and forecast 2025-2030 ($ million)
Data Table on Argentina - Market size and forecast 2025-2030 ($ million)
Chart on Argentina - Year-over-year growth 2025-2030 (%)
Data Table on Argentina - Year-over-year growth 2025-2030 (%)

12.7.3 Colombia - Market size and forecast 2025-2030

Chart on Colombia - Market size and forecast 2025-2030 ($ million)
Data Table on Colombia - Market size and forecast 2025-2030 ($ million)
Chart on Colombia - Year-over-year growth 2025-2030 (%)
Data Table on Colombia - Year-over-year growth 2025-2030 (%)

12.8 Market opportunity by geography

Market opportunity by geography ($ million)
Data Tables on Market opportunity by geography ($ million)

13. Drivers, Challenges, and Opportunity

13.1 Market drivers

Rise in shift towards remote and hybrid modes of work
Growth of commercial real estate sector
Rising preference for cost-effective office spaces

13.2 Market challenges

Data security concerns in flexible office spaces
Issues related to integration of smart office solutions in flexible office spaces
Operational limitations of flexible office models

13.3 Impact of drivers and challenges

Impact of drivers and challenges in 2025 and 2030

13.4 Market opportunities

Increasing demand for flexible office spaces
Rising adoption of flexible office spaces by startups
Increase in number of mergers and acquisitions among companies

14. Competitive Landscape

14.1 Overview

14.2

Overview on criticality of inputs and factors of differentiation

14.3 Landscape disruption

Overview on factors of disruption

14.4 Industry risks

Impact of key risks on business

15. Competitive Analysis

15.1 Companies profiled

Companies covered

15.2 Company ranking index

15.3 Market positioning of companies

Matrix on companies position and classification

15.4 Ally Spaces

Ally Spaces - Overview
Ally Spaces - Product / Service
Ally Spaces - Key offerings
SWOT

15.5 Awfis Space Solutions Ltd.

Awfis Space Solutions Ltd. - Overview
Awfis Space Solutions Ltd. - Product / Service
Awfis Space Solutions Ltd. - Key offerings
SWOT

15.6 CBRE Group Inc.

CBRE Group Inc. - Overview
CBRE Group Inc. - Business segments
CBRE Group Inc. - Key offerings
CBRE Group Inc. - Segment focus
SWOT

15.7 Incuspaze Solutions Pvt Ltd.

Incuspaze Solutions Pvt Ltd. - Overview
Incuspaze Solutions Pvt Ltd. - Product / Service
Incuspaze Solutions Pvt Ltd. - Key offerings
SWOT

15.8 Industrious

Industrious - Overview
Industrious - Product / Service
Industrious - Key offerings
SWOT

15.9 International Workplace Group plc

International Workplace Group plc - Overview
International Workplace Group plc - Product / Service
International Workplace Group plc - Key offerings
SWOT

15.10 Mindspace Ltd.

Mindspace Ltd. - Overview
Mindspace Ltd. - Product / Service
Mindspace Ltd. - Key offerings
SWOT

15.11 Serendipity Labs

Serendipity Labs - Overview
Serendipity Labs - Product / Service
Serendipity Labs - Key offerings
SWOT

15.12 Servcorp Ltd.

Servcorp Ltd. - Overview
Servcorp Ltd. - Product / Service
Servcorp Ltd. - Key offerings
SWOT

15.13 Techspace Group Ltd.

Techspace Group Ltd. - Overview
Techspace Group Ltd. - Product / Service
Techspace Group Ltd. - Key offerings
SWOT

15.14 The Office Group

The Office Group - Overview
The Office Group - Product / Service
The Office Group - Key offerings
SWOT

15.15 United Franchise Group

United Franchise Group - Overview
United Franchise Group - Product / Service
United Franchise Group - Key offerings
SWOT

15.16 Vast Coworking Group

Vast Coworking Group - Overview
Vast Coworking Group - Product / Service
Vast Coworking Group - Key offerings
SWOT

15.17 WeWork Inc.

WeWork Inc. - Overview
WeWork Inc. - Product / Service
WeWork Inc. - Key offerings
SWOT

15.18 Workbar

Workbar - Overview
Workbar - Product / Service
Workbar - Key offerings
SWOT

16. Appendix

16.1 Scope of the report

Market definition
Objectives
Notes and caveats

16.2 Inclusions and exclusions checklist

Inclusions checklist
Exclusions checklist

16.3 Currency conversion rates for US$

16.4 Research methodology

16.5 Data procurement

Information sources

16.6 Data validation

16.7 Validation techniques employed for market sizing

16.8 Data synthesis

16.9 360 degree market analysis

16.10 List of abbreviations

Research Methodology

Technavio presents a detailed picture of the market by way of study, synthesis, and summation of data from multiple sources. The analysts have presented the various facets of the market with a particular focus on identifying the key industry influencers. The data thus presented is comprehensive, reliable, and the result of extensive research, both primary and secondary.

INFORMATION SOURCES

Primary sources

  • Manufacturers and suppliers
  • Channel partners
  • Industry experts
  • Strategic decision makers

Secondary sources

  • Industry journals and periodicals
  • Government data
  • Financial reports of key industry players
  • Historical data
  • Press releases

DATA ANALYSIS

Data Synthesis

  • Collation of data
  • Estimation of key figures
  • Analysis of derived insights

Data Validation

  • Triangulation with data models
  • Reference against proprietary databases
  • Corroboration with industry experts

REPORT WRITING

Qualitative

  • Market drivers
  • Market challenges
  • Market trends
  • Five forces analysis

Quantitative

  • Market size and forecast
  • Market segmentation
  • Geographical insights
  • Competitive landscape

Interested in this report?

Get your sample now to see our research methodology and insights!

Download Now

Frequently Asked Questions

Flexible Office market growth will increase by USD 34207.1 million during 2026-2030.

The Flexible Office market is expected to grow at a CAGR of 9.4% during 2026-2030.

Flexible Office market is segmented by Type (Coworking spaces, Served offices, Virtual offices, Hybrid spaces) End-user (IT, BFSI, Retail and consumer, Others) Organization size (Large enterprise, SMEs, Startups)

Ally Spaces, Awfis Space Solutions Ltd., BizSpace Ltd., Bond Collective, CBRE Group Inc., Hub Australia Pty Ltd, Incuspaze Solutions Pvt Ltd., Industrious, International Workplace Group plc, Mindspace Ltd., Premier Office Centers LLC, Serendipity Labs, Servcorp Ltd., Techspace Group Ltd., The Office Group, United Franchise Group, Vast Coworking Group, WeWork Inc., Workbar are a few of the key vendors in the Flexible Office market.

APAC will register the highest growth rate of 39.9% among the other regions. Therefore, the Flexible Office market in APAC is expected to garner significant business opportunities for the vendors during the forecast period.

China, Japan, India, South Korea, Indonesia, Australia, Germany, UK, France, Italy, Spain, The Netherlands, US, Canada, Mexico, Saudi Arabia, UAE, South Africa, Israel, Turkey, Brazil, Argentina, Colombia

  • Rise in shift towards remote and hybrid modes of work is the driving factor this market.

The Flexible Office market vendors should focus on grabbing business opportunities from the Type segment as it accounted for the largest market share in the base year.