Fitness And Recreational Sports Centers Market Analysis, Size, and Forecast 2026-2030: North America (US, Canada, and Mexico), APAC (China, India, and Japan), Europe (Germany, UK, and Spain), Middle East and Africa (UAE, Saudi Arabia, and South Africa), South America (Brazil, Argentina, and Colombia), and Rest of World (ROW)

Fitness And Recreational Sports Centers Market Analysis, Size, and Forecast 2026-2030:
North America (US, Canada, and Mexico), APAC (China, India, and Japan), Europe (Germany, UK, and Spain), Middle East and Africa (UAE, Saudi Arabia, and South Africa), South America (Brazil, Argentina, and Colombia), and Rest of World (ROW)

Published: Mar 2026 290 Pages SKU: IRTNTR72398

Market Overview at a Glance

$107.16 B
Market Opportunity
9.2%
CAGR 2025 - 2030
39.5%
North America Growth
$109.23 B
Men segment 2024

Fitness And Recreational Sports Centers Market Size 2026-2030

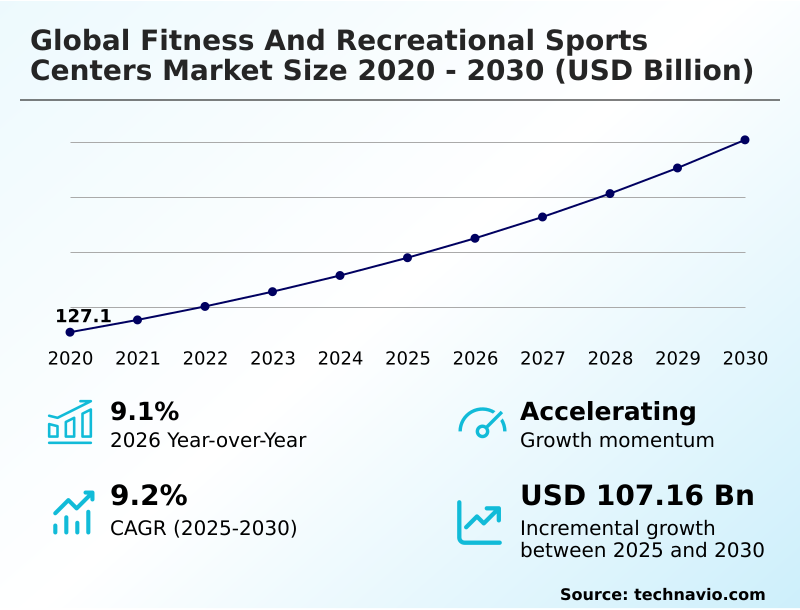
The fitness and recreational sports centers market size is valued to increase by USD 107.16 billion, at a CAGR of 9.2% from 2025 to 2030. Growing health and wellness awareness driving memberships will drive the fitness and recreational sports centers market.

Major Market Trends & Insights

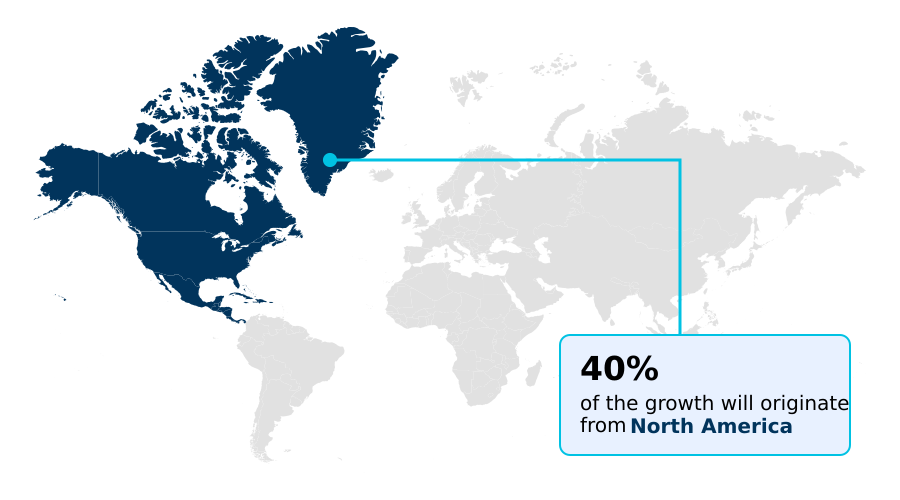
  • North America dominated the market and accounted for a 39.5% growth during the forecast period.
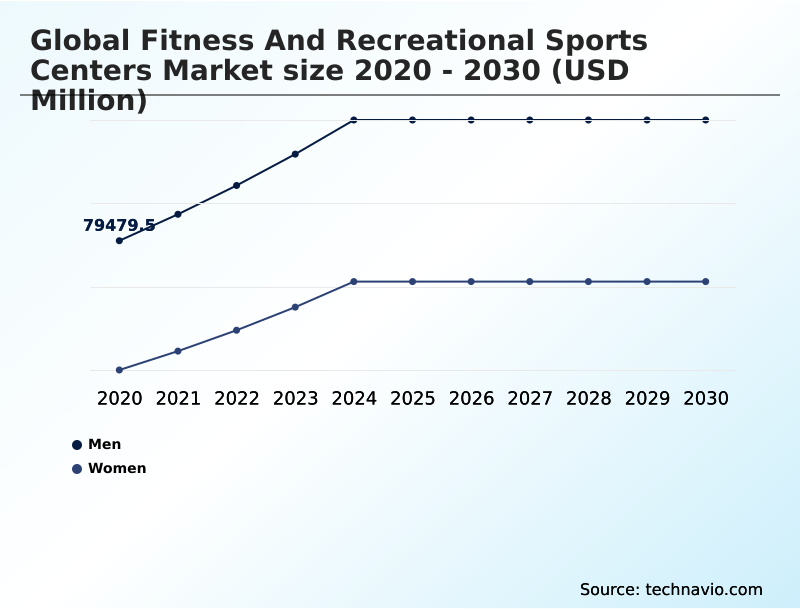
  • By End-user - Men segment was valued at USD 109.23 billion in 2024
  • By Age Group - 35 and younger segment accounted for the largest market revenue share in 2024

Market Size & Forecast

  • Market Opportunities: USD 174.85 billion
  • Market Future Opportunities: USD 107.16 billion
  • CAGR from 2025 to 2030 : 9.2%

Market Summary

  • The fitness and recreational sports centers market is undergoing a significant transformation, moving beyond conventional gym models to become comprehensive wellness destinations. This evolution is driven by a heightened consumer focus on holistic health, encompassing mental well-being alongside physical fitness.
  • Facilities are increasingly integrating specialized services such as mind-body disciplines, advanced recovery therapies, and personalized nutritional counseling to meet these demands. The rise of digital health platforms and wearable technology integration allows for unprecedented data-driven personalization of workout regimens.
  • For instance, a facility can leverage AI-driven fitness tracking data to optimize class schedules and equipment availability in real-time, reducing member wait times by up to 25% and improving operational efficiency. However, this progress is met with challenges, including the high operational costs of continuous technological upgrades and intense competition from hybrid fitness models.
  • Success in this evolving landscape requires a strategic balance between offering cutting-edge, personalized experiences and maintaining accessible, community-centric environments that foster long-term member loyalty.

What will be the Size of the Fitness And Recreational Sports Centers Market during the forecast period?

Get Key Insights on Market Forecast (PDF) Request Free Sample

How is the Fitness And Recreational Sports Centers Market Segmented?

The fitness and recreational sports centers industry research report provides comprehensive data (region-wise segment analysis), with forecasts and estimates in "USD million" for the period 2026-2030, as well as historical data from 2020-2024 for the following segments.

  • End-user
    • Men
    • Women
  • Age group
    • 35 and younger
    • 35-54
    • 55 and older
  • Service type
    • Gym and fitness centers
    • Sports clubs
    • Yoga and pilates studios
    • Others
  • Geography
    • North America
      • US
      • Canada
      • Mexico
    • APAC
      • China
      • India
      • Japan
    • Europe
      • Germany
      • UK
      • Spain
    • Middle East and Africa
      • UAE
      • Saudi Arabia
      • South Africa
    • South America
      • Brazil
      • Argentina
      • Colombia
    • Rest of World (ROW)

By End-user Insights

The men segment is estimated to witness significant growth during the forecast period.

The men's segment is evolving beyond traditional weightlifting, driven by a demand for data-driven performance metrics and community-based fitness. This demographic increasingly seeks facilities offering high-intensity interval training (HIIT) and advanced recovery therapies.

Operators observe that the adoption of wearable technology integration for performance tracking has boosted member engagement by over 15%.

A focus on longevity and biological optimization is a primary driver for middle-aged participants, fueling investment in premium memberships that include preventative health solutions.

The appeal of community-centric environments and professional coaching services remains a critical factor, compelling centers to offer specialized functional fitness programs and athletic resorts that cater to these specific wellness goals, ensuring high retention within this key end-user group.

Request Free Sample

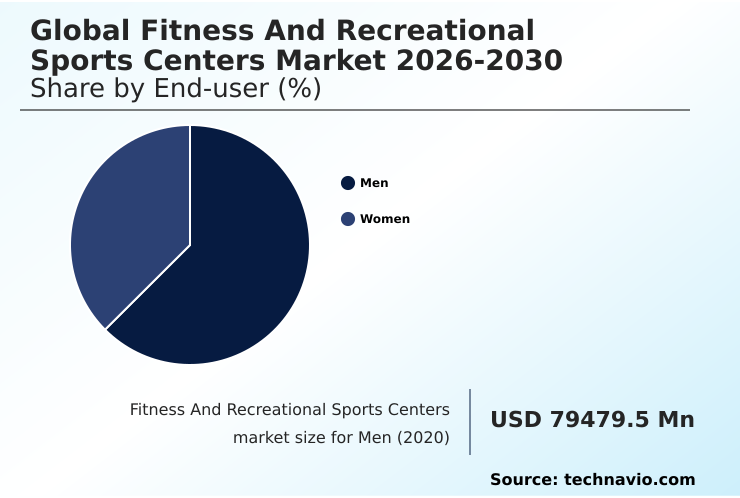
The Men segment was valued at USD 109.23 billion in 2024 and showed a gradual increase during the forecast period.

Request Free Sample

Regional Analysis

North America is estimated to contribute 39.5% to the growth of the global market during the forecast period.Technavio’s analysts have elaborately explained the regional trends and drivers that shape the market during the forecast period.

See How Fitness And Recreational Sports Centers Market Demand is Rising in North America Request Free Sample

The geographic landscape of the fitness and recreational sports centers market is characterized by varied maturity and growth dynamics.

North America remains a dominant force, projected to account for 39% of the market's incremental growth, driven by a robust infrastructure of athletic resorts and high adoption of digital health platforms.

Meanwhile, the APAC region is forecast to exhibit the fastest expansion, with a growth rate approaching 10%, fueled by rising health and wellness awareness and government-led corporate wellness initiatives in countries like China and India.

Europe showcases a sophisticated market with a strong emphasis on sustainable facility design and boutique fitness studios.

The high concentration of certified fitness professionals in developed regions enhances service quality, while franchise-based gym expansion drives growth in emerging economies across South America and the Middle East and Africa.

Market Dynamics

Our researchers analyzed the data with 2025 as the base year, along with the key drivers, trends, and challenges. A holistic analysis of drivers will help companies refine their marketing strategies to gain a competitive advantage.

  • Analyzing the fitness and recreational sports centers market reveals a complex interplay between technology, service models, and consumer expectations. Strategic decisions now revolve around the impact of VR workouts on member retention and the roi of digital health platform integration.
  • The integration of holistic wellness in fitness centers has become a key differentiator, compelling operators to evaluate the cost-benefit of functional training zones and advanced recovery therapies in athletic resorts. Technology for personalized fitness programming is central, with a focus on AI fitness tracking for user engagement and the challenges of biometric data integration.
  • Businesses are also exploring how to develop effective corporate wellness partnerships and implement strategies to reduce high member churn. The role of boutique studios in market growth continues to expand, driven by specialized offerings like hiit programming for diverse demographics and a rising demand for mind-body disciplines in gyms.
  • Simultaneously, operators are assessing the growth of racquet sports facility investment and the operating costs of modern aquatic centers. Business model innovation is evident in the rising popularity of pay-as-you-go gym membership trends, which cater to consumer demand for flexibility.
  • Facilities that successfully design community-centric fitness environments and offer robust preventative health solutions, sometimes incorporating medical diagnostic tools in fitness centers, report member satisfaction scores nearly double those of traditional gyms, underscoring a clear shift in market priorities.

What are the key market drivers leading to the rise in the adoption of Fitness And Recreational Sports Centers Industry?

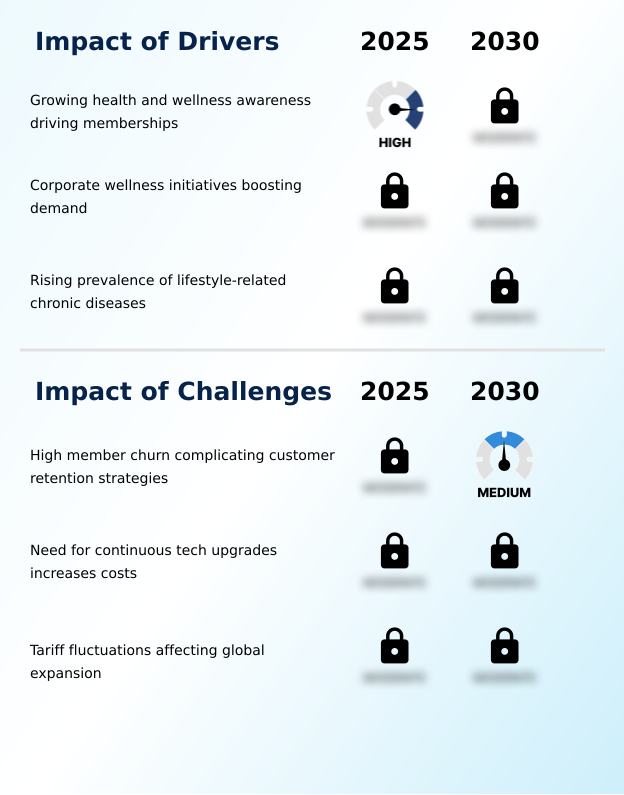
  • The primary market driver is the growing consumer awareness of health and wellness, which is directly fueling membership growth across facilities.

  • Market growth is fundamentally propelled by rising health and wellness awareness and the increasing prevalence of lifestyle-related diseases. Corporate wellness initiatives that subsidize gym access have proven highly effective, boosting employee participation by over 50% in partner companies.
  • This B2B approach creates a stable revenue stream for facilities offering professional coaching services.
  • Simultaneously, the demand for preventative health solutions has intensified, with personalized training plans and data-driven fitness programs helping partner insurance firms reduce long-term healthcare claims by 10%.
  • This integration of fitness into the broader healthcare ecosystem, supported by digital health platforms, positions fitness centers as essential service providers, driving both membership and strategic partnerships across various age-specific fitness programs.

What are the market trends shaping the Fitness And Recreational Sports Centers Industry?

  • The integration of virtual and augmented reality for immersive workouts represents a significant emerging trend, reshaping mainstream fitness experiences.

  • The market is defined by a significant shift toward technology-driven, experiential fitness. The integration of immersive virtual reality fitness and gamified fitness sessions is transforming workouts into engaging events, leading to a 40% increase in user participation in some boutique fitness studios.
  • This trend is complemented by the expansion of holistic wellness services, including mind-body disciplines, which help facilities achieve a 15% higher average revenue per member. Sustainable facility design is also gaining traction as a key differentiator. Furthermore, the rise of functional fitness programs and dedicated strength-training zones reflects a consumer focus on performance-based training.
  • These technology-centric and wellness-oriented shifts are reshaping business models and creating new opportunities for growth and member engagement.

What challenges does the Fitness And Recreational Sports Centers Industry face during its growth?

  • A primary challenge impacting industry growth is high member churn, which complicates the implementation of effective customer retention strategies.

  • Operators face significant financial and operational hurdles that temper market growth. The necessity for continuous technological upgrades, including AI-driven fitness tracking and other tools for data-driven personalization, has increased capital expenditures by nearly 20% in the last two years.
  • This financial pressure is compounded by persistently high member churn, with some facilities experiencing annual attrition rates exceeding 35% despite investing in member retention strategies. This volatility complicates revenue forecasting and limits profitability.
  • Furthermore, competition from flexible hybrid fitness models and an array of low-impact exercise options available online challenges the value proposition of traditional, physical-first centers, demanding constant innovation to maintain market share.

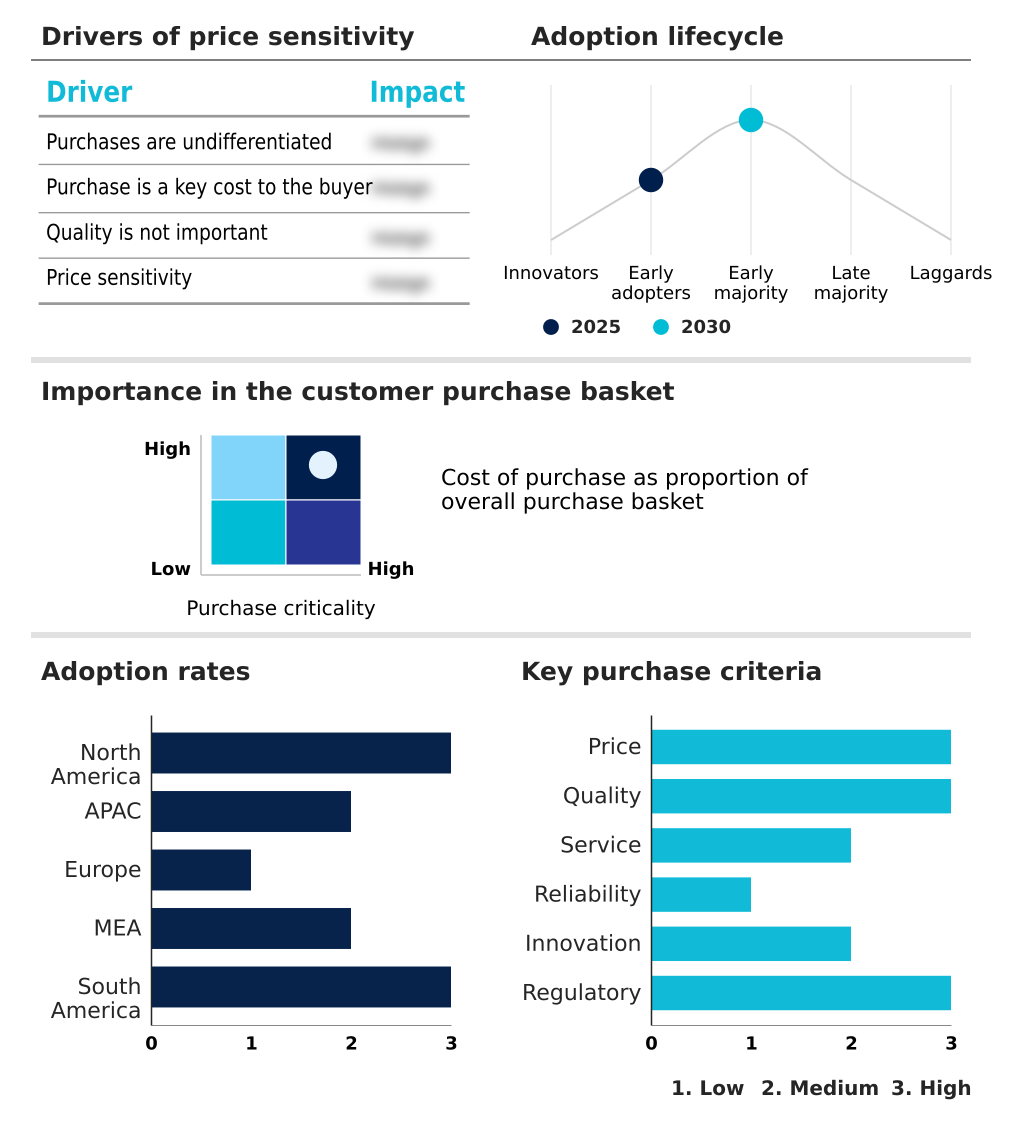
Exclusive Technavio Analysis on Customer Landscape

The fitness and recreational sports centers market forecasting report includes the adoption lifecycle of the market, covering from the innovator’s stage to the laggard’s stage. It focuses on adoption rates in different regions based on penetration. Furthermore, the fitness and recreational sports centers market report also includes key purchase criteria and drivers of price sensitivity to help companies evaluate and develop their market growth analysis strategies.

Customer Landscape of Fitness And Recreational Sports Centers Industry

Competitive Landscape

Companies are implementing various strategies, such as strategic alliances, fitness and recreational sports centers market forecast, partnerships, mergers and acquisitions, geographical expansion, and product/service launches, to enhance their presence in the industry.

24 Hour Fitness USA LLC - Key solutions encompass full-service gymnasiums, diverse group classes, aquatic facilities, and personalized training, addressing comprehensive fitness needs across member segments.

The industry research and growth report includes detailed analyses of the competitive landscape of the market and information about key companies, including:

  • 24 Hour Fitness USA LLC
  • Anytime Fitness Franchisor LLC
  • Barrys
  • Crunch LLC
  • Curves NA Inc.
  • David Lloyd Leisure Ltd.
  • Equinox Holdings Inc.
  • FIT House of Brands
  • Golds Gym Club Holding LLC
  • Life Time Inc.
  • Planet Fitness Inc.
  • RSG Group GmbH
  • Snap Fitness Inc
  • SoulCycle
  • The Gym Group
  • Ultimate Fitness Group LLC
  • Virgin Active Ltd.
  • YouFit Gyms

Qualitative and quantitative analysis of companies has been conducted to help clients understand the wider business environment as well as the strengths and weaknesses of key industry players. Data is qualitatively analyzed to categorize companies as pure play, category-focused, industry-focused, and diversified; it is quantitatively analyzed to categorize companies as dominant, leading, strong, tentative, and weak.

Recent Development and News in Fitness and recreational sports centers market

  • In August 2024, Innovatech launched its BioSync biometric integration platform, allowing gym members to sync real-time metabolic data with facility equipment to automatically customize resistance levels.
  • In November 2024, Global PharmaCo, in collaboration with the Boutique Fitness Alliance, launched the Cycle-Syncing Initiative, a program that aligns exercise intensity with the physiological phases of the female menstrual cycle.
  • In May 2025, Prestige Hospitality Group announced a strategic partnership with Wellness Diagnostics Inc. to integrate medical-grade diagnostic screenings into its luxury fitness centers, catering to growing interest in preventative health.
  • In April 2025, Vitality Health and FitCorp introduced a groundbreaking collaboration allowing medical professionals to prescribe gym memberships as part of chronic disease management protocols.

Dive into Technavio’s robust research methodology, blending expert interviews, extensive data synthesis, and validated models for unparalleled Fitness And Recreational Sports Centers Market insights. See full methodology.

Market Scope
Page number 290
Base year 2025
Historic period 2020-2024
Forecast period 2026-2030
Growth momentum & CAGR Accelerate at a CAGR of 9.2%
Market growth 2026-2030 USD 107161.8 million
Market structure Fragmented
YoY growth 2025-2026(%) 9.1%
Key countries US, Canada, Mexico, China, India, Japan, South Korea, Australia, Indonesia, Germany, UK, Spain, France, Italy, The Netherlands, UAE, Saudi Arabia, South Africa, Israel, Turkey, Brazil, Argentina and Colombia
Competitive landscape Leading Companies, Market Positioning of Companies, Competitive Strategies, and Industry Risks

Request Free Sample

Research Analyst Overview

  • The fitness and recreational sports centers market is rapidly advancing from traditional exercise facilities to high-tech wellness ecosystems. This evolution is defined by the convergence of immersive virtual reality fitness, gamified fitness sessions, and comprehensive holistic wellness services. Leading facilities are distinguished by their dedicated strength-training zones and advanced functional fitness programs, which are enhanced by wearable technology integration.
  • The core of this transformation is data-driven personalization, enabled by AI-driven fitness tracking and biometric data integration, which allows for highly specific personalized training plans. Boardroom decisions are increasingly influenced by this data, guiding capital expenditure toward new recovery therapies and medical-grade diagnostic tools over simple facility expansion.
  • Operators are adopting hybrid fitness models and pay-as-you-go membership options to improve member retention strategies. The market includes a diverse range of players, from luxury athletic resorts and aquatic centers to specialized boutique fitness studios offering high-intensity interval training (HIIT) and mind-body disciplines.
  • These trends are supported by corporate wellness initiatives and a broader consumer shift toward preventative health solutions, solidifying the industry's role in modern healthcare. The integration of such technologies has been shown to reduce member attrition by over 25% within the initial months of adoption.

What are the Key Data Covered in this Fitness And Recreational Sports Centers Market Research and Growth Report?

  • What is the expected growth of the Fitness And Recreational Sports Centers Market between 2026 and 2030?

    • USD 107.16 billion, at a CAGR of 9.2%

  • What segmentation does the market report cover?

    • The report is segmented by End-user (Men, and Women), Age Group (35 and younger, 35-54, and 55 and older), Service Type (Gym and fitness centers, Sports clubs, Yoga and pilates studios, and Others) and Geography (North America, APAC, Europe, Middle East and Africa, South America)

  • Which regions are analyzed in the report?

    • North America, APAC, Europe, Middle East and Africa and South America

  • What are the key growth drivers and market challenges?

    • Growing health and wellness awareness driving memberships, High member churn complicating customer retention strategies

  • Who are the major players in the Fitness And Recreational Sports Centers Market?

    • 24 Hour Fitness USA LLC, Anytime Fitness Franchisor LLC, Barrys, Crunch LLC, Curves NA Inc., David Lloyd Leisure Ltd., Equinox Holdings Inc., FIT House of Brands, Golds Gym Club Holding LLC, Life Time Inc., Planet Fitness Inc., RSG Group GmbH, Snap Fitness Inc, SoulCycle, The Gym Group, Ultimate Fitness Group LLC, Virgin Active Ltd. and YouFit Gyms

Market Research Insights

  • The market's dynamism is driven by a strategic shift toward experiential fitness and customer-centric service models. Facilities implementing data-driven member engagement initiatives report up to a 20% improvement in retention rates. Moreover, public-private fitness partnerships have expanded access to professional coaching services, increasing community participation by over 30% in targeted urban areas.
  • The growth of franchise-based gym expansion into underserved regions is broadening market reach, while luxury wellness hubs are setting new standards for premium service. This environment, supported by flexible payment options and online booking systems, caters to modern consumer demands for convenience and personalization, fostering sustained industry momentum. Sustainable facility design and inclusive fitness programming are also becoming key differentiators.

We can help! Our analysts can customize this fitness and recreational sports centers market research report to meet your requirements.

Get in touch

1. Executive Summary

1.1 Market overview

Executive Summary - Chart on Market Overview
Executive Summary - Data Table on Market Overview
Executive Summary - Chart on Global Market Characteristics
Executive Summary - Chart on Market by Geography
Executive Summary - Chart on Market Segmentation by End-user
Executive Summary - Chart on Market Segmentation by Age Group
Executive Summary - Chart on Market Segmentation by Service Type
Executive Summary - Chart on Incremental Growth
Executive Summary - Data Table on Incremental Growth
Executive Summary - Chart on Company Market Positioning

2. Technavio Analysis

2.1 Analysis of price sensitivity, lifecycle, customer purchase basket, adoption rates, and purchase criteria

2.2 Criticality of inputs and Factors of differentiation

Chart on Overview on criticality of inputs and factors of differentiation

2.3 Factors of disruption

Chart on Overview on factors of disruption

2.4 Impact of drivers and challenges

Chart on Impact of drivers and challenges in 2025 and 2030

3. Market Landscape

3.1 Market ecosystem

Chart on Parent Market
Data Table on - Parent Market

3.2 Market characteristics

Chart on Market characteristics analysis

3.3 Value chain analysis

Chart on Value chain analysis

4. Market Sizing

4.1 Market definition

Data Table on Offerings of companies included in the market definition

4.2 Market segment analysis

Market segments

4.3 Market size 2025

4.4 Market outlook: Forecast for 2025-2030

Chart on Global - Market size and forecast 2025-2030 ($ million)
Data Table on Global - Market size and forecast 2025-2030 ($ million)
Chart on Global Market: Year-over-year growth 2025-2030 (%)
Data Table on Global Market: Year-over-year growth 2025-2030 (%)

5. Historic Market Size

5.1 Global Fitness And Recreational Sports Centers Market 2020 - 2024

Historic Market Size - Data Table on Global Fitness And Recreational Sports Centers Market 2020 - 2024 ($ million)

5.2 End-user segment analysis 2020 - 2024

Historic Market Size - End-user Segment 2020 - 2024 ($ million)

5.3 Age Group segment analysis 2020 - 2024

Historic Market Size - Age Group Segment 2020 - 2024 ($ million)

5.4 Service Type segment analysis 2020 - 2024

Historic Market Size - Service Type Segment 2020 - 2024 ($ million)

5.5 Geography segment analysis 2020 - 2024

Historic Market Size - Geography Segment 2020 - 2024 ($ million)

5.6 Country segment analysis 2020 - 2024

Historic Market Size - Country Segment 2020 - 2024 ($ million)

6. Qualitative Analysis

6.1 The impact of AI on Global Fitness and Recreational Sports Centers Market

7. Five Forces Analysis

7.1 Five forces summary

Five forces analysis - Comparison between 2025 and 2030

7.2 Bargaining power of buyers

Bargaining power of buyers - Impact of key factors 2025 and 2030

7.3 Bargaining power of suppliers

Bargaining power of suppliers - Impact of key factors in 2025 and 2030

7.4 Threat of new entrants

Threat of new entrants - Impact of key factors in 2025 and 2030

7.5 Threat of substitutes

Threat of substitutes - Impact of key factors in 2025 and 2030

7.6 Threat of rivalry

Threat of rivalry - Impact of key factors in 2025 and 2030

7.7 Market condition

Chart on Market condition - Five forces 2025 and 2030

8. Market Segmentation by End-user

8.1 Market segments

Chart on End-user - Market share 2025-2030 (%)
Data Table on End-user - Market share 2025-2030 (%)

8.2 Comparison by End-user

Chart on Comparison by End-user
Data Table on Comparison by End-user

8.3 Men - Market size and forecast 2025-2030

Chart on Men - Market size and forecast 2025-2030 ($ million)
Data Table on Men - Market size and forecast 2025-2030 ($ million)
Chart on Men - Year-over-year growth 2025-2030 (%)
Data Table on Men - Year-over-year growth 2025-2030 (%)

8.4 Women - Market size and forecast 2025-2030

Chart on Women - Market size and forecast 2025-2030 ($ million)
Data Table on Women - Market size and forecast 2025-2030 ($ million)
Chart on Women - Year-over-year growth 2025-2030 (%)
Data Table on Women - Year-over-year growth 2025-2030 (%)

8.5 Market opportunity by End-user

Market opportunity by End-user ($ million)
Data Table on Market opportunity by End-user ($ million)

9. Market Segmentation by Age Group

9.1 Market segments

Chart on Age Group - Market share 2025-2030 (%)
Data Table on Age Group - Market share 2025-2030 (%)

9.2 Comparison by Age Group

Chart on Comparison by Age Group
Data Table on Comparison by Age Group

9.3 35 and younger - Market size and forecast 2025-2030

Chart on 35 and younger - Market size and forecast 2025-2030 ($ million)
Data Table on 35 and younger - Market size and forecast 2025-2030 ($ million)
Chart on 35 and younger - Year-over-year growth 2025-2030 (%)
Data Table on 35 and younger - Year-over-year growth 2025-2030 (%)

9.4 35-54 - Market size and forecast 2025-2030

Chart on 35-54 - Market size and forecast 2025-2030 ($ million)
Data Table on 35-54 - Market size and forecast 2025-2030 ($ million)
Chart on 35-54 - Year-over-year growth 2025-2030 (%)
Data Table on 35-54 - Year-over-year growth 2025-2030 (%)

9.5 55 and older - Market size and forecast 2025-2030

Chart on 55 and older - Market size and forecast 2025-2030 ($ million)
Data Table on 55 and older - Market size and forecast 2025-2030 ($ million)
Chart on 55 and older - Year-over-year growth 2025-2030 (%)
Data Table on 55 and older - Year-over-year growth 2025-2030 (%)

9.6 Market opportunity by Age Group

Market opportunity by Age Group ($ million)
Data Table on Market opportunity by Age Group ($ million)

10. Market Segmentation by Service Type

10.1 Market segments

Chart on Service Type - Market share 2025-2030 (%)
Data Table on Service Type - Market share 2025-2030 (%)

10.2 Comparison by Service Type

Chart on Comparison by Service Type
Data Table on Comparison by Service Type

10.3 Gym and fitness centers - Market size and forecast 2025-2030

Chart on Gym and fitness centers - Market size and forecast 2025-2030 ($ million)
Data Table on Gym and fitness centers - Market size and forecast 2025-2030 ($ million)
Chart on Gym and fitness centers - Year-over-year growth 2025-2030 (%)
Data Table on Gym and fitness centers - Year-over-year growth 2025-2030 (%)

10.4 Sports clubs - Market size and forecast 2025-2030

Chart on Sports clubs - Market size and forecast 2025-2030 ($ million)
Data Table on Sports clubs - Market size and forecast 2025-2030 ($ million)
Chart on Sports clubs - Year-over-year growth 2025-2030 (%)
Data Table on Sports clubs - Year-over-year growth 2025-2030 (%)

10.5 Yoga and pilates studios - Market size and forecast 2025-2030

Chart on Yoga and pilates studios - Market size and forecast 2025-2030 ($ million)
Data Table on Yoga and pilates studios - Market size and forecast 2025-2030 ($ million)
Chart on Yoga and pilates studios - Year-over-year growth 2025-2030 (%)
Data Table on Yoga and pilates studios - Year-over-year growth 2025-2030 (%)

10.6 Others - Market size and forecast 2025-2030

Chart on Others - Market size and forecast 2025-2030 ($ million)
Data Table on Others - Market size and forecast 2025-2030 ($ million)
Chart on Others - Year-over-year growth 2025-2030 (%)
Data Table on Others - Year-over-year growth 2025-2030 (%)

10.7 Market opportunity by Service Type

Market opportunity by Service Type ($ million)
Data Table on Market opportunity by Service Type ($ million)

11. Customer Landscape

11.1 Customer landscape overview

Analysis of price sensitivity, lifecycle, customer purchase basket, adoption rates, and purchase criteria

12. Geographic Landscape

12.1 Geographic segmentation

Chart on Market share by geography 2025-2030 (%)
Data Table on Market share by geography 2025-2030 (%)

12.2 Geographic comparison

Chart on Geographic comparison
Data Table on Geographic comparison

12.3 North America - Market size and forecast 2025-2030

Chart on North America - Market size and forecast 2025-2030 ($ million)
Data Table on North America - Market size and forecast 2025-2030 ($ million)
Chart on North America - Year-over-year growth 2025-2030 (%)
Data Table on North America - Year-over-year growth 2025-2030 (%)
Chart on Regional Comparison - North America
Data Table on Regional Comparison - North America

12.3.1 US - Market size and forecast 2025-2030

Chart on US - Market size and forecast 2025-2030 ($ million)
Data Table on US - Market size and forecast 2025-2030 ($ million)
Chart on US - Year-over-year growth 2025-2030 (%)
Data Table on US - Year-over-year growth 2025-2030 (%)

12.3.2 Canada - Market size and forecast 2025-2030

Chart on Canada - Market size and forecast 2025-2030 ($ million)
Data Table on Canada - Market size and forecast 2025-2030 ($ million)
Chart on Canada - Year-over-year growth 2025-2030 (%)
Data Table on Canada - Year-over-year growth 2025-2030 (%)

12.3.3 Mexico - Market size and forecast 2025-2030

Chart on Mexico - Market size and forecast 2025-2030 ($ million)
Data Table on Mexico - Market size and forecast 2025-2030 ($ million)
Chart on Mexico - Year-over-year growth 2025-2030 (%)
Data Table on Mexico - Year-over-year growth 2025-2030 (%)

12.4 APAC - Market size and forecast 2025-2030

Chart on APAC - Market size and forecast 2025-2030 ($ million)
Data Table on APAC - Market size and forecast 2025-2030 ($ million)
Chart on APAC - Year-over-year growth 2025-2030 (%)
Data Table on APAC - Year-over-year growth 2025-2030 (%)
Chart on Regional Comparison - APAC
Data Table on Regional Comparison - APAC

12.4.1 China - Market size and forecast 2025-2030

Chart on China - Market size and forecast 2025-2030 ($ million)
Data Table on China - Market size and forecast 2025-2030 ($ million)
Chart on China - Year-over-year growth 2025-2030 (%)
Data Table on China - Year-over-year growth 2025-2030 (%)

12.4.2 India - Market size and forecast 2025-2030

Chart on India - Market size and forecast 2025-2030 ($ million)
Data Table on India - Market size and forecast 2025-2030 ($ million)
Chart on India - Year-over-year growth 2025-2030 (%)
Data Table on India - Year-over-year growth 2025-2030 (%)

12.4.3 Japan - Market size and forecast 2025-2030

Chart on Japan - Market size and forecast 2025-2030 ($ million)
Data Table on Japan - Market size and forecast 2025-2030 ($ million)
Chart on Japan - Year-over-year growth 2025-2030 (%)
Data Table on Japan - Year-over-year growth 2025-2030 (%)

12.4.4 South Korea - Market size and forecast 2025-2030

Chart on South Korea - Market size and forecast 2025-2030 ($ million)
Data Table on South Korea - Market size and forecast 2025-2030 ($ million)
Chart on South Korea - Year-over-year growth 2025-2030 (%)
Data Table on South Korea - Year-over-year growth 2025-2030 (%)

12.4.5 Australia - Market size and forecast 2025-2030

Chart on Australia - Market size and forecast 2025-2030 ($ million)
Data Table on Australia - Market size and forecast 2025-2030 ($ million)
Chart on Australia - Year-over-year growth 2025-2030 (%)
Data Table on Australia - Year-over-year growth 2025-2030 (%)

12.4.6 Indonesia - Market size and forecast 2025-2030

Chart on Indonesia - Market size and forecast 2025-2030 ($ million)
Data Table on Indonesia - Market size and forecast 2025-2030 ($ million)
Chart on Indonesia - Year-over-year growth 2025-2030 (%)
Data Table on Indonesia - Year-over-year growth 2025-2030 (%)

12.5 Europe - Market size and forecast 2025-2030

Chart on Europe - Market size and forecast 2025-2030 ($ million)
Data Table on Europe - Market size and forecast 2025-2030 ($ million)
Chart on Europe - Year-over-year growth 2025-2030 (%)
Data Table on Europe - Year-over-year growth 2025-2030 (%)
Chart on Regional Comparison - Europe
Data Table on Regional Comparison - Europe

12.5.1 Germany - Market size and forecast 2025-2030

Chart on Germany - Market size and forecast 2025-2030 ($ million)
Data Table on Germany - Market size and forecast 2025-2030 ($ million)
Chart on Germany - Year-over-year growth 2025-2030 (%)
Data Table on Germany - Year-over-year growth 2025-2030 (%)

12.5.2 UK - Market size and forecast 2025-2030

Chart on UK - Market size and forecast 2025-2030 ($ million)
Data Table on UK - Market size and forecast 2025-2030 ($ million)
Chart on UK - Year-over-year growth 2025-2030 (%)
Data Table on UK - Year-over-year growth 2025-2030 (%)

12.5.3 Spain - Market size and forecast 2025-2030

Chart on Spain - Market size and forecast 2025-2030 ($ million)
Data Table on Spain - Market size and forecast 2025-2030 ($ million)
Chart on Spain - Year-over-year growth 2025-2030 (%)
Data Table on Spain - Year-over-year growth 2025-2030 (%)

12.5.4 France - Market size and forecast 2025-2030

Chart on France - Market size and forecast 2025-2030 ($ million)
Data Table on France - Market size and forecast 2025-2030 ($ million)
Chart on France - Year-over-year growth 2025-2030 (%)
Data Table on France - Year-over-year growth 2025-2030 (%)

12.5.5 Italy - Market size and forecast 2025-2030

Chart on Italy - Market size and forecast 2025-2030 ($ million)
Data Table on Italy - Market size and forecast 2025-2030 ($ million)
Chart on Italy - Year-over-year growth 2025-2030 (%)
Data Table on Italy - Year-over-year growth 2025-2030 (%)

12.5.6 The Netherlands - Market size and forecast 2025-2030

Chart on The Netherlands - Market size and forecast 2025-2030 ($ million)
Data Table on The Netherlands - Market size and forecast 2025-2030 ($ million)
Chart on The Netherlands - Year-over-year growth 2025-2030 (%)
Data Table on The Netherlands - Year-over-year growth 2025-2030 (%)

12.6 Middle East and Africa - Market size and forecast 2025-2030

Chart on Middle East and Africa - Market size and forecast 2025-2030 ($ million)
Data Table on Middle East and Africa - Market size and forecast 2025-2030 ($ million)
Chart on Middle East and Africa - Year-over-year growth 2025-2030 (%)
Data Table on Middle East and Africa - Year-over-year growth 2025-2030 (%)
Chart on Regional Comparison - Middle East and Africa
Data Table on Regional Comparison - Middle East and Africa

12.6.1 UAE - Market size and forecast 2025-2030

Chart on UAE - Market size and forecast 2025-2030 ($ million)
Data Table on UAE - Market size and forecast 2025-2030 ($ million)
Chart on UAE - Year-over-year growth 2025-2030 (%)
Data Table on UAE - Year-over-year growth 2025-2030 (%)

12.6.2 Saudi Arabia - Market size and forecast 2025-2030

Chart on Saudi Arabia - Market size and forecast 2025-2030 ($ million)
Data Table on Saudi Arabia - Market size and forecast 2025-2030 ($ million)
Chart on Saudi Arabia - Year-over-year growth 2025-2030 (%)
Data Table on Saudi Arabia - Year-over-year growth 2025-2030 (%)

12.6.3 South Africa - Market size and forecast 2025-2030

Chart on South Africa - Market size and forecast 2025-2030 ($ million)
Data Table on South Africa - Market size and forecast 2025-2030 ($ million)
Chart on South Africa - Year-over-year growth 2025-2030 (%)
Data Table on South Africa - Year-over-year growth 2025-2030 (%)

12.6.4 Israel - Market size and forecast 2025-2030

Chart on Israel - Market size and forecast 2025-2030 ($ million)
Data Table on Israel - Market size and forecast 2025-2030 ($ million)
Chart on Israel - Year-over-year growth 2025-2030 (%)
Data Table on Israel - Year-over-year growth 2025-2030 (%)

12.6.5 Turkey - Market size and forecast 2025-2030

Chart on Turkey - Market size and forecast 2025-2030 ($ million)
Data Table on Turkey - Market size and forecast 2025-2030 ($ million)
Chart on Turkey - Year-over-year growth 2025-2030 (%)
Data Table on Turkey - Year-over-year growth 2025-2030 (%)

12.7 South America - Market size and forecast 2025-2030

Chart on South America - Market size and forecast 2025-2030 ($ million)
Data Table on South America - Market size and forecast 2025-2030 ($ million)
Chart on South America - Year-over-year growth 2025-2030 (%)
Data Table on South America - Year-over-year growth 2025-2030 (%)
Chart on Regional Comparison - South America
Data Table on Regional Comparison - South America

12.7.1 Brazil - Market size and forecast 2025-2030

Chart on Brazil - Market size and forecast 2025-2030 ($ million)
Data Table on Brazil - Market size and forecast 2025-2030 ($ million)
Chart on Brazil - Year-over-year growth 2025-2030 (%)
Data Table on Brazil - Year-over-year growth 2025-2030 (%)

12.7.2 Argentina - Market size and forecast 2025-2030

Chart on Argentina - Market size and forecast 2025-2030 ($ million)
Data Table on Argentina - Market size and forecast 2025-2030 ($ million)
Chart on Argentina - Year-over-year growth 2025-2030 (%)
Data Table on Argentina - Year-over-year growth 2025-2030 (%)

12.7.3 Colombia - Market size and forecast 2025-2030

Chart on Colombia - Market size and forecast 2025-2030 ($ million)
Data Table on Colombia - Market size and forecast 2025-2030 ($ million)
Chart on Colombia - Year-over-year growth 2025-2030 (%)
Data Table on Colombia - Year-over-year growth 2025-2030 (%)

12.8 Market opportunity by geography

Market opportunity by geography ($ million)
Data Tables on Market opportunity by geography ($ million)

13. Drivers, Challenges, and Opportunity

13.1 Market drivers

Growing health and wellness awareness driving memberships
Corporate wellness initiatives boosting demand
Rising prevalence of lifestyle‑related chronic diseases

13.2 Market challenges

High member churn complicating customer retention strategies
Need for continuous tech upgrades increases costs
Tariff fluctuations affecting global expansion

13.3 Impact of drivers and challenges

Impact of drivers and challenges in 2025 and 2030

13.4 Market opportunities

VR and AR immersive workouts entering mainstream fitness
Holistic wellness services accompanying traditional fitness
Strength‑training and functional zones becoming facility focus

14. Competitive Landscape

14.1 Overview

14.2

Overview on criticality of inputs and factors of differentiation

14.3 Landscape disruption

Overview on factors of disruption

14.4 Industry risks

Impact of key risks on business

15. Competitive Analysis

15.1 Companies profiled

Companies covered

15.2 Company ranking index

15.3 Market positioning of companies

Matrix on companies position and classification

15.4 24 Hour Fitness USA LLC

24 Hour Fitness USA LLC - Overview
24 Hour Fitness USA LLC - Product / Service
24 Hour Fitness USA LLC - Key offerings
SWOT

15.5 Anytime Fitness Franchisor LLC

Anytime Fitness Franchisor LLC - Overview
Anytime Fitness Franchisor LLC - Product / Service
Anytime Fitness Franchisor LLC - Key offerings
SWOT

15.6 Crunch LLC

Crunch LLC - Overview
Crunch LLC - Product / Service
Crunch LLC - Key offerings
SWOT

15.7 Curves NA Inc.

Curves NA Inc. - Overview
Curves NA Inc. - Product / Service
Curves NA Inc. - Key offerings
SWOT

15.8 David Lloyd Leisure Ltd.

David Lloyd Leisure Ltd. - Overview
David Lloyd Leisure Ltd. - Product / Service
David Lloyd Leisure Ltd. - Key offerings
SWOT

15.9 Equinox Holdings Inc.

Equinox Holdings Inc. - Overview
Equinox Holdings Inc. - Product / Service
Equinox Holdings Inc. - Key offerings
SWOT

15.10 FIT House of Brands

FIT House of Brands - Overview
FIT House of Brands - Product / Service
FIT House of Brands - Key offerings
SWOT

15.11 Golds Gym Club Holding LLC

Golds Gym Club Holding LLC - Overview
Golds Gym Club Holding LLC - Product / Service
Golds Gym Club Holding LLC - Key offerings
SWOT

15.12 Life Time Inc.

Life Time Inc. - Overview
Life Time Inc. - Product / Service
Life Time Inc. - Key offerings
SWOT

15.13 Planet Fitness Inc.

Planet Fitness Inc. - Overview
Planet Fitness Inc. - Business segments
Planet Fitness Inc. - Key offerings
Planet Fitness Inc. - Segment focus
SWOT

15.14 RSG Group GmbH

RSG Group GmbH - Overview
RSG Group GmbH - Product / Service
RSG Group GmbH - Key offerings
SWOT

15.15 Snap Fitness Inc

Snap Fitness Inc - Overview
Snap Fitness Inc - Product / Service
Snap Fitness Inc - Key offerings
SWOT

15.16 The Gym Group

The Gym Group - Overview
The Gym Group - Product / Service
The Gym Group - Key offerings
SWOT

15.17 Ultimate Fitness Group LLC

Ultimate Fitness Group LLC - Overview
Ultimate Fitness Group LLC - Product / Service
Ultimate Fitness Group LLC - Key offerings
SWOT

15.18 Virgin Active Ltd.

Virgin Active Ltd. - Overview
Virgin Active Ltd. - Product / Service
Virgin Active Ltd. - Key offerings
SWOT

16. Appendix

16.1 Scope of the report

Market definition
Objectives
Notes and caveats

16.2 Inclusions and exclusions checklist

Inclusions checklist
Exclusions checklist

16.3 Currency conversion rates for US$

16.4 Research methodology

16.5 Data procurement

Information sources

16.6 Data validation

16.7 Validation techniques employed for market sizing

16.8 Data synthesis

16.9 360 degree market analysis

16.10 List of abbreviations

Research Methodology

Technavio presents a detailed picture of the market by way of study, synthesis, and summation of data from multiple sources. The analysts have presented the various facets of the market with a particular focus on identifying the key industry influencers. The data thus presented is comprehensive, reliable, and the result of extensive research, both primary and secondary.

INFORMATION SOURCES

Primary sources

  • Manufacturers and suppliers
  • Channel partners
  • Industry experts
  • Strategic decision makers

Secondary sources

  • Industry journals and periodicals
  • Government data
  • Financial reports of key industry players
  • Historical data
  • Press releases

DATA ANALYSIS

Data Synthesis

  • Collation of data
  • Estimation of key figures
  • Analysis of derived insights

Data Validation

  • Triangulation with data models
  • Reference against proprietary databases
  • Corroboration with industry experts

REPORT WRITING

Qualitative

  • Market drivers
  • Market challenges
  • Market trends
  • Five forces analysis

Quantitative

  • Market size and forecast
  • Market segmentation
  • Geographical insights
  • Competitive landscape

Interested in this report?

Get your sample now to see our research methodology and insights!

Download Now

Frequently Asked Questions

Fitness And Recreational Sports Centers market growth will increase by USD 107161.8 million during 2026-2030.

The Fitness And Recreational Sports Centers market is expected to grow at a CAGR of 9.2% during 2026-2030.

Fitness And Recreational Sports Centers market is segmented by End-user (Men, Women) Age group (35 and younger, 35-54, 55 and older) Service type (Gym and fitness centers, Sports clubs, Yoga and pilates studios, Others)

24 Hour Fitness USA LLC, Anytime Fitness Franchisor LLC, Barrys, Crunch LLC, Curves NA Inc., David Lloyd Leisure Ltd., Equinox Holdings Inc., FIT House of Brands, Golds Gym Club Holding LLC, Life Time Inc., Planet Fitness Inc., RSG Group GmbH, Snap Fitness Inc, SoulCycle, The Gym Group, Ultimate Fitness Group LLC, Virgin Active Ltd., YouFit Gyms are a few of the key vendors in the Fitness And Recreational Sports Centers market.

North America will register the highest growth rate of 39.5% among the other regions. Therefore, the Fitness And Recreational Sports Centers market in North America is expected to garner significant business opportunities for the vendors during the forecast period.

US, Canada, Mexico, China, India, Japan, South Korea, Australia, Indonesia, Germany, UK, Spain, France, Italy, The Netherlands, UAE, Saudi Arabia, South Africa, Israel, Turkey, Brazil, Argentina, Colombia

  • Growing health and wellness awareness driving memberships is the driving factor this market.

The Fitness And Recreational Sports Centers market vendors should focus on grabbing business opportunities from the End-user segment as it accounted for the largest market share in the base year.
RIA - Research AI Assistant
Ask RIA