Fertilizers Market Analysis, Size, and Forecast 2025-2029: APAC (Australia, China, India, Japan, South Korea), North America (US and Canada), Europe (France, Russia), South America (Brazil), and Middle East and Africa

Fertilizers Market Analysis, Size, and Forecast 2025-2029:
APAC (Australia, China, India, Japan, South Korea), North America (US and Canada), Europe (France, Russia), South America (Brazil), and Middle East and Africa

Published: Mar 2025 218 Pages SKU: IRTNTR74794

Market Overview at a Glance

$24.7 B
Market Opportunity
2.2%
CAGR
2.1
YoY growth 2024-2025(%)

Fertilizers Market Size 2025-2029

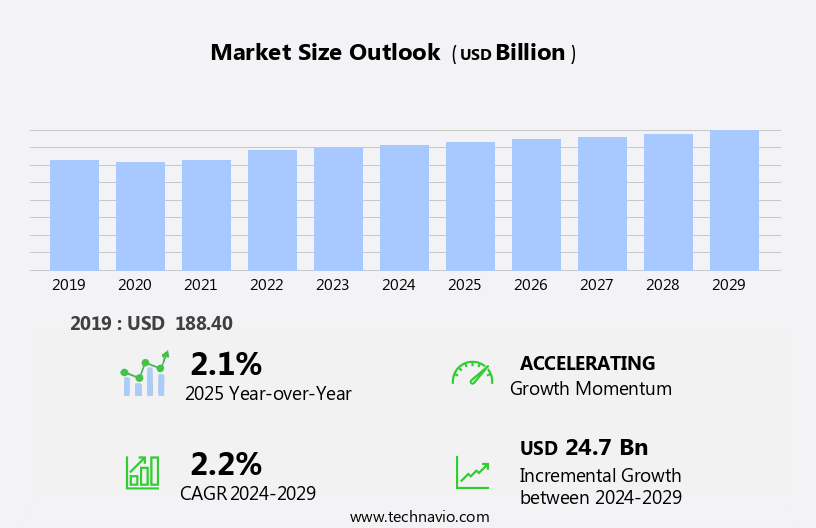
The fertilizers market size is forecast to increase by USD 24.7 billion, at a CAGR of 2.2% between 2024 and 2029.

  • The market is experiencing significant growth, driven by the increasing demand for organic fertilizers and the adoption of high-efficiency fertilizers in the agriculture sector. Organic fertilizers are gaining popularity due to their environmental benefits and the growing consumer preference for sustainable farming practices. Meanwhile, high-efficiency fertilizers, which offer improved nutrient use efficiency and reduced environmental impact, are increasingly being adopted to enhance agricultural productivity. However, the market faces challenges, including health issues associated with fertilizer use. The potential health risks posed by excessive exposure to fertilizers, such as respiratory problems and skin irritation, are a concern for farmers and laborers.
  • Furthermore, the volatility of raw material prices and the increasing regulatory pressure on fertilizer manufacturers to reduce their environmental footprint add complexity to the market landscape. To capitalize on opportunities and navigate these challenges, companies must focus on innovation, sustainability, and regulatory compliance. Strategic partnerships, research and development initiatives, and investments in technology can help companies differentiate themselves and stay competitive in this dynamic market.

What will be the Size of the Fertilizers Market during the forecast period?

Fertilizers Market Size

Explore in-depth regional segment analysis with market size data - historical 2019-2023 and forecasts 2025-2029 - in the full report.  
Request Free Sample

The fertilizer market continues to evolve, driven by the ongoing quest for agricultural efficiency and sustainable practices. Natural and synthetic fertilizers play integral roles in enhancing crop yield and plant growth. Broadcast spreading and GPS guidance optimize fertilizer application, while nutrient management strategies consider the NPK ratio and root development. Water-soluble fertilizers and foliar feeding expedite nutrient uptake, and slow-release and granular fertilizers ensure consistent delivery. Fertilizer blending and soil testing are essential components of effective nutrient management. The use of inorganic and organic fertilizers, each with unique environmental impacts, necessitates careful consideration. Greenhouse gas emissions from fertilizer production and application are under scrutiny, necessitating ongoing research and innovation.

Precision farming, including crop modeling, yield monitoring, and precision agriculture, is revolutionizing fertilizer application and distribution networks. Soil health and degradation are critical concerns, with the potential for water pollution and environmental damage underscoring the need for sustainable practices. Phosphate rock and potassium chloride are essential resources in fertilizer production, while ammonium nitrate and liquid fertilizers cater to various agricultural needs. Supply chain management and fertilizer distribution networks remain crucial for ensuring a steady supply of essential nutrients. In this dynamic market, the interplay of various factors—from crop production to environmental impact—continuously unfolds, necessitating ongoing research and adaptation. The future of fertilizer applications lies in the integration of technology, sustainability, and efficiency.

How is this Fertilizers Industry segmented?

The fertilizers industry research report provides comprehensive data (region-wise segment analysis), with forecasts and estimates in "USD billion" for the period 2025-2029, as well as historical data from 2019-2023 for the following segments.

  • Type
    • Inorganic
    • Organic
  • Application
    • Agriculture
    • Horticulture
    • Gardening
  • Product Type
    • Dry
    • Liquid
  • Product
    • Straight
    • Complex
  • Geography
    • North America
      • US
      • Canada
    • Europe
      • France
      • Russia
    • APAC
      • Australia
      • China
      • India
      • Japan
      • South Korea
    • South America
      • Brazil
    • Rest of World (ROW)

    By Type Insights

    The inorganic segment is estimated to witness significant growth during the forecast period.

    The inorganic the market plays a pivotal role in contemporary agriculture, supplying necessary nutrients that substantially boost crop yield and quality. Inorganic fertilizers, consisting mainly of nitrogen, phosphorus, and potassium (NPK), are popular due to their quick availability to plants and their capacity to rectify specific nutrient shortages in the soil. The escalating global population necessitates increased food production, thereby fueling the demand for inorganic fertilizers. Key players in this sector include Yara International, CF Industries Holdings, and Nutrien Ltd. Yara International is recognized for its extensive line of nitrogen-based fertilizers, while CF Industries Holdings excels in the manufacturing and distribution of nitrogen fertilizers, such as ammonia, urea, and ammonium nitrate.

    Agricultural efficiency is a significant concern in modern farming, leading to the adoption of precision farming techniques, including GPS guidance and crop modeling. Broadcast spreading and foliar feeding are among the application methods used with both natural and synthetic fertilizers to optimize nutrient uptake. Synthetic fertilizers, while providing instant nutrient availability, have environmental implications, particularly with regards to greenhouse gas emissions. In response, there is a growing emphasis on sustainable agriculture and the use of organic fertilizers, which promote soil health and reduce environmental impact. The fertilizer industry relies on efficient supply chain management and distribution networks to meet the demands of farmers.

    Nutrient management and soil testing are crucial aspects of fertilizer application, ensuring optimal crop production and minimizing the risk of water pollution. Fertilizer blending is a common practice to create customized fertilizer formulations, catering to the specific nutrient requirements of various crops. Water-soluble fertilizers and liquid fertilizers offer enhanced nutrient availability, making them suitable for crops with high nutrient demands. Slow-release fertilizers and granular fertilizers provide sustained nutrient supply, reducing the need for frequent applications. Potassium chloride is a valuable component of fertilizers, contributing to plant growth and root development. In conclusion, the inorganic the market is a dynamic and evolving industry, driven by the need for increased agricultural efficiency and food production.

    Players in this sector must navigate the complex interplay of environmental concerns, technological advancements, and market demands to remain competitive.

    Fertilizers Market Size

    Request Free Sample

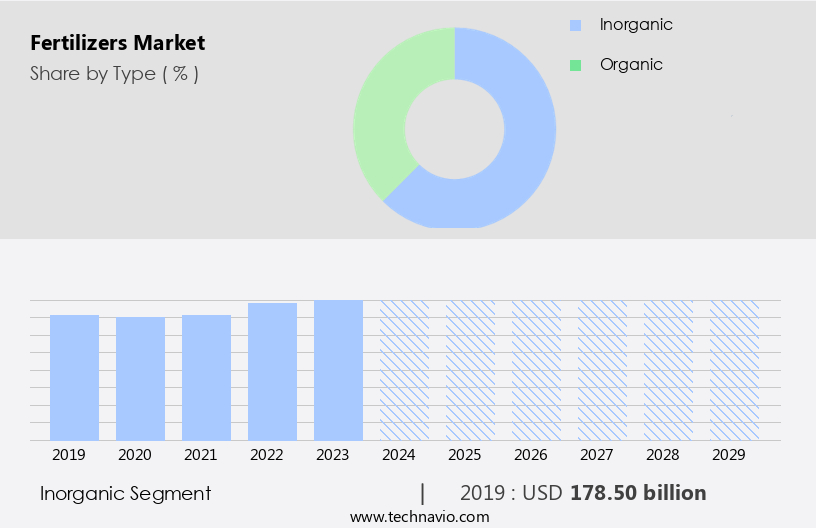
    The Inorganic segment was valued at USD 178.50 billion in 2019 and showed a gradual increase during the forecast period.

    Regional Analysis

    APAC is estimated to contribute 42% to the growth of the global market during the forecast period.Technavio’s analysts have elaborately explained the regional trends and drivers that shape the market during the forecast period.

    Fertilizers Market Share by Geography

     Request Free Sample

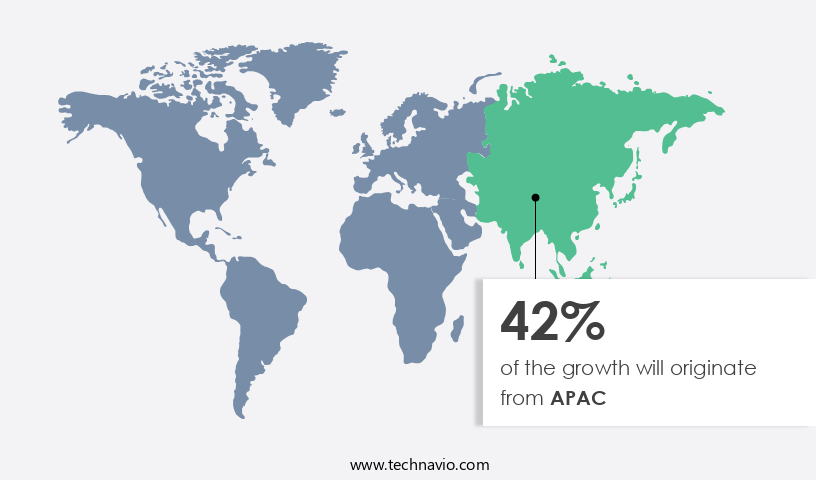
    The market is experiencing significant growth in the Asia Pacific (APAC) region due to the increasing demand for organic food and rising per capita income. Key agricultural countries, such as Australia, China, and India, are major contributors to this market. These nations are renowned for exporting a wide range of agricultural products, including cotton, sugarcane, fruits, vegetables, grains, and cotton. In APAC, particularly in India and China, there is a transition in dietary preferences from grain-based to high protein-based, leading to increased demand for nitrogen-based liquid fertilizers to cultivate high-yield crops rich in protein. Moreover, precision farming and sustainable agriculture practices are gaining popularity in APAC, driving the adoption of technologies like GPS guidance, soil testing, and nutrient management.

    Fertilizer blending and distribution networks are essential components of this supply chain, ensuring agricultural efficiency and minimizing environmental impact. Synthetic fertilizers, such as ammonium nitrate and potassium chloride, remain popular choices for farmers due to their high nutrient content. However, concerns regarding greenhouse gas emissions and soil degradation have led to a growing interest in organic and slow-release fertilizers. Organic fertilizers, derived from natural sources like phosphate rock, promote root development and nutrient uptake, contributing to better plant growth and crop production. Water-soluble fertilizers and foliar feeding are alternative methods for delivering essential nutrients directly to plants, enhancing nutrient uptake and crop yield.

    Fertilizer application techniques like broadcast spreading and liquid application are essential for maximizing crop production and minimizing waste. Crop modeling and yield monitoring are crucial tools for farmers to optimize fertilizer usage and improve overall agricultural efficiency. By adopting precision agriculture practices, farmers can minimize the environmental impact of fertilizer use while maximizing crop yields and ensuring soil health.

    Market Dynamics

    Our researchers analyzed the data with 2024 as the base year, along with the key drivers, trends, and challenges. A holistic analysis of drivers will help companies refine their marketing strategies to gain a competitive advantage.

    The market encompasses the production, distribution, and sale of various types of fertilizers essential for agricultural and horticultural growth. These include organic fertilizers derived from natural sources like manure, bone meal, and compost, as well as inorganic fertilizers such as ammonia, potassium, and phosphate. Fertilizer blends, slow-release granules, and liquid fertilizers are also part of this dynamic market. Nutrient content plays a crucial role, with essential macronutrients like nitrogen, phosphorus, and potassium, as well as micronutrients like zinc, iron, and manganese, all contributing to optimal plant health. Fertilizer application methods vary, from broadcasting and side-dressing to injection and foliar feeding. The market is influenced by factors like farming practices, crop types, and government regulations, making it a vital sector in global agriculture.

    What are the key market drivers leading to the rise in the adoption of Fertilizers Industry?

    • The surge in demand for organic fertilizers serves as the primary market driver, reflecting growing consumer preference for sustainable agricultural practices. 

    • Organic fertilizers, derived from natural sources, offer environmental benefits as they degrade rapidly and do not negatively impact surface and groundwater. Their long shelf life enhances soil structure and nutrient retention. Preferred for producing residue-free produce, organic fertilizers are non-toxic and slow-release, leaving no residue in food. The global population's growing demand for food, driven by changing dietary habits in developed and developing countries, fuels the fertilizer market's expansion during the forecast period.
    • Government initiatives supporting sustainable agriculture, precision farming, and fertilizer blending, along with soil testing and nutrient uptake optimization, further boost market growth. Organic fertilizers' emphasis on harmonious farming practices and reduced greenhouse gas emissions aligns with the industry's shift towards more sustainable crop production methods.

    What are the market trends shaping the Fertilizers Industry?

    • The agricultural sector is witnessing an increasing trend towards the adoption of high-efficiency fertilizers. This shift is driven by the need for sustainable farming practices and the desire to improve crop yields. High-efficiency fertilizers offer numerous benefits, including reduced environmental impact and improved nutrient use efficiency. By utilizing these advanced fertilizer solutions, farmers can enhance their productivity while minimizing their environmental footprint.

    • The market is driven by the increasing demand for food production to meet the needs of a growing population, projected to reach 9 billion by 2050. To produce high-quality crops, farmers require micronutrients, leading to a growing preference for specialized fertilizers. The demand for vegetables and fruits is particularly high, necessitating the use of high-performance fertilizers. Governments offer subsidies to encourage fertilizer use, while companies invest in research and development to launch innovative products. Liquid fertilizers, such as potassium chloride, are gaining popularity due to their efficiency and ease of application. Precision agriculture, including crop modeling, yield monitoring, and soil health analysis, is becoming increasingly important in modern farming.
    • However, concerns over water pollution from fertilizer runoff remain a challenge for the industry. To mitigate this, distribution networks are being optimized to reduce over-application and improve efficiency. In conclusion, The market is experiencing significant growth due to the increasing demand for food production and the adoption of advanced farming techniques. Companies are focusing on innovation and sustainability to meet the evolving needs of farmers and consumers. Despite challenges, such as water pollution and regulatory compliance, the market is expected to continue its growth trajectory during the forecast period.

    What challenges does the Fertilizers Industry face during its growth?

    • The fertilizer industry faces significant growth challenges due to the health concerns and associated issues linked to the use and production of fertilizers. 

    • Fertilizers play a crucial role in agriculture, yet their use comes with potential risks. These products can pose health hazards to humans and pets if inhaled or ingested accidentally. Commercially available synthetic or chemical-based fertilizers may contain heavy metals, ammonium nitrate, potassium chloride, and cadmium. Plants absorb these chemicals, entering the food chain through fruits and vegetables. Moreover, leaks from these fertilizers can contaminate groundwater, leading to high levels of nitrates and nitrites that can cause hemoglobin failure. Ammonium nitrate, a vital component of fertilizer mixtures, is an odorless, colorless, or white crystalline salt formed from the reaction of ammonia and nitric acid.
    • Despite its benefits, the mishandling or improper use of ammonium nitrate can lead to catastrophic consequences, as seen in various industrial accidents. Therefore, it's essential to follow safety guidelines when handling and using fertilizers to mitigate potential health and environmental risks.

    Exclusive Customer Landscape

    The fertilizers market forecasting report includes the adoption lifecycle of the market, covering from the innovator’s stage to the laggard’s stage. It focuses on adoption rates in different regions based on penetration. Furthermore, the fertilizers market report also includes key purchase criteria and drivers of price sensitivity to help companies evaluate and develop their market growth analysis strategies.
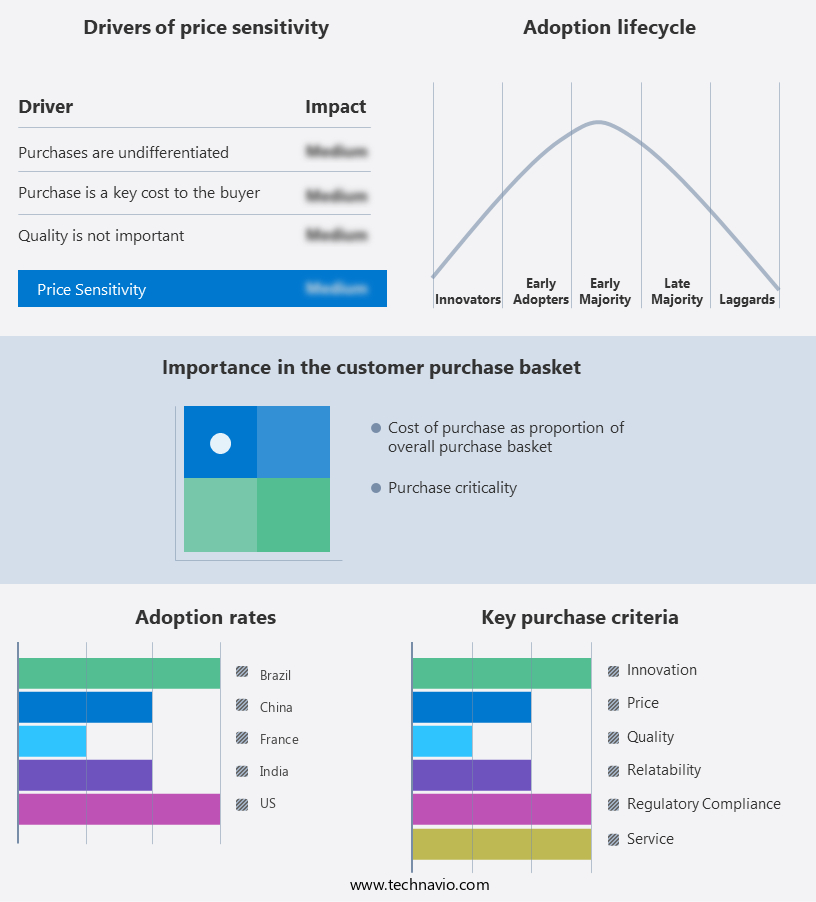
    Fertilizers Market Share by Geography

     Customer Landscape

    Key Companies & Market Insights

    Companies are implementing various strategies, such as strategic alliances, fertilizers market forecast, partnerships, mergers and acquisitions, geographical expansion, and product/service launches, to enhance their presence in the industry.

    Bunge Ltd. - Specializing in agro-chemicals, we provide a range of fertilizers including superphosphate, ammonia, urea, and ammonium thiosulfate, enhancing crop productivity through scientific nutrient optimization. Our offerings cater to diverse agricultural needs, driving sustainable farming practices and improved yields.

    The industry research and growth report includes detailed analyses of the competitive landscape of the market and information about key companies, including:

    • Bunge Ltd.
    • CF Industries Holdings Inc.
    • EuroChem Group AG
    • GUBRETAS
    • Haifa Negev technologies Ltd.
    • Israel Chemicals Ltd.
    • Indian Farmers Fertiliser Cooperative Ltd.
    • KS Aktiengesellschaft
    • Nufarm Ltd.
    • Nutrien Ltd.
    • OCP Group
    • PhosAgro Group of Companies
    • SQM S.A.
    • Sumitomo Chemical Co. Ltd.
    • Syngenta Crop Protection AG
    • Unikeyterra Kimya Tarim
    • Yara International ASA

    Qualitative and quantitative analysis of companies has been conducted to help clients understand the wider business environment as well as the strengths and weaknesses of key industry players. Data is qualitatively analyzed to categorize companies as pure play, category-focused, industry-focused, and diversified; it is quantitatively analyzed to categorize companies as dominant, leading, strong, tentative, and weak.

    Recent Development and News in Fertilizers Market

    • In January 2024, Yara International ASA, a leading global fertilizer company, announced the launch of its new bio-based fertilizer product, YaraVita Bio, in collaboration with Danish biotech firm, Novozymes. This innovative fertilizer, which utilizes microbial technology to improve crop yields and reduce environmental impact, marked a significant step forward in the sustainable fertilizer sector (Yara International ASA Press Release, 2024).
    • In March 2024, PotashCorp and Agrium Inc. Completed their merger, creating Nutrien, the world's largest fertilizer company. This strategic move aimed to strengthen their market position and optimize production and distribution efficiencies in the face of increasing competition (Bloomberg, 2024).
    • In May 2024, the Indian government announced the National Fertilizers Policy 2024, focusing on increasing domestic fertilizer production, promoting the use of organic and bio-fertilizers, and reducing the country's dependence on imports (Ministry of Chemicals and Fertilizers, 2024).
    • In April 2025, Haifa Group, an Israeli fertilizer manufacturer, unveiled its new state-of-the-art ammonia production plant in Haifa Bay, with an annual capacity of 1.2 million metric tons. This technological advancement underscored the company's commitment to expanding its production capabilities and meeting the growing demand for fertilizers (Haifa Group Press Release, 2025).

    Research Analyst Overview

    • In the market, no-till farming and reduced tillage practices have gained traction, leading to increased demand for soil amendments. Mycorrhizal fungi, a key component of soil health, are increasingly used to enhance nutrient uptake and promote nitrogen fixation. Digital farming and precision fertilizer placement, facilitated by big data and data analytics, enable farmers to optimize nutrient application and reduce waste. Nitrification inhibitors and ureaase inhibitors are essential additives to minimize nutrient loss and improve efficiency. Carbon sequestration through regenerative agriculture, cover cropping, and organic farming is a growing trend, with phosphate solubilizers playing a crucial role in optimizing nutrient cycling.
    • Drone technology and remote sensing offer valuable insights for crop monitoring and management, while machine learning and artificial intelligence enable predictive analysis and optimization of fertilizer application. Water conservation remains a critical concern, driving innovation in fertilizer technologies and farming practices.

    Dive into Technavio’s robust research methodology, blending expert interviews, extensive data synthesis, and validated models for unparalleled Fertilizers Market insights. See full methodology.

    Market Scope

    Report Coverage

    Details

    Page number

    218

    Base year

    2024

    Historic period

    2019-2023

    Forecast period

    2025-2029

    Growth momentum & CAGR

    Accelerate at a CAGR of 2.2%

    Market growth 2025-2029

    USD 24.7 billion

    Market structure

    Fragmented

    YoY growth 2024-2025(%)

    2.1

    Key countries

    China, US, India, Japan, France, Canada, Brazil, South Korea, Russia, and Australia

    Competitive landscape

    Leading Companies, Market Positioning of Companies, Competitive Strategies, and Industry Risks

    Request Free Sample

    What are the Key Data Covered in this Fertilizers Market Research and Growth Report?

    • CAGR of the Fertilizers industry during the forecast period
    • Detailed information on factors that will drive the growth and forecasting between 2025 and 2029
    • Precise estimation of the size of the market and its contribution of the industry in focus to the parent market
    • Accurate predictions about upcoming growth and trends and changes in consumer behaviour
    • Growth of the market across APAC, North America, Europe, South America, and Middle East and Africa
    • Thorough analysis of the market’s competitive landscape and detailed information about companies
    • Comprehensive analysis of factors that will challenge the fertilizers market growth of industry companies

    We can help! Our analysts can customize this fertilizers market research report to meet your requirements.

    Get in touch


    1 Executive Summary

    • 1.1 Market overview
      • Executive Summary - Chart on Market Overview
      • Executive Summary - Data Table on Market Overview
      • Executive Summary - Chart on Global Market Characteristics
      • Executive Summary - Chart on Market by Geography
      • Executive Summary - Chart on Market Segmentation by Type
      • Executive Summary - Chart on Market Segmentation by Application
      • Executive Summary - Chart on Market Segmentation by Product Type
      • Executive Summary - Chart on Market Segmentation by Product
      • Executive Summary - Chart on Incremental Growth
      • Executive Summary - Data Table on Incremental Growth
      • Executive Summary - Chart on Company Market Positioning

    2 Technavio Analysis

    • 2.1 Analysis of price sensitivity, lifecycle, customer purchase basket, adoption rates, and purchase criteria
      • Analysis of price sensitivity, lifecycle, customer purchase basket, adoption rates, and purchase criteria
    • 2.2 Criticality of inputs and Factors of differentiation
      • Overview on criticality of inputs and factors of differentiation
    • 2.3 Factors of disruption
      • Overview on factors of disruption
    • 2.4 Impact of drivers and challenges
      • Impact of drivers and challenges in 2024 and 2029

    3 Market Landscape

    • 3.1 Market ecosystem
      • Parent Market
      • Data Table on - Parent Market
    • 3.2 Market characteristics
      • Market characteristics analysis
    • 3.3 Value chain analysis
      • Value chain analysis

    4 Market Sizing

    • 4.1 Market definition
      • Offerings of companies included in the market definition
    • 4.2 Market segment analysis
      • Market segments
    • 4.3 Market size 2024
      • 4.4 Market outlook: Forecast for 2024-2029
        • Chart on Global - Market size and forecast 2024-2029 ($ billion)
        • Data Table on Global - Market size and forecast 2024-2029 ($ billion)
        • Chart on Global Market: Year-over-year growth 2024-2029 (%)
        • Data Table on Global Market: Year-over-year growth 2024-2029 (%)

      5 Historic Market Size

      • 5.1 Global Fertilizers Market 2019 - 2023
        • Historic Market Size - Data Table on Global Fertilizers Market 2019 - 2023 ($ billion)
      • 5.2 Type segment analysis 2019 - 2023
        • Historic Market Size - Type Segment 2019 - 2023 ($ billion)
      • 5.3 Application segment analysis 2019 - 2023
        • Historic Market Size - Application Segment 2019 - 2023 ($ billion)
      • 5.4 Product Type segment analysis 2019 - 2023
        • Historic Market Size - Product Type Segment 2019 - 2023 ($ billion)
      • 5.5 Product segment analysis 2019 - 2023
        • Historic Market Size - Product Segment 2019 - 2023 ($ billion)
      • 5.6 Geography segment analysis 2019 - 2023
        • Historic Market Size - Geography Segment 2019 - 2023 ($ billion)
      • 5.7 Country segment analysis 2019 - 2023
        • Historic Market Size - Country Segment 2019 - 2023 ($ billion)

      6 Qualitative Analysis

      • 6.1 Impact of AI on Global fertilizers Market

        7 Five Forces Analysis

        • 7.1 Five forces summary
          • Five forces analysis - Comparison between 2024 and 2029
        • 7.2 Bargaining power of buyers
          • Bargaining power of buyers - Impact of key factors 2024 and 2029
        • 7.3 Bargaining power of suppliers
          • Bargaining power of suppliers - Impact of key factors in 2024 and 2029
        • 7.4 Threat of new entrants
          • Threat of new entrants - Impact of key factors in 2024 and 2029
        • 7.5 Threat of substitutes
          • Threat of substitutes - Impact of key factors in 2024 and 2029
        • 7.6 Threat of rivalry
          • Threat of rivalry - Impact of key factors in 2024 and 2029
        • 7.7 Market condition
          • Chart on Market condition - Five forces 2024 and 2029

        8 Market Segmentation by Type

        • 8.1 Market segments
          • Chart on Type - Market share 2024-2029 (%)
          • Data Table on Type - Market share 2024-2029 (%)
        • 8.2 Comparison by Type
          • Chart on Comparison by Type
          • Data Table on Comparison by Type
        • 8.3 Inorganic - Market size and forecast 2024-2029
          • Chart on Inorganic - Market size and forecast 2024-2029 ($ billion)
          • Data Table on Inorganic - Market size and forecast 2024-2029 ($ billion)
          • Chart on Inorganic - Year-over-year growth 2024-2029 (%)
          • Data Table on Inorganic - Year-over-year growth 2024-2029 (%)
        • 8.4 Organic - Market size and forecast 2024-2029
          • Chart on Organic - Market size and forecast 2024-2029 ($ billion)
          • Data Table on Organic - Market size and forecast 2024-2029 ($ billion)
          • Chart on Organic - Year-over-year growth 2024-2029 (%)
          • Data Table on Organic - Year-over-year growth 2024-2029 (%)
        • 8.5 Market opportunity by Type
          • Market opportunity by Type ($ billion)
          • Data Table on Market opportunity by Type ($ billion)

        9 Market Segmentation by Application

        • 9.1 Market segments
          • Chart on Application - Market share 2024-2029 (%)
          • Data Table on Application - Market share 2024-2029 (%)
        • 9.2 Comparison by Application
          • Chart on Comparison by Application
          • Data Table on Comparison by Application
        • 9.3 Agriculture - Market size and forecast 2024-2029
          • Chart on Agriculture - Market size and forecast 2024-2029 ($ billion)
          • Data Table on Agriculture - Market size and forecast 2024-2029 ($ billion)
          • Chart on Agriculture - Year-over-year growth 2024-2029 (%)
          • Data Table on Agriculture - Year-over-year growth 2024-2029 (%)
        • 9.4 Horticulture - Market size and forecast 2024-2029
          • Chart on Horticulture - Market size and forecast 2024-2029 ($ billion)
          • Data Table on Horticulture - Market size and forecast 2024-2029 ($ billion)
          • Chart on Horticulture - Year-over-year growth 2024-2029 (%)
          • Data Table on Horticulture - Year-over-year growth 2024-2029 (%)
        • 9.5 Gardening - Market size and forecast 2024-2029
          • Chart on Gardening - Market size and forecast 2024-2029 ($ billion)
          • Data Table on Gardening - Market size and forecast 2024-2029 ($ billion)
          • Chart on Gardening - Year-over-year growth 2024-2029 (%)
          • Data Table on Gardening - Year-over-year growth 2024-2029 (%)
        • 9.6 Market opportunity by Application
          • Market opportunity by Application ($ billion)
          • Data Table on Market opportunity by Application ($ billion)

        10 Market Segmentation by Product Type

        • 10.1 Market segments
          • Chart on Product Type - Market share 2024-2029 (%)
          • Data Table on Product Type - Market share 2024-2029 (%)
        • 10.2 Comparison by Product Type
          • Chart on Comparison by Product Type
          • Data Table on Comparison by Product Type
        • 10.3 Dry - Market size and forecast 2024-2029
          • Chart on Dry - Market size and forecast 2024-2029 ($ billion)
          • Data Table on Dry - Market size and forecast 2024-2029 ($ billion)
          • Chart on Dry - Year-over-year growth 2024-2029 (%)
          • Data Table on Dry - Year-over-year growth 2024-2029 (%)
        • 10.4 Liquid - Market size and forecast 2024-2029
          • Chart on Liquid - Market size and forecast 2024-2029 ($ billion)
          • Data Table on Liquid - Market size and forecast 2024-2029 ($ billion)
          • Chart on Liquid - Year-over-year growth 2024-2029 (%)
          • Data Table on Liquid - Year-over-year growth 2024-2029 (%)
        • 10.5 Market opportunity by Product Type
          • Market opportunity by Product Type ($ billion)
          • Data Table on Market opportunity by Product Type ($ billion)

        11 Market Segmentation by Product

        • 11.1 Market segments
          • Chart on Product - Market share 2024-2029 (%)
          • Data Table on Product - Market share 2024-2029 (%)
        • 11.2 Comparison by Product
          • Chart on Comparison by Product
          • Data Table on Comparison by Product
        • 11.3 Straight - Market size and forecast 2024-2029
          • Chart on Straight - Market size and forecast 2024-2029 ($ billion)
          • Data Table on Straight - Market size and forecast 2024-2029 ($ billion)
          • Chart on Straight - Year-over-year growth 2024-2029 (%)
          • Data Table on Straight - Year-over-year growth 2024-2029 (%)
        • 11.4 Complex - Market size and forecast 2024-2029
          • Chart on Complex - Market size and forecast 2024-2029 ($ billion)
          • Data Table on Complex - Market size and forecast 2024-2029 ($ billion)
          • Chart on Complex - Year-over-year growth 2024-2029 (%)
          • Data Table on Complex - Year-over-year growth 2024-2029 (%)
        • 11.5 Market opportunity by Product
          • Market opportunity by Product ($ billion)
          • Data Table on Market opportunity by Product ($ billion)

        12 Customer Landscape

        • 12.1 Customer landscape overview
          • Analysis of price sensitivity, lifecycle, customer purchase basket, adoption rates, and purchase criteria

        13 Geographic Landscape

        • 13.1 Geographic segmentation
          • Chart on Market share by geography 2024-2029 (%)
          • Data Table on Market share by geography 2024-2029 (%)
        • 13.2 Geographic comparison
          • Chart on Geographic comparison
          • Data Table on Geographic comparison
        • 13.3 APAC - Market size and forecast 2024-2029
          • Chart on APAC - Market size and forecast 2024-2029 ($ billion)
          • Data Table on APAC - Market size and forecast 2024-2029 ($ billion)
          • Chart on APAC - Year-over-year growth 2024-2029 (%)
          • Data Table on APAC - Year-over-year growth 2024-2029 (%)
        • 13.4 North America - Market size and forecast 2024-2029
          • Chart on North America - Market size and forecast 2024-2029 ($ billion)
          • Data Table on North America - Market size and forecast 2024-2029 ($ billion)
          • Chart on North America - Year-over-year growth 2024-2029 (%)
          • Data Table on North America - Year-over-year growth 2024-2029 (%)
        • 13.5 Europe - Market size and forecast 2024-2029
          • Chart on Europe - Market size and forecast 2024-2029 ($ billion)
          • Data Table on Europe - Market size and forecast 2024-2029 ($ billion)
          • Chart on Europe - Year-over-year growth 2024-2029 (%)
          • Data Table on Europe - Year-over-year growth 2024-2029 (%)
        • 13.6 South America - Market size and forecast 2024-2029
          • Chart on South America - Market size and forecast 2024-2029 ($ billion)
          • Data Table on South America - Market size and forecast 2024-2029 ($ billion)
          • Chart on South America - Year-over-year growth 2024-2029 (%)
          • Data Table on South America - Year-over-year growth 2024-2029 (%)
        • 13.7 Middle East and Africa - Market size and forecast 2024-2029
          • Chart on Middle East and Africa - Market size and forecast 2024-2029 ($ billion)
          • Data Table on Middle East and Africa - Market size and forecast 2024-2029 ($ billion)
          • Chart on Middle East and Africa - Year-over-year growth 2024-2029 (%)
          • Data Table on Middle East and Africa - Year-over-year growth 2024-2029 (%)
        • 13.8 China - Market size and forecast 2024-2029
          • Chart on China - Market size and forecast 2024-2029 ($ billion)
          • Data Table on China - Market size and forecast 2024-2029 ($ billion)
          • Chart on China - Year-over-year growth 2024-2029 (%)
          • Data Table on China - Year-over-year growth 2024-2029 (%)
        • 13.9 US - Market size and forecast 2024-2029
          • Chart on US - Market size and forecast 2024-2029 ($ billion)
          • Data Table on US - Market size and forecast 2024-2029 ($ billion)
          • Chart on US - Year-over-year growth 2024-2029 (%)
          • Data Table on US - Year-over-year growth 2024-2029 (%)
        • 13.10 India - Market size and forecast 2024-2029
          • Chart on India - Market size and forecast 2024-2029 ($ billion)
          • Data Table on India - Market size and forecast 2024-2029 ($ billion)
          • Chart on India - Year-over-year growth 2024-2029 (%)
          • Data Table on India - Year-over-year growth 2024-2029 (%)
        • 13.11 Japan - Market size and forecast 2024-2029
          • Chart on Japan - Market size and forecast 2024-2029 ($ billion)
          • Data Table on Japan - Market size and forecast 2024-2029 ($ billion)
          • Chart on Japan - Year-over-year growth 2024-2029 (%)
          • Data Table on Japan - Year-over-year growth 2024-2029 (%)
        • 13.12 France - Market size and forecast 2024-2029
          • Chart on France - Market size and forecast 2024-2029 ($ billion)
          • Data Table on France - Market size and forecast 2024-2029 ($ billion)
          • Chart on France - Year-over-year growth 2024-2029 (%)
          • Data Table on France - Year-over-year growth 2024-2029 (%)
        • 13.13 Brazil - Market size and forecast 2024-2029
          • Chart on Brazil - Market size and forecast 2024-2029 ($ billion)
          • Data Table on Brazil - Market size and forecast 2024-2029 ($ billion)
          • Chart on Brazil - Year-over-year growth 2024-2029 (%)
          • Data Table on Brazil - Year-over-year growth 2024-2029 (%)
        • 13.14 Canada - Market size and forecast 2024-2029
          • Chart on Canada - Market size and forecast 2024-2029 ($ billion)
          • Data Table on Canada - Market size and forecast 2024-2029 ($ billion)
          • Chart on Canada - Year-over-year growth 2024-2029 (%)
          • Data Table on Canada - Year-over-year growth 2024-2029 (%)
        • 13.15 South Korea - Market size and forecast 2024-2029
          • Chart on South Korea - Market size and forecast 2024-2029 ($ billion)
          • Data Table on South Korea - Market size and forecast 2024-2029 ($ billion)
          • Chart on South Korea - Year-over-year growth 2024-2029 (%)
          • Data Table on South Korea - Year-over-year growth 2024-2029 (%)
        • 13.16 Russia - Market size and forecast 2024-2029
          • Chart on Russia - Market size and forecast 2024-2029 ($ billion)
          • Data Table on Russia - Market size and forecast 2024-2029 ($ billion)
          • Chart on Russia - Year-over-year growth 2024-2029 (%)
          • Data Table on Russia - Year-over-year growth 2024-2029 (%)
        • 13.17 Australia - Market size and forecast 2024-2029
          • Chart on Australia - Market size and forecast 2024-2029 ($ billion)
          • Data Table on Australia - Market size and forecast 2024-2029 ($ billion)
          • Chart on Australia - Year-over-year growth 2024-2029 (%)
          • Data Table on Australia - Year-over-year growth 2024-2029 (%)
        • 13.18 Market opportunity by geography
          • Market opportunity by geography ($ billion)
          • Data Tables on Market opportunity by geography ($ billion)

        14 Drivers, Challenges, and Opportunity/Restraints

        • 14.1 Market drivers
          • 14.2 Market challenges
            • 14.3 Impact of drivers and challenges
              • Impact of drivers and challenges in 2024 and 2029
            • 14.4 Market opportunities/restraints

              15 Competitive Landscape

              • 15.1 Overview
                • 15.2 Competitive Landscape
                  • Overview on criticality of inputs and factors of differentiation
                • 15.3 Landscape disruption
                  • Overview on factors of disruption
                • 15.4 Industry risks
                  • Impact of key risks on business

                16 Competitive Analysis

                • 16.1 Companies profiled
                  • Companies covered
                • 16.2 Company ranking index
                  • Company ranking index
                • 16.3 Market positioning of companies
                  • Matrix on companies position and classification
                • 16.4 Bunge Ltd.
                  • Bunge Ltd. - Overview
                  • Bunge Ltd. - Business segments
                  • Bunge Ltd. - Key news
                  • Bunge Ltd. - Key offerings
                  • Bunge Ltd. - Segment focus
                  • SWOT
                • 16.5 CF Industries Holdings Inc.
                  • CF Industries Holdings Inc. - Overview
                  • CF Industries Holdings Inc. - Business segments
                  • CF Industries Holdings Inc. - Key offerings
                  • CF Industries Holdings Inc. - Segment focus
                  • SWOT
                • 16.6 EuroChem Group AG
                  • EuroChem Group AG - Overview
                  • EuroChem Group AG - Product / Service
                  • EuroChem Group AG - Key offerings
                  • SWOT
                • 16.7 GUBRETAS
                  • GUBRETAS - Overview
                  • GUBRETAS - Product / Service
                  • GUBRETAS - Key offerings
                  • SWOT
                • 16.8 Haifa Negev technologies Ltd.
                  • Haifa Negev technologies Ltd. - Overview
                  • Haifa Negev technologies Ltd. - Product / Service
                  • Haifa Negev technologies Ltd. - Key offerings
                  • SWOT
                • 16.9 Israel Chemicals Ltd.
                  • Israel Chemicals Ltd. - Overview
                  • Israel Chemicals Ltd. - Business segments
                  • Israel Chemicals Ltd. - Key offerings
                  • Israel Chemicals Ltd. - Segment focus
                  • SWOT
                • 16.10 Indian Farmers Fertiliser Cooperative Ltd.
                  • Indian Farmers Fertiliser Cooperative Ltd. - Overview
                  • Indian Farmers Fertiliser Cooperative Ltd. - Product / Service
                  • Indian Farmers Fertiliser Cooperative Ltd. - Key offerings
                  • SWOT
                • 16.11 KS Aktiengesellschaft
                  • KS Aktiengesellschaft - Overview
                  • KS Aktiengesellschaft - Product / Service
                  • KS Aktiengesellschaft - Key offerings
                  • SWOT
                • 16.12 Nutrien Ltd.
                  • Nutrien Ltd. - Overview
                  • Nutrien Ltd. - Business segments
                  • Nutrien Ltd. - Key offerings
                  • Nutrien Ltd. - Segment focus
                  • SWOT
                • 16.13 PhosAgro Group of Companies
                  • PhosAgro Group of Companies - Overview
                  • PhosAgro Group of Companies - Product / Service
                  • PhosAgro Group of Companies - Key offerings
                  • SWOT
                • 16.14 SQM S.A.
                  • SQM S.A. - Overview
                  • SQM S.A. - Business segments
                  • SQM S.A. - Key news
                  • SQM S.A. - Key offerings
                  • SQM S.A. - Segment focus
                  • SWOT
                • 16.15 Sumitomo Chemical Co. Ltd.
                  • Sumitomo Chemical Co. Ltd. - Overview
                  • Sumitomo Chemical Co. Ltd. - Business segments
                  • Sumitomo Chemical Co. Ltd. - Key offerings
                  • Sumitomo Chemical Co. Ltd. - Segment focus
                  • SWOT
                • 16.16 Syngenta Crop Protection AG
                  • Syngenta Crop Protection AG - Overview
                  • Syngenta Crop Protection AG - Product / Service
                  • Syngenta Crop Protection AG - Key offerings
                  • SWOT
                • 16.17 Unikeyterra Kimya Tarim
                  • Unikeyterra Kimya Tarim - Overview
                  • Unikeyterra Kimya Tarim - Product / Service
                  • Unikeyterra Kimya Tarim - Key offerings
                  • SWOT
                • 16.18 Yara International ASA
                  • Yara International ASA - Overview
                  • Yara International ASA - Business segments
                  • Yara International ASA - Key offerings
                  • Yara International ASA - Segment focus
                  • SWOT

                17 Appendix

                • 17.1 Scope of the report
                  • 17.2 Inclusions and exclusions checklist
                    • Inclusions checklist
                    • Exclusions checklist
                  • 17.3 Currency conversion rates for US$
                    • Currency conversion rates for US$
                  • 17.4 Research methodology
                    • Research methodology
                  • 17.5 Data procurement
                    • Information sources
                  • 17.6 Data validation
                    • Data validation
                  • 17.7 Validation techniques employed for market sizing
                    • Validation techniques employed for market sizing
                  • 17.8 Data synthesis
                    • Data synthesis
                  • 17.9 360 degree market analysis
                    • 360 degree market analysis
                  • 17.10 List of abbreviations
                    • List of abbreviations

                  Research Methodology

                  Technavio presents a detailed picture of the market by way of study, synthesis, and summation of data from multiple sources. The analysts have presented the various facets of the market with a particular focus on identifying the key industry influencers. The data thus presented is comprehensive, reliable, and the result of extensive research, both primary and secondary.

                  INFORMATION SOURCES

                  Primary sources

                  • Manufacturers and suppliers
                  • Channel partners
                  • Industry experts
                  • Strategic decision makers

                  Secondary sources

                  • Industry journals and periodicals
                  • Government data
                  • Financial reports of key industry players
                  • Historical data
                  • Press releases

                  DATA ANALYSIS

                  Data Synthesis

                  • Collation of data
                  • Estimation of key figures
                  • Analysis of derived insights

                  Data Validation

                  • Triangulation with data models
                  • Reference against proprietary databases
                  • Corroboration with industry experts

                  REPORT WRITING

                  Qualitative

                  • Market drivers
                  • Market challenges
                  • Market trends
                  • Five forces analysis

                  Quantitative

                  • Market size and forecast
                  • Market segmentation
                  • Geographical insights
                  • Competitive landscape

                  Interested in this report?

                  Get your sample now to see our research methodology and insights!

                  Download Now

                  Frequently Asked Questions

                  Fertilizers market growth will increase by $ 24.7 bn during 2025-2029.

                  The Fertilizers market is expected to grow at a CAGR of 2.2% during 2025-2029.

                  Fertilizers market is segmented by Type( Inorganic, Organic) Application( Agriculture, Horticulture, Gardening) Product Type( Dry, Liquid, Europe, South America, Middle East and Africa)

                  Bunge Ltd., CF Industries Holdings Inc., EuroChem Group AG, GUBRETAS, Haifa Negev technologies Ltd., Israel Chemicals Ltd., Indian Farmers Fertiliser Cooperative Ltd., KS Aktiengesellschaft, Nufarm Ltd., Nutrien Ltd., OCP Group, PhosAgro Group of Companies, SQM S.A., Sumitomo Chemical Co. Ltd., Syngenta Crop Protection AG, Unikeyterra Kimya Tarim, Yara International ASA are a few of the key vendors in the Fertilizers market.

                  APAC will register the highest growth rate of 42% among the other regions. Therefore, the Fertilizers market in APAC is expected to garner significant business opportunities for the vendors during the forecast period.

                  China, US, India, Japan, France, Canada, Brazil, South Korea, Russia, Australia

                  • Rising demand for organic fertilizersOrganic fertilizers are safer for the environment is the driving factor this market.
                  • animals is the driving factor this market.
                  • and soil that come into contact with them because they degrade rapidly and do not adversely affect surface and groundwater. Organic fertilizers have a long shelf life is the driving factor this market.
                  • improve soil structure and increase the soils ability to retain nutrients and water. They are non-toxic is the driving factor this market.
                  • slow-release fertilizers that leave no residue in food and are therefore preferred for producing residue-free produce. Following population growth is the driving factor this market.
                  • dietary habits will change in both developed and developing countries is the driving factor this market.
                  • contributing to the growth of the global fertilizers market during the forecast period. With government support is the driving factor this market.
                  • the use of organic fertilizers will improve human health and soil. The growth of the organic fertilizer segment is the driving factor this market.
                  • coupled with the growing awareness of its positive impact on quality is the driving factor this market.
                  • is driving the growth of the global fertilizers market. Additionally is the driving factor this market.
                  • the enforcement of strict regulations on the use of synthetic fertilizers presents lucrative growth opportunities for market participants. Using animal waste as organic fertilizer remains the primary choice for the organic fertilizer manufacturer. Thus is the driving factor this market.
                  • due to the rising demand for organic fertilizer is the driving factor this market.
                  • the global fertilizers market is expected to witness high growth during the forecast period. is the driving factor this market.

                  The Fertilizers market vendors should focus on grabbing business opportunities from the Inorganic segment as it accounted for the largest market share in the base year.