Ferric Chloride Market Analysis, Size, and Forecast 2026-2030: Europe (Germany, UK, and France), North America (US, Canada, and Mexico), APAC (China, Japan, and India), South America (Brazil, Argentina, and Colombia), Middle East and Africa (Saudi Arabia, UAE, and South Africa), and Rest of World (ROW)

Ferric Chloride Market Analysis, Size, and Forecast 2026-2030:
Europe (Germany, UK, and France), North America (US, Canada, and Mexico), APAC (China, Japan, and India), South America (Brazil, Argentina, and Colombia), Middle East and Africa (Saudi Arabia, UAE, and South Africa), and Rest of World (ROW)

Published: Jan 2026 291 Pages SKU: IRTNTR74066

Market Overview at a Glance

$174.2 Mn
Market Opportunity
5.3%
CAGR 2025 - 2030
35.8%
Europe Growth
$223.2 Mn
Water and wastewater segment 2024

Ferric Chloride Market Size 2026-2030

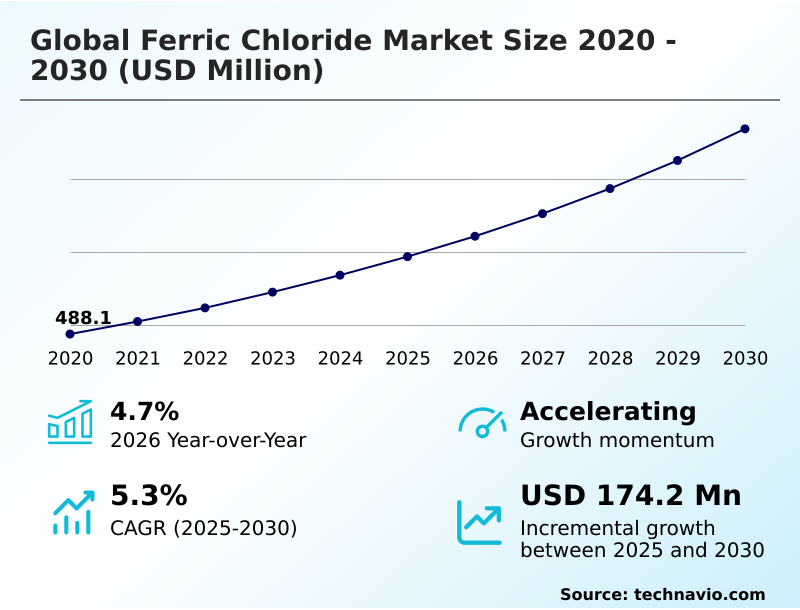
The ferric chloride market size is valued to increase by USD 174.2 million, at a CAGR of 5.3% from 2025 to 2030. Rising demand for wastewater re-use will drive the ferric chloride market.

Major Market Trends & Insights

  • Europe dominated the market and accounted for a 35.8% growth during the forecast period.
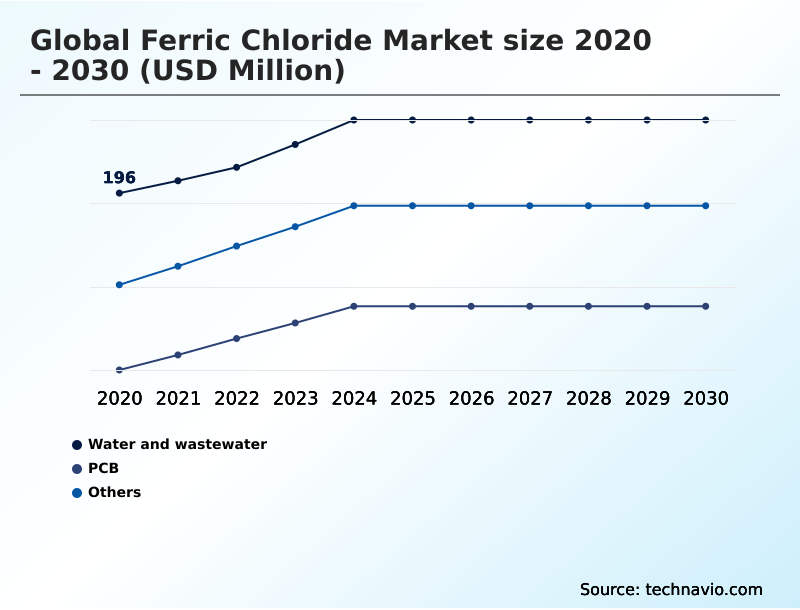
  • By Application - Water and wastewater segment was valued at USD 223.2 million in 2024
  • By Type - Liquid ferric chloride segment accounted for the largest market revenue share in 2024

Market Size & Forecast

  • Market Opportunities: USD 279.8 million
  • Market Future Opportunities: USD 174.2 million
  • CAGR from 2025 to 2030 : 5.3%

Market Summary

  • The ferric chloride market is experiencing steady expansion, primarily propelled by its critical role in municipal water purification and industrial effluent treatment. Escalating global demand for clean water, coupled with stringent environmental regulations governing wastewater discharge, underpins the consistent need for effective coagulants.
  • Ferric chloride is favored for its high efficiency in phosphorus precipitation and removal of suspended solids, making it indispensable for utilities striving to prevent eutrophication of natural water bodies. In the industrial sector, its application extends beyond water treatment to being a vital etching agent in the manufacturing of printed circuit boards (PCBs) for the burgeoning electronics industry.
  • For instance, a electronics manufacturing firm can leverage high-purity ferric chloride to achieve finer circuit patterns, directly improving production yields and the performance of high-density components. This dual-purpose utility, spanning from large-scale environmental management to high-tech manufacturing, ensures its continued market relevance.
  • However, the industry also navigates challenges from emerging substitute chemicals and advanced filtration technologies that aim to reduce chemical dependency in treatment processes.

What will be the Size of the Ferric Chloride Market during the forecast period?

Get Key Insights on Market Forecast (PDF) Request Free Sample

How is the Ferric Chloride Market Segmented?

The ferric chloride industry research report provides comprehensive data (region-wise segment analysis), with forecasts and estimates in "USD million" for the period 2026-2030, as well as historical data from 2020-2024 for the following segments.

  • Application
    • Water and wastewater
    • PCB
    • Others
  • Type
    • Liquid ferric chloride
    • Solid ferric chloride
    • Ferric chloride hexahydrate
  • Grade type
    • Water treatment grade
    • Electronic grade
    • Industrial grade
  • Geography
    • Europe
      • Germany
      • UK
      • France
    • North America
      • US
      • Canada
      • Mexico
    • APAC
      • China
      • Japan
      • India
    • South America
      • Brazil
      • Argentina
      • Colombia
    • Middle East and Africa
      • Saudi Arabia
      • UAE
      • South Africa
    • Rest of World (ROW)

By Application Insights

The water and wastewater segment is estimated to witness significant growth during the forecast period.

The water and wastewater sector remains the primary application, driven by the need for effective water treatment chemicals in municipal wastewater treatment.

The use of ferric chloride coagulant is essential for the wastewater coagulation process, particularly for phosphorus precipitation chemical applications to meet stringent environmental standards.

As part of sustainable water management and urban water management strategies, this trivalent iron salt is critical for raw water clarification agent duties and final effluent polishing chemical stages.

Its efficiency in suspended solids removal ensures that effluent treatment plant chemicals meet discharge compliance, with many facilities achieving over 95% phosphorus removal, demonstrating its vital role in protecting surface water treatment systems and public health.

Request Free Sample

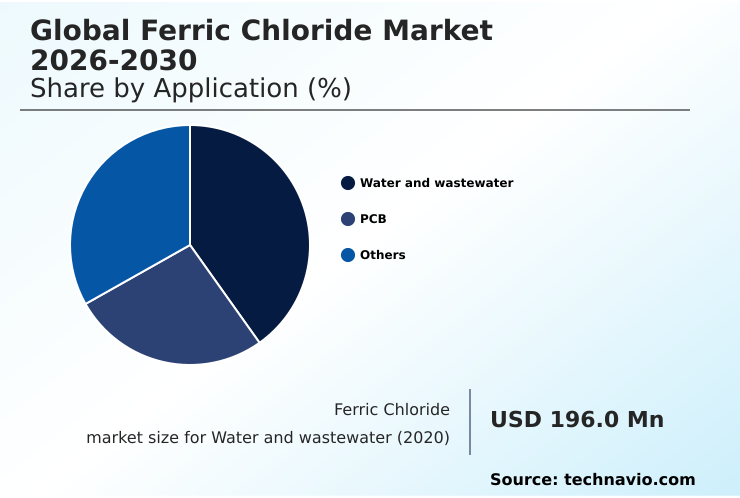
The Water and wastewater segment was valued at USD 223.2 million in 2024 and showed a gradual increase during the forecast period.

Request Free Sample

Regional Analysis

Europe is estimated to contribute 35.8% to the growth of the global market during the forecast period.Technavio’s analysts have elaborately explained the regional trends and drivers that shape the market during the forecast period.

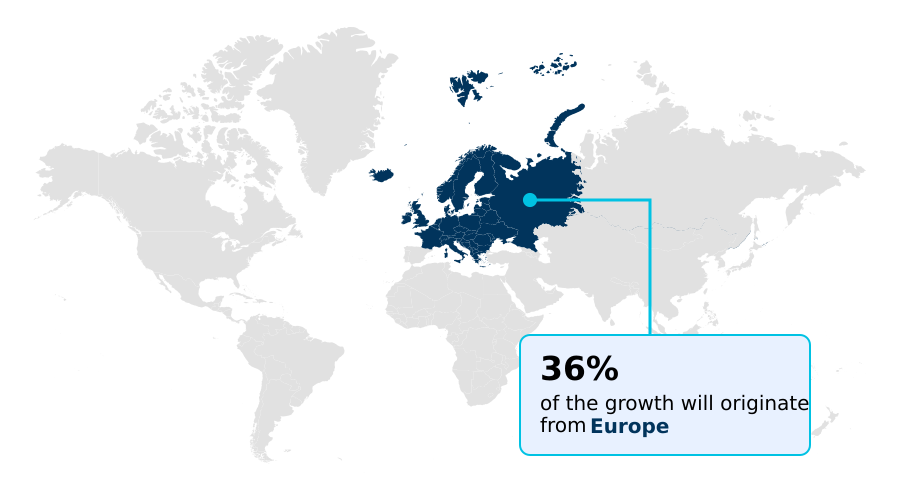
See How Ferric Chloride Market Demand is Rising in Europe Request Free Sample

The geographic landscape is led by mature markets in Europe, which accounts for over 35% of the market opportunity, driven by stringent environmental regulations. APAC follows, contributing more than 28% to demand, fueled by industrialization and infrastructure development.

In these regions, liquid ferric chloride solution is essential for large-scale drinking water purification chemical applications and in pulp and paper industry chemicals.

The use of ferric chloride as a hydrogen sulfide control agent is critical for odor control chemicals in dense urban areas, supporting public health initiatives.

Its role as a eutrophication control chemical through advanced nutrient removal technology is vital for protecting surface water treatment resources.

The increasing adoption of water reuse coagulant strategies and bio-solid conditioning agent applications further defines regional market dynamics, especially in water-scarce areas demanding advanced wastewater treatment for industrial process water.

Market Dynamics

Our researchers analyzed the data with 2025 as the base year, along with the key drivers, trends, and challenges. A holistic analysis of drivers will help companies refine their marketing strategies to gain a competitive advantage.

  • A comprehensive cost analysis of ferric chloride water treatment reveals its continued value, especially when comparing ferric chloride versus aluminum sulfate efficiency. The role of ferric chloride in phosphorus removal is a key advantage, with optimized systems demonstrating superior performance.
  • Decisions regarding optimizing ferric chloride dosage in wastewater are critical for plant operators, as this directly influences the effectiveness of ferric chloride for heavy metal precipitation and the overall efficiency of ferric chloride in sludge dewatering processes. The impact of pH on ferric chloride coagulation must also be managed for consistent results.
  • In industrial settings, the use of high purity ferric chloride for PCB etching is non-negotiable for quality, while the potential for ferric chloride regeneration from spent etchant offers a path to sustainability. The application of anhydrous ferric chloride as a chemical catalyst highlights its versatility. Safety remains paramount, with strict protocols for the safe handling and storage of ferric chloride.
  • Other applications, including ferric chloride applications in pigment production, the use of ferric chloride for hydrogen sulfide control, and its role in ferric chloride for industrial color removal, broaden its market footprint.
  • Whether for ferric chloride for COD and BOD reduction, ferric chloride for textile dye removal, or ferric chloride in mining water management, the choice between solid versus liquid ferric chloride comparison often comes down to logistics and specific operational needs.
  • When using ferric chloride in drinking water plants, its ability to clarify raw water in ferric chloride in industrial effluent clarification processes is unmatched, with some facilities reducing turbidity levels twice as fast as with alternative coagulants.

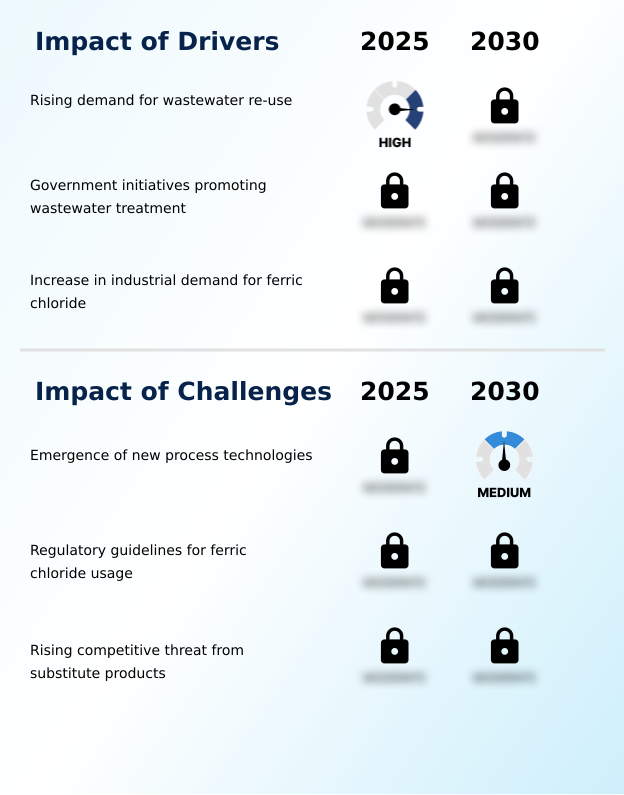
What are the key market drivers leading to the rise in the adoption of Ferric Chloride Industry?

  • The rising demand for wastewater reuse, driven by increasing water scarcity and stricter environmental regulations, is a key factor propelling market growth.

  • The market's growth is fundamentally driven by the need for robust industrial water purification and effective industrial effluent treatment chemical solutions.
  • Stringent regulations mandate the use of environmental compliance coagulants, pushing industries toward zero liquid discharge systems and greater use of wastewater recycling chemical technologies.
  • In heavy industry water solutions, such as oil and gas water treatment and textile effluent treatment, ferric chloride is used as a primary industrial coagulant for chemical oxygen demand reduction and as a color removal coagulant.
  • Its application as one of the key corrosion inhibitor chemicals also extends equipment lifespan, reducing operational downtime by 10%. Effective heavy metal removal agent capabilities ensure facilities consistently meet discharge limits, a critical factor for sustained operations.

What are the market trends shaping the Ferric Chloride Industry?

  • The market is observing a growing preference for spot basis pricing for ferric chloride. This model offers buyers greater procurement flexibility in response to volatile economic conditions and fluctuating raw material costs.

  • Emerging trends are reshaping the market, particularly in printed circuit board manufacturing. The demand for high-purity etching solutions and effective PCB etching agent formulations is intensifying within the electronics industry chemicals. Innovations in circular economy chemicals are leading to advancements like spent pickle liquor recovery, which lowers production costs by over 15%.
  • This creates more efficient metal finishing chemicals and improves supply chain sustainability. As a Lewis acid catalyst, ferric chloride is also finding new roles in advanced synthesis.
  • Manufacturers are developing sophisticated coagulant dosing systems and new copper etching chemical processes that enhance etching precision by up to 10%, supporting the miniaturization trend in microelectronics fabrication chemicals and advanced metal surface treatment agent applications.

What challenges does the Ferric Chloride Industry face during its growth?

  • The emergence of new, sustainable process technologies in wastewater treatment presents a significant challenge to the traditional demand for chemical coagulants.

  • The market faces challenges from advanced wastewater treatment solutions, including systems that offer biological wastewater treatment support and reduce reliance on traditional chemicals. These alternatives can decrease sludge volume by up to 30%, posing a competitive threat to the conventional coagulation-flocculation process.
  • Furthermore, the inherent risks associated with corrosive chemical handling and the management of anhydrous ferric chloride powder add operational complexity and cost, with handling expenses increasing by 15% in some highly regulated areas. A constant solid vs liquid ferric chloride comparison by end-users in sectors like leather tanning wastewater treatment and food processing wastewater solutions also influences purchasing decisions.
  • While inorganic flocculant and sludge conditioning chemical products remain essential, the industry must innovate to stay competitive against new technologies in mining process water chemicals and desalination pre-treatment chemicals.

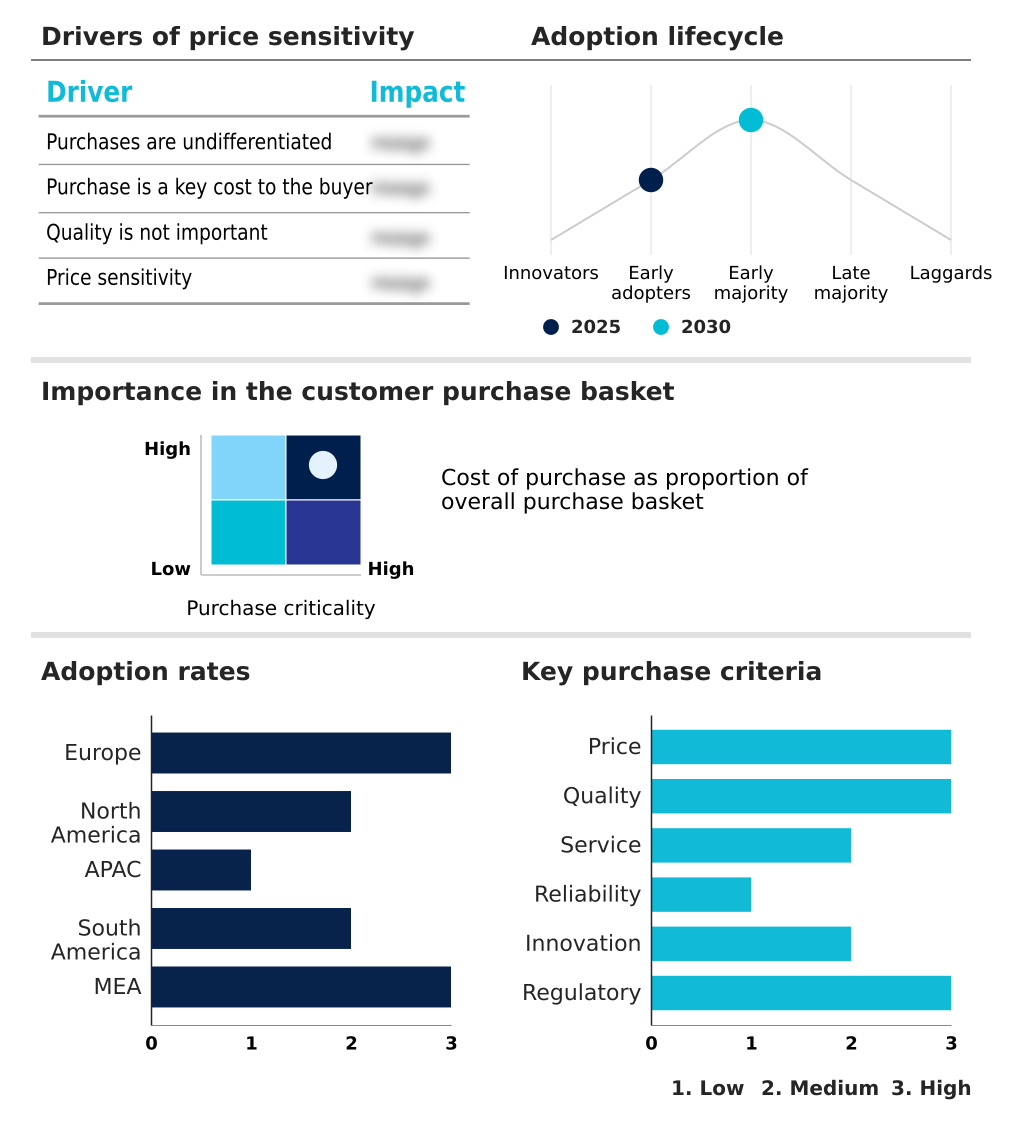
Exclusive Technavio Analysis on Customer Landscape

The ferric chloride market forecasting report includes the adoption lifecycle of the market, covering from the innovator’s stage to the laggard’s stage. It focuses on adoption rates in different regions based on penetration. Furthermore, the ferric chloride market report also includes key purchase criteria and drivers of price sensitivity to help companies evaluate and develop their market growth analysis strategies.

Customer Landscape of Ferric Chloride Industry

Competitive Landscape

Companies are implementing various strategies, such as strategic alliances, ferric chloride market forecast, partnerships, mergers and acquisitions, geographical expansion, and product/service launches, to enhance their presence in the industry.

Acuro Organics Ltd. - Offers liquid and anhydrous ferric chloride grades for water treatment and etching applications, addressing both municipal and industrial needs.

The industry research and growth report includes detailed analyses of the competitive landscape of the market and information about key companies, including:

  • Acuro Organics Ltd.
  • Avantor Inc.
  • BASF SE
  • Chemical Company of Malaysia Bhd
  • Chemifloc Ltd.
  • Chemtrade Logistics Income Fund
  • ECHEMI Digital Tech Co. Ltd.
  • Feralco AB
  • Kemira Oyj
  • Prime Chemicals
  • PVS Chemicals Inc.
  • SC Chimcomplex SA Borzesti
  • SIDRA Wasserchemie GmbH
  • Sukha Chemical Industries
  • Tessenderlo Group NV
  • Vinayak Industries

Qualitative and quantitative analysis of companies has been conducted to help clients understand the wider business environment as well as the strengths and weaknesses of key industry players. Data is qualitatively analyzed to categorize companies as pure play, category-focused, industry-focused, and diversified; it is quantitatively analyzed to categorize companies as dominant, leading, strong, tentative, and weak.

Recent Development and News in Ferric chloride market

  • In August 2025, Hawkins Inc. announced an expansion of its Texas production facility to increase output capacity for liquid ferric chloride, targeting rising demand from the municipal water treatment sector in the Southern United States.
  • In September 2025, Kemira Oyj signed an agreement to acquire Water Engineering, Inc., a US-based service provider, to strengthen its industrial water treatment services and expand its footprint in the North American market.
  • In October 2025, BASF SE established a strategic partnership with a Texas-based electronics manufacturer to supply customized, high-purity ferric chloride grades, supporting the domestic semiconductor and PCB etching supply chain.
  • In May 2025, the European Commission adopted a revised annex to the Industrial Emissions Directive, implementing stricter limits on heavy metal discharge for chemical plants, which indirectly boosts demand for high-efficiency coagulants.

Dive into Technavio’s robust research methodology, blending expert interviews, extensive data synthesis, and validated models for unparalleled Ferric Chloride Market insights. See full methodology.

Market Scope
Page number 291
Base year 2025
Historic period 2020-2024
Forecast period 2026-2030
Growth momentum & CAGR Accelerate at a CAGR of 5.3%
Market growth 2026-2030 USD 174.2 million
Market structure Fragmented
YoY growth 2025-2026(%) 4.7%
Key countries Germany, UK, France, Italy, Spain, The Netherlands, US, Canada, Mexico, China, Japan, India, South Korea, Australia, Indonesia, Brazil, Argentina, Colombia, Saudi Arabia, UAE, South Africa, Israel and Turkey
Competitive landscape Leading Companies, Market Positioning of Companies, Competitive Strategies, and Industry Risks

Request Free Sample

Research Analyst Overview

  • The market’s value is rooted in its role across environmental and industrial sectors. As a primary ferric chloride coagulant, its function in the wastewater coagulation process is indispensable for phosphorus precipitation chemical targets, heavy metal removal agent duties, and suspended solids removal.
  • Liquid ferric chloride solution is standard for drinking water purification chemical needs, while the coagulation-flocculation process leverages this trivalent iron salt as an inorganic flocculant and eutrophication control chemical. Industrially, anhydrous ferric chloride powder is a potent Lewis acid catalyst and metal surface treatment agent; its use as a PCB etching agent for copper etching chemical processes is vital.
  • It is a key pigment manufacturing precursor in iron oxide pigment production. For waste, it is a sludge dewatering polymer, bio-solid conditioning agent, and sludge conditioning chemical, often using ferric chloride hexahydrate crystals.
  • Board-level focus is on securing this industrial coagulant, sometimes via spent pickle liquor recovery, for industrial effluent treatment chemical applications and wastewater recycling chemical goals, cutting processing time by 15%.
  • Its use as a hydrogen sulfide control agent, raw water clarification agent, and color removal coagulant for chemical oxygen demand reduction, supported by nutrient removal technology and corrosive chemical handling, confirms its value as an effluent polishing chemical and water reuse coagulant.

What are the Key Data Covered in this Ferric Chloride Market Research and Growth Report?

  • What is the expected growth of the Ferric Chloride Market between 2026 and 2030?

    • USD 174.2 million, at a CAGR of 5.3%

  • What segmentation does the market report cover?

    • The report is segmented by Application (Water and wastewater, PCB, and Others), Type (Liquid ferric chloride, Solid ferric chloride, and Ferric chloride hexahydrate), Grade Type (Water treatment grade, Electronic grade, and Industrial grade) and Geography (Europe, North America, APAC, South America, Middle East and Africa)

  • Which regions are analyzed in the report?

    • Europe, North America, APAC, South America and Middle East and Africa

  • What are the key growth drivers and market challenges?

    • Rising demand for wastewater re-use, Emergence of new process technologies

  • Who are the major players in the Ferric Chloride Market?

    • Acuro Organics Ltd., Avantor Inc., BASF SE, Chemical Company of Malaysia Bhd, Chemifloc Ltd., Chemtrade Logistics Income Fund, ECHEMI Digital Tech Co. Ltd., Feralco AB, Kemira Oyj, Prime Chemicals, PVS Chemicals Inc., SC Chimcomplex SA Borzesti, SIDRA Wasserchemie GmbH, Sukha Chemical Industries, Tessenderlo Group NV and Vinayak Industries

Market Research Insights

  • The market's dynamics are shaped by a strong focus on environmental compliance coagulants and sustainable water management. The adoption rate in municipal wastewater treatment continues to climb, with utilities reporting that advanced coagulant dosing systems can improve phosphorus removal efficiency by over 15% compared to older methods.
  • In industrial water purification, particularly within textile effluent treatment and heavy industry water solutions, the shift toward zero liquid discharge systems is a significant factor. Companies using integrated effluent treatment plant chemicals have demonstrated a reduction in non-compliance incidents by more than 40%.
  • The need for high-performance water treatment chemicals is paramount, as efficient industrial process water management remains a core operational goal for manufacturers worldwide.

We can help! Our analysts can customize this ferric chloride market research report to meet your requirements.

Get in touch

1. Executive Summary

1.1 Market overview

Executive Summary - Chart on Market Overview
Executive Summary - Data Table on Market Overview
Executive Summary - Chart on Global Market Characteristics
Executive Summary - Chart on Market by Geography
Executive Summary - Chart on Market Segmentation by Application
Executive Summary - Chart on Market Segmentation by Type
Executive Summary - Chart on Market Segmentation by Grade Type
Executive Summary - Chart on Incremental Growth
Executive Summary - Data Table on Incremental Growth
Executive Summary - Chart on Company Market Positioning

2. Technavio Analysis

2.1 Analysis of price sensitivity, lifecycle, customer purchase basket, adoption rates, and purchase criteria

2.2 Criticality of inputs and Factors of differentiation

Chart on Overview on criticality of inputs and factors of differentiation

2.3 Factors of disruption

Chart on Overview on factors of disruption

2.4 Impact of drivers and challenges

Chart on Impact of drivers and challenges in 2025 and 2030

3. Market Landscape

3.1 Market ecosystem

Chart on Parent Market
Data Table on - Parent Market

3.2 Market characteristics

Chart on Market characteristics analysis

3.3 Value chain analysis

Chart on Value chain analysis

4. Market Sizing

4.1 Market definition

Data Table on Offerings of companies included in the market definition

4.2 Market segment analysis

Market segments

4.3 Market size 2025

4.4 Market outlook: Forecast for 2025-2030

Chart on Global - Market size and forecast 2025-2030 ($ million)
Data Table on Global - Market size and forecast 2025-2030 ($ million)
Chart on Global Market: Year-over-year growth 2025-2030 (%)
Data Table on Global Market: Year-over-year growth 2025-2030 (%)

5. Historic Market Size

5.1 Global Ferric Chloride Market 2020 - 2024

Historic Market Size - Data Table on Global Ferric Chloride Market 2020 - 2024 ($ million)

5.2 Application segment analysis 2020 - 2024

Historic Market Size - Application Segment 2020 - 2024 ($ million)

5.3 Type segment analysis 2020 - 2024

Historic Market Size - Type Segment 2020 - 2024 ($ million)

5.4 Grade Type segment analysis 2020 - 2024

Historic Market Size - Grade Type Segment 2020 - 2024 ($ million)

5.5 Geography segment analysis 2020 - 2024

Historic Market Size - Geography Segment 2020 - 2024 ($ million)

5.6 Country segment analysis 2020 - 2024

Historic Market Size - Country Segment 2020 - 2024 ($ million)

6. Qualitative Analysis

6.1 Impact of AI in global ferric chloride market

7. Five Forces Analysis

7.1 Five forces summary

Five forces analysis - Comparison between 2025 and 2030

7.2 Bargaining power of buyers

Bargaining power of buyers - Impact of key factors 2025 and 2030

7.3 Bargaining power of suppliers

Bargaining power of suppliers - Impact of key factors in 2025 and 2030

7.4 Threat of new entrants

Threat of new entrants - Impact of key factors in 2025 and 2030

7.5 Threat of substitutes

Threat of substitutes - Impact of key factors in 2025 and 2030

7.6 Threat of rivalry

Threat of rivalry - Impact of key factors in 2025 and 2030

7.7 Market condition

Chart on Market condition - Five forces 2025 and 2030

8. Market Segmentation by Application

8.1 Market segments

Chart on Application - Market share 2025-2030 (%)
Data Table on Application - Market share 2025-2030 (%)

8.2 Comparison by Application

Chart on Comparison by Application
Data Table on Comparison by Application

8.3 Water and wastewater - Market size and forecast 2025-2030

Chart on Water and wastewater - Market size and forecast 2025-2030 ($ million)
Data Table on Water and wastewater - Market size and forecast 2025-2030 ($ million)
Chart on Water and wastewater - Year-over-year growth 2025-2030 (%)
Data Table on Water and wastewater - Year-over-year growth 2025-2030 (%)

8.4 PCB - Market size and forecast 2025-2030

Chart on PCB - Market size and forecast 2025-2030 ($ million)
Data Table on PCB - Market size and forecast 2025-2030 ($ million)
Chart on PCB - Year-over-year growth 2025-2030 (%)
Data Table on PCB - Year-over-year growth 2025-2030 (%)

8.5 Others - Market size and forecast 2025-2030

Chart on Others - Market size and forecast 2025-2030 ($ million)
Data Table on Others - Market size and forecast 2025-2030 ($ million)
Chart on Others - Year-over-year growth 2025-2030 (%)
Data Table on Others - Year-over-year growth 2025-2030 (%)

8.6 Market opportunity by Application

Market opportunity by Application ($ million)
Data Table on Market opportunity by Application ($ million)

9. Market Segmentation by Type

9.1 Market segments

Chart on Type - Market share 2025-2030 (%)
Data Table on Type - Market share 2025-2030 (%)

9.2 Comparison by Type

Chart on Comparison by Type
Data Table on Comparison by Type

9.3 Liquid ferric chloride - Market size and forecast 2025-2030

Chart on Liquid ferric chloride - Market size and forecast 2025-2030 ($ million)
Data Table on Liquid ferric chloride - Market size and forecast 2025-2030 ($ million)
Chart on Liquid ferric chloride - Year-over-year growth 2025-2030 (%)
Data Table on Liquid ferric chloride - Year-over-year growth 2025-2030 (%)

9.4 Solid ferric chloride - Market size and forecast 2025-2030

Chart on Solid ferric chloride - Market size and forecast 2025-2030 ($ million)
Data Table on Solid ferric chloride - Market size and forecast 2025-2030 ($ million)
Chart on Solid ferric chloride - Year-over-year growth 2025-2030 (%)
Data Table on Solid ferric chloride - Year-over-year growth 2025-2030 (%)

9.5 Ferric chloride hexahydrate - Market size and forecast 2025-2030

Chart on Ferric chloride hexahydrate - Market size and forecast 2025-2030 ($ million)
Data Table on Ferric chloride hexahydrate - Market size and forecast 2025-2030 ($ million)
Chart on Ferric chloride hexahydrate - Year-over-year growth 2025-2030 (%)
Data Table on Ferric chloride hexahydrate - Year-over-year growth 2025-2030 (%)

9.6 Market opportunity by Type

Market opportunity by Type ($ million)
Data Table on Market opportunity by Type ($ million)

10. Market Segmentation by Grade Type

10.1 Market segments

Chart on Grade Type - Market share 2025-2030 (%)
Data Table on Grade Type - Market share 2025-2030 (%)

10.2 Comparison by Grade Type

Chart on Comparison by Grade Type
Data Table on Comparison by Grade Type

10.3 Water treatment grade - Market size and forecast 2025-2030

Chart on Water treatment grade - Market size and forecast 2025-2030 ($ million)
Data Table on Water treatment grade - Market size and forecast 2025-2030 ($ million)
Chart on Water treatment grade - Year-over-year growth 2025-2030 (%)
Data Table on Water treatment grade - Year-over-year growth 2025-2030 (%)

10.4 Electronic grade - Market size and forecast 2025-2030

Chart on Electronic grade - Market size and forecast 2025-2030 ($ million)
Data Table on Electronic grade - Market size and forecast 2025-2030 ($ million)
Chart on Electronic grade - Year-over-year growth 2025-2030 (%)
Data Table on Electronic grade - Year-over-year growth 2025-2030 (%)

10.5 Industrial grade - Market size and forecast 2025-2030

Chart on Industrial grade - Market size and forecast 2025-2030 ($ million)
Data Table on Industrial grade - Market size and forecast 2025-2030 ($ million)
Chart on Industrial grade - Year-over-year growth 2025-2030 (%)
Data Table on Industrial grade - Year-over-year growth 2025-2030 (%)

10.6 Market opportunity by Grade Type

Market opportunity by Grade Type ($ million)
Data Table on Market opportunity by Grade Type ($ million)

11. Customer Landscape

11.1 Customer landscape overview

Analysis of price sensitivity, lifecycle, customer purchase basket, adoption rates, and purchase criteria

12. Geographic Landscape

12.1 Geographic segmentation

Chart on Market share by geography 2025-2030 (%)
Data Table on Market share by geography 2025-2030 (%)

12.2 Geographic comparison

Chart on Geographic comparison
Data Table on Geographic comparison

12.3 Europe - Market size and forecast 2025-2030

Chart on Europe - Market size and forecast 2025-2030 ($ million)
Data Table on Europe - Market size and forecast 2025-2030 ($ million)
Chart on Europe - Year-over-year growth 2025-2030 (%)
Data Table on Europe - Year-over-year growth 2025-2030 (%)
Chart on Regional Comparison - Europe
Data Table on Regional Comparison - Europe

12.3.1 Germany - Market size and forecast 2025-2030

Chart on Germany - Market size and forecast 2025-2030 ($ million)
Data Table on Germany - Market size and forecast 2025-2030 ($ million)
Chart on Germany - Year-over-year growth 2025-2030 (%)
Data Table on Germany - Year-over-year growth 2025-2030 (%)

12.3.2 UK - Market size and forecast 2025-2030

Chart on UK - Market size and forecast 2025-2030 ($ million)
Data Table on UK - Market size and forecast 2025-2030 ($ million)
Chart on UK - Year-over-year growth 2025-2030 (%)
Data Table on UK - Year-over-year growth 2025-2030 (%)

12.3.3 France - Market size and forecast 2025-2030

Chart on France - Market size and forecast 2025-2030 ($ million)
Data Table on France - Market size and forecast 2025-2030 ($ million)
Chart on France - Year-over-year growth 2025-2030 (%)
Data Table on France - Year-over-year growth 2025-2030 (%)

12.3.4 Italy - Market size and forecast 2025-2030

Chart on Italy - Market size and forecast 2025-2030 ($ million)
Data Table on Italy - Market size and forecast 2025-2030 ($ million)
Chart on Italy - Year-over-year growth 2025-2030 (%)
Data Table on Italy - Year-over-year growth 2025-2030 (%)

12.3.5 Spain - Market size and forecast 2025-2030

Chart on Spain - Market size and forecast 2025-2030 ($ million)
Data Table on Spain - Market size and forecast 2025-2030 ($ million)
Chart on Spain - Year-over-year growth 2025-2030 (%)
Data Table on Spain - Year-over-year growth 2025-2030 (%)

12.3.6 The Netherlands - Market size and forecast 2025-2030

Chart on The Netherlands - Market size and forecast 2025-2030 ($ million)
Data Table on The Netherlands - Market size and forecast 2025-2030 ($ million)
Chart on The Netherlands - Year-over-year growth 2025-2030 (%)
Data Table on The Netherlands - Year-over-year growth 2025-2030 (%)

12.4 North America - Market size and forecast 2025-2030

Chart on North America - Market size and forecast 2025-2030 ($ million)
Data Table on North America - Market size and forecast 2025-2030 ($ million)
Chart on North America - Year-over-year growth 2025-2030 (%)
Data Table on North America - Year-over-year growth 2025-2030 (%)
Chart on Regional Comparison - North America
Data Table on Regional Comparison - North America

12.4.1 US - Market size and forecast 2025-2030

Chart on US - Market size and forecast 2025-2030 ($ million)
Data Table on US - Market size and forecast 2025-2030 ($ million)
Chart on US - Year-over-year growth 2025-2030 (%)
Data Table on US - Year-over-year growth 2025-2030 (%)

12.4.2 Canada - Market size and forecast 2025-2030

Chart on Canada - Market size and forecast 2025-2030 ($ million)
Data Table on Canada - Market size and forecast 2025-2030 ($ million)
Chart on Canada - Year-over-year growth 2025-2030 (%)
Data Table on Canada - Year-over-year growth 2025-2030 (%)

12.4.3 Mexico - Market size and forecast 2025-2030

Chart on Mexico - Market size and forecast 2025-2030 ($ million)
Data Table on Mexico - Market size and forecast 2025-2030 ($ million)
Chart on Mexico - Year-over-year growth 2025-2030 (%)
Data Table on Mexico - Year-over-year growth 2025-2030 (%)

12.5 APAC - Market size and forecast 2025-2030

Chart on APAC - Market size and forecast 2025-2030 ($ million)
Data Table on APAC - Market size and forecast 2025-2030 ($ million)
Chart on APAC - Year-over-year growth 2025-2030 (%)
Data Table on APAC - Year-over-year growth 2025-2030 (%)
Chart on Regional Comparison - APAC
Data Table on Regional Comparison - APAC

12.5.1 China - Market size and forecast 2025-2030

Chart on China - Market size and forecast 2025-2030 ($ million)
Data Table on China - Market size and forecast 2025-2030 ($ million)
Chart on China - Year-over-year growth 2025-2030 (%)
Data Table on China - Year-over-year growth 2025-2030 (%)

12.5.2 Japan - Market size and forecast 2025-2030

Chart on Japan - Market size and forecast 2025-2030 ($ million)
Data Table on Japan - Market size and forecast 2025-2030 ($ million)
Chart on Japan - Year-over-year growth 2025-2030 (%)
Data Table on Japan - Year-over-year growth 2025-2030 (%)

12.5.3 India - Market size and forecast 2025-2030

Chart on India - Market size and forecast 2025-2030 ($ million)
Data Table on India - Market size and forecast 2025-2030 ($ million)
Chart on India - Year-over-year growth 2025-2030 (%)
Data Table on India - Year-over-year growth 2025-2030 (%)

12.5.4 South Korea - Market size and forecast 2025-2030

Chart on South Korea - Market size and forecast 2025-2030 ($ million)
Data Table on South Korea - Market size and forecast 2025-2030 ($ million)
Chart on South Korea - Year-over-year growth 2025-2030 (%)
Data Table on South Korea - Year-over-year growth 2025-2030 (%)

12.5.5 Australia - Market size and forecast 2025-2030

Chart on Australia - Market size and forecast 2025-2030 ($ million)
Data Table on Australia - Market size and forecast 2025-2030 ($ million)
Chart on Australia - Year-over-year growth 2025-2030 (%)
Data Table on Australia - Year-over-year growth 2025-2030 (%)

12.5.6 Indonesia - Market size and forecast 2025-2030

Chart on Indonesia - Market size and forecast 2025-2030 ($ million)
Data Table on Indonesia - Market size and forecast 2025-2030 ($ million)
Chart on Indonesia - Year-over-year growth 2025-2030 (%)
Data Table on Indonesia - Year-over-year growth 2025-2030 (%)

12.6 South America - Market size and forecast 2025-2030

Chart on South America - Market size and forecast 2025-2030 ($ million)
Data Table on South America - Market size and forecast 2025-2030 ($ million)
Chart on South America - Year-over-year growth 2025-2030 (%)
Data Table on South America - Year-over-year growth 2025-2030 (%)
Chart on Regional Comparison - South America
Data Table on Regional Comparison - South America

12.6.1 Brazil - Market size and forecast 2025-2030

Chart on Brazil - Market size and forecast 2025-2030 ($ million)
Data Table on Brazil - Market size and forecast 2025-2030 ($ million)
Chart on Brazil - Year-over-year growth 2025-2030 (%)
Data Table on Brazil - Year-over-year growth 2025-2030 (%)

12.6.2 Argentina - Market size and forecast 2025-2030

Chart on Argentina - Market size and forecast 2025-2030 ($ million)
Data Table on Argentina - Market size and forecast 2025-2030 ($ million)
Chart on Argentina - Year-over-year growth 2025-2030 (%)
Data Table on Argentina - Year-over-year growth 2025-2030 (%)

12.6.3 Colombia - Market size and forecast 2025-2030

Chart on Colombia - Market size and forecast 2025-2030 ($ million)
Data Table on Colombia - Market size and forecast 2025-2030 ($ million)
Chart on Colombia - Year-over-year growth 2025-2030 (%)
Data Table on Colombia - Year-over-year growth 2025-2030 (%)

12.7 Middle East and Africa - Market size and forecast 2025-2030

Chart on Middle East and Africa - Market size and forecast 2025-2030 ($ million)
Data Table on Middle East and Africa - Market size and forecast 2025-2030 ($ million)
Chart on Middle East and Africa - Year-over-year growth 2025-2030 (%)
Data Table on Middle East and Africa - Year-over-year growth 2025-2030 (%)
Chart on Regional Comparison - Middle East and Africa
Data Table on Regional Comparison - Middle East and Africa

12.7.1 Saudi Arabia - Market size and forecast 2025-2030

Chart on Saudi Arabia - Market size and forecast 2025-2030 ($ million)
Data Table on Saudi Arabia - Market size and forecast 2025-2030 ($ million)
Chart on Saudi Arabia - Year-over-year growth 2025-2030 (%)
Data Table on Saudi Arabia - Year-over-year growth 2025-2030 (%)

12.7.2 UAE - Market size and forecast 2025-2030

Chart on UAE - Market size and forecast 2025-2030 ($ million)
Data Table on UAE - Market size and forecast 2025-2030 ($ million)
Chart on UAE - Year-over-year growth 2025-2030 (%)
Data Table on UAE - Year-over-year growth 2025-2030 (%)

12.7.3 South Africa - Market size and forecast 2025-2030

Chart on South Africa - Market size and forecast 2025-2030 ($ million)
Data Table on South Africa - Market size and forecast 2025-2030 ($ million)
Chart on South Africa - Year-over-year growth 2025-2030 (%)
Data Table on South Africa - Year-over-year growth 2025-2030 (%)

12.7.4 Israel - Market size and forecast 2025-2030

Chart on Israel - Market size and forecast 2025-2030 ($ million)
Data Table on Israel - Market size and forecast 2025-2030 ($ million)
Chart on Israel - Year-over-year growth 2025-2030 (%)
Data Table on Israel - Year-over-year growth 2025-2030 (%)

12.7.5 Turkey - Market size and forecast 2025-2030

Chart on Turkey - Market size and forecast 2025-2030 ($ million)
Data Table on Turkey - Market size and forecast 2025-2030 ($ million)
Chart on Turkey - Year-over-year growth 2025-2030 (%)
Data Table on Turkey - Year-over-year growth 2025-2030 (%)

12.8 Market opportunity by geography

Market opportunity by geography ($ million)
Data Tables on Market opportunity by geography ($ million)

13. Drivers, Challenges, and Opportunity

13.1 Market drivers

Rising demand for wastewater re-use
Government initiatives promoting wastewater treatment
Increase in industrial demand for ferric chloride

13.2 Market challenges

Emergence of new process technologies
Regulatory guidelines for ferric chloride usage
Rising competitive threat from substitute products

13.3 Impact of drivers and challenges

Impact of drivers and challenges in 2025 and 2030

13.4 Market opportunities

Preference for spot basis pricing of ferric chloride
Increasing use of ferric chloride in printed circuit boards (PCBs)
Accelerated urbanization across APAC region

14. Competitive Landscape

14.1 Overview

14.2

Overview on criticality of inputs and factors of differentiation

14.3 Landscape disruption

Overview on factors of disruption

14.4 Industry risks

Impact of key risks on business

15. Competitive Analysis

15.1 Companies profiled

Companies covered

15.2 Company ranking index

15.3 Market positioning of companies

Matrix on companies position and classification

15.4 Acuro Organics Ltd.

Acuro Organics Ltd. - Overview
Acuro Organics Ltd. - Product / Service
Acuro Organics Ltd. - Key offerings
SWOT

15.5 Avantor Inc.

Avantor Inc. - Overview
Avantor Inc. - Business segments
Avantor Inc. - Key news
Avantor Inc. - Key offerings
Avantor Inc. - Segment focus
SWOT

15.6 BASF SE

BASF SE - Overview
BASF SE - Business segments
BASF SE - Key news
BASF SE - Key offerings
BASF SE - Segment focus
SWOT

15.7 Chemical Company of Malaysia Bhd

Chemical Company of Malaysia Bhd - Overview
Chemical Company of Malaysia Bhd - Product / Service
Chemical Company of Malaysia Bhd - Key offerings
SWOT

15.8 Chemifloc Ltd.

Chemifloc Ltd. - Overview
Chemifloc Ltd. - Product / Service
Chemifloc Ltd. - Key offerings
SWOT

15.9 Chemtrade Logistics Income Fund

Chemtrade Logistics Income Fund - Overview
Chemtrade Logistics Income Fund - Business segments
Chemtrade Logistics Income Fund - Key offerings
Chemtrade Logistics Income Fund - Segment focus
SWOT

15.10 ECHEMI Digital Tech Co. Ltd.

ECHEMI Digital Tech Co. Ltd. - Overview
ECHEMI Digital Tech Co. Ltd. - Product / Service
ECHEMI Digital Tech Co. Ltd. - Key offerings
SWOT

15.11 Feralco AB

Feralco AB - Overview
Feralco AB - Product / Service
Feralco AB - Key offerings
SWOT

15.12 Kemira Oyj

Kemira Oyj - Overview
Kemira Oyj - Business segments
Kemira Oyj - Key offerings
Kemira Oyj - Segment focus
SWOT

15.13 Prime Chemicals

Prime Chemicals - Overview
Prime Chemicals - Product / Service
Prime Chemicals - Key offerings
SWOT

15.14 PVS Chemicals Inc.

PVS Chemicals Inc. - Overview
PVS Chemicals Inc. - Product / Service
PVS Chemicals Inc. - Key offerings
SWOT

15.15 SC Chimcomplex SA Borzesti

SC Chimcomplex SA Borzesti - Overview
SC Chimcomplex SA Borzesti - Product / Service
SC Chimcomplex SA Borzesti - Key offerings
SWOT

15.16 SIDRA Wasserchemie GmbH

SIDRA Wasserchemie GmbH - Overview
SIDRA Wasserchemie GmbH - Product / Service
SIDRA Wasserchemie GmbH - Key offerings
SWOT

15.17 Sukha Chemical Industries

Sukha Chemical Industries - Overview
Sukha Chemical Industries - Product / Service
Sukha Chemical Industries - Key offerings
SWOT

15.18 Tessenderlo Group NV

Tessenderlo Group NV - Overview
Tessenderlo Group NV - Business segments
Tessenderlo Group NV - Key offerings
Tessenderlo Group NV - Segment focus
SWOT

16. Appendix

16.1 Scope of the report

Market definition
Objectives
Notes and caveats

16.2 Inclusions and exclusions checklist

Inclusions checklist
Exclusions checklist

16.3 Currency conversion rates for US$

16.4 Research methodology

16.5 Data procurement

Information sources

16.6 Data validation

16.7 Validation techniques employed for market sizing

16.8 Data synthesis

16.9 360 degree market analysis

16.10 List of abbreviations

Research Methodology

Technavio presents a detailed picture of the market by way of study, synthesis, and summation of data from multiple sources. The analysts have presented the various facets of the market with a particular focus on identifying the key industry influencers. The data thus presented is comprehensive, reliable, and the result of extensive research, both primary and secondary.

INFORMATION SOURCES

Primary sources

  • Manufacturers and suppliers
  • Channel partners
  • Industry experts
  • Strategic decision makers

Secondary sources

  • Industry journals and periodicals
  • Government data
  • Financial reports of key industry players
  • Historical data
  • Press releases

DATA ANALYSIS

Data Synthesis

  • Collation of data
  • Estimation of key figures
  • Analysis of derived insights

Data Validation

  • Triangulation with data models
  • Reference against proprietary databases
  • Corroboration with industry experts

REPORT WRITING

Qualitative

  • Market drivers
  • Market challenges
  • Market trends
  • Five forces analysis

Quantitative

  • Market size and forecast
  • Market segmentation
  • Geographical insights
  • Competitive landscape

Interested in this report?

Get your sample now to see our research methodology and insights!

Download Now

Frequently Asked Questions

Ferric Chloride market growth will increase by USD 174.2 million during 2026-2030.

The Ferric Chloride market is expected to grow at a CAGR of 5.3% during 2026-2030.

Ferric Chloride market is segmented by Application (Water and wastewater, PCB, Others) Type (Liquid ferric chloride, Solid ferric chloride, Ferric chloride hexahydrate) Grade type (Water treatment grade, Electronic grade, Industrial grade)

Acuro Organics Ltd., Avantor Inc., BASF SE, Chemical Company of Malaysia Bhd, Chemifloc Ltd., Chemtrade Logistics Income Fund, ECHEMI Digital Tech Co. Ltd., Feralco AB, Kemira Oyj, Prime Chemicals, PVS Chemicals Inc., SC Chimcomplex SA Borzesti, SIDRA Wasserchemie GmbH, Sukha Chemical Industries, Tessenderlo Group NV, Vinayak Industries are a few of the key vendors in the Ferric Chloride market.

Europe will register the highest growth rate of 35.8% among the other regions. Therefore, the Ferric Chloride market in Europe is expected to garner significant business opportunities for the vendors during the forecast period.

Germany, UK, France, Italy, Spain, The Netherlands, US, Canada, Mexico, China, Japan, India, South Korea, Australia, Indonesia, Brazil, Argentina, Colombia, Saudi Arabia, UAE, South Africa, Israel, Turkey

  • Rising demand for wastewater re-use is the driving factor this market.

The Ferric Chloride market vendors should focus on grabbing business opportunities from the Application segment as it accounted for the largest market share in the base year.