Eye Makeup Market Analysis, Size, and Forecast 2026-2030: APAC (China, Japan, and India), North America (US, Canada, and Mexico), Europe (UK, Germany, and France), South America (Brazil, Argentina, and Colombia), Middle East and Africa (Saudi Arabia, South Africa, and UAE), and Rest of World (ROW)

Eye Makeup Market Analysis, Size, and Forecast 2026-2030:
APAC (China, Japan, and India), North America (US, Canada, and Mexico), Europe (UK, Germany, and France), South America (Brazil, Argentina, and Colombia), Middle East and Africa (Saudi Arabia, South Africa, and UAE), and Rest of World (ROW)

Published: Dec 2025 299 Pages SKU: IRTNTR74385

Market Overview at a Glance

$7.36 B
Market Opportunity
6.3%
CAGR 2025 - 2030
43.6%
APAC Growth
$12.12 B
Offline segment 2024

Eye Makeup Market Size 2026-2030

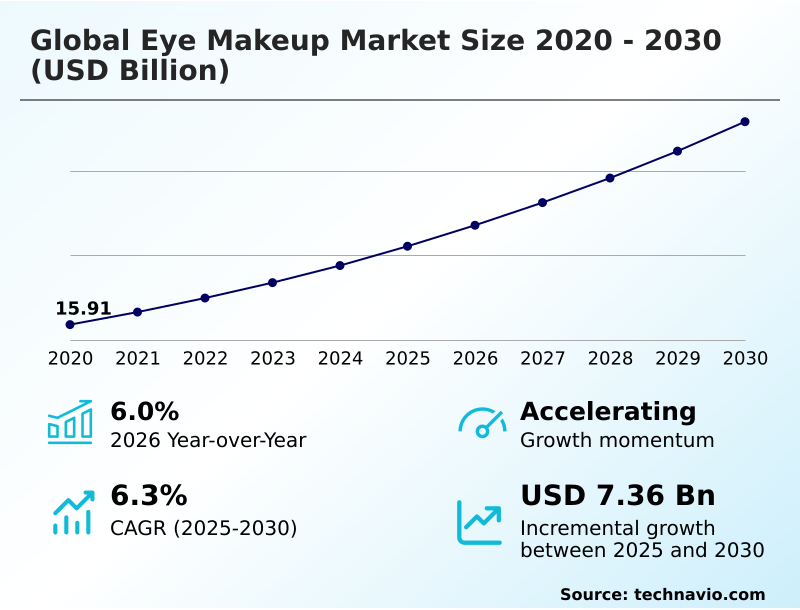
The eye makeup market size is valued to increase by USD 7.36 billion, at a CAGR of 6.3% from 2025 to 2030. Rising consumer awareness and sophistication will drive the eye makeup market.

Major Market Trends & Insights

  • APAC dominated the market and accounted for a 43.6% growth during the forecast period.
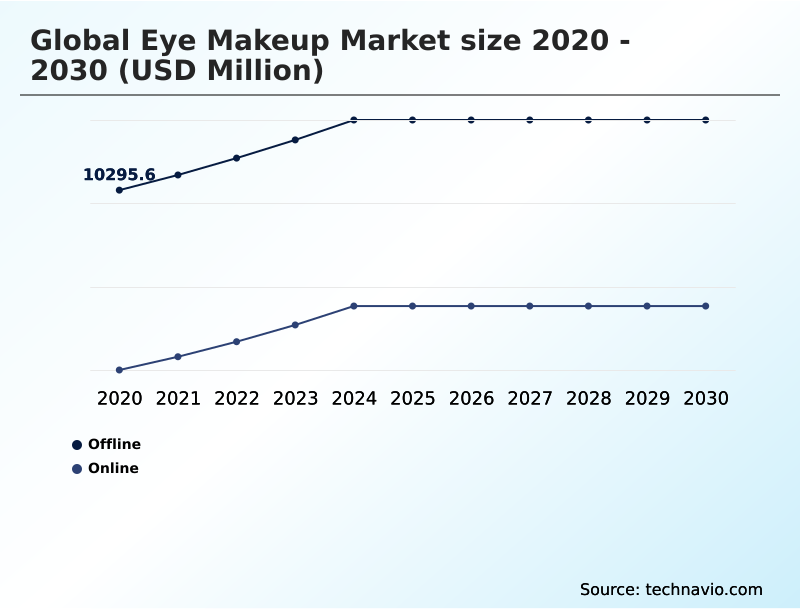
  • By Distribution Channel - Offline segment was valued at USD 12.12 billion in 2024
  • By Type - Eyeliner segment accounted for the largest market revenue share in 2024

Market Size & Forecast

  • Market Opportunities: USD 11.99 billion
  • Market Future Opportunities: USD 7.36 billion
  • CAGR from 2025 to 2030 : 6.3%

Market Summary

  • The eye makeup market is experiencing robust and multifaceted growth, underpinned by digital transformation, evolving consumer values, and continuous product innovation. The expansion is profoundly shaped by the rapid pace of social media, which accelerates trend cycles for products with features like smudge-proof finishes and micro-fine pigment milling. Concurrently, a paradigm shift in consumer consciousness is reshaping product development.
  • The clean beauty movement has transitioned from a niche interest to a mainstream expectation, pressuring manufacturers to prioritize transparent ingredient lists with antioxidant-rich botanicals and hypoallergenic properties. This has spurred significant innovation in cruelty-free formulations and vegan formulations that incorporate skincare benefits, such as mascaras with lash-strengthening biotin or concealers with hydrating hyaluronic acid.
  • For instance, a business scenario involves a brand reformulating its core eyeliner line to meet clean standards. This requires not only R&D to replace traditional polymer film formers with new waterproof gel technologies but also a complete supply chain audit to ensure ingredient traceability, ultimately impacting both production costs and brand positioning.
  • This dynamic landscape is further shaped by the challenge of hyper-competition and the critical need for dermatologically-tested formulas that deliver on performance claims without compromise.

What will be the Size of the Eye Makeup Market during the forecast period?

Get Key Insights on Market Forecast (PDF) Request Free Sample

How is the Eye Makeup Market Segmented?

The eye makeup industry research report provides comprehensive data (region-wise segment analysis), with forecasts and estimates in "USD million" for the period 2026-2030, as well as historical data from 2020-2024 for the following segments.

  • Distribution channel
    • Offline
    • Online
  • Type
    • Eyeliner
    • Eye shadows
    • False lashes
    • Others
  • Category
    • Mass products
    • Premium products
  • Geography
    • APAC
      • China
      • Japan
      • India
    • North America
      • US
      • Canada
      • Mexico
    • Europe
      • UK
      • Germany
      • France
    • South America
      • Brazil
      • Argentina
      • Colombia
    • Middle East and Africa
      • Saudi Arabia
      • South Africa
      • UAE
    • Rest of World (ROW)

By Distribution Channel Insights

The offline segment is estimated to witness significant growth during the forecast period.

The offline channel remains foundational, offering a sensory purchasing journey critical for color cosmetics. Consumers value the ability to physically swatch products to assess color payoff and blendability, test dual-tip applicators, and feel ergonomic brush designs.

This hands-on interaction, crucial for evaluating everything from smudge-proof finishes to the vibrancy of high-impact mineral pigments, builds purchase confidence. In-store consultations provide personalized product recommendations that digital platforms struggle to replicate.

To meet modern expectations, leading retailers are integrating digital tools like augmented reality try-on mirrors, creating a seamless omnichannel experience.

This fusion enhances the discovery of a curated color story and has been shown to improve in-store conversion rates for certain product categories by over 15% where implemented.

Request Free Sample

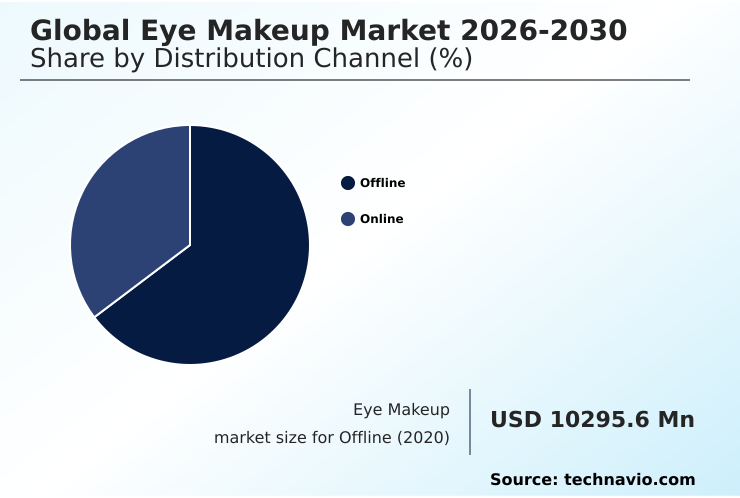
The Offline segment was valued at USD 12.12 billion in 2024 and showed a gradual increase during the forecast period.

Request Free Sample

Regional Analysis

APAC is estimated to contribute 43.6% to the growth of the global market during the forecast period.Technavio’s analysts have elaborately explained the regional trends and drivers that shape the market during the forecast period.

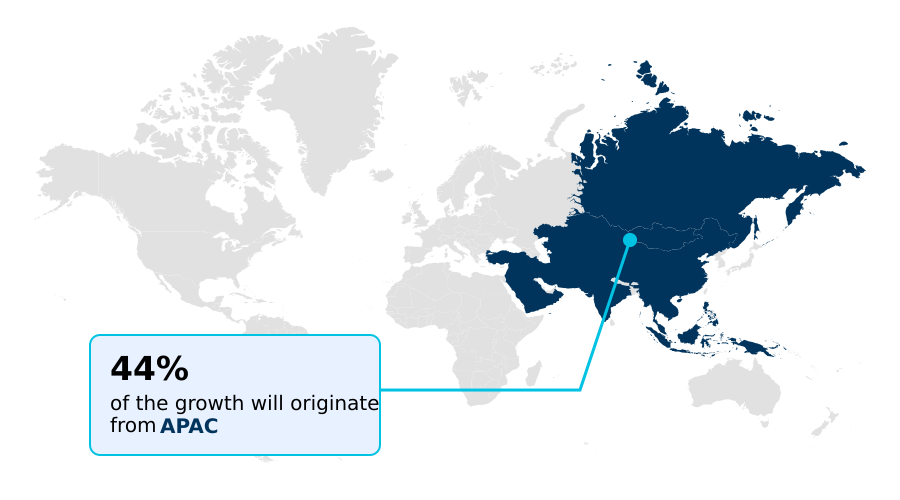
See How Eye Makeup Market Demand is Rising in APAC Request Free Sample

The geographic landscape is led by the APAC region, projected to contribute over 43% of the market's incremental growth, with key markets in China and India driving demand.

In North America, which remains the largest single regional market, consumer preferences are shifting toward ophthalmologist-tested formulas and clean beauty credentials. European markets show a strong preference for haute couture-inspired packaging and products backed by carbon-neutral production commitments.

Emerging markets are a focal point for inclusivity, with brands developing Indian skin tone-optimized palettes and leveraging community fair-trade sourcing to build brand equity.

For example, brands localizing production in high-growth regions have seen a 10% reduction in supply chain costs. These regional nuances require tailored strategies, from marketing light-filtering pigments in mature markets to positioning products as a gender-neutral tool in progressive demographics.

Market Dynamics

Our researchers analyzed the data with 2025 as the base year, along with the key drivers, trends, and challenges. A holistic analysis of drivers will help companies refine their marketing strategies to gain a competitive advantage.

  • Strategic decision-making in the eye makeup sector now hinges on a granular understanding of niche product performance and consumer preferences. For example, a detailed mascara with lash-strengthening biotin benefits analysis reveals a segment of consumers willing to pay a premium for products offering cosmetic and care benefits.
  • An eyeliner with smudge-proof finishes comparison is crucial for R&D teams aiming to capture market share in regions with humid climates. Similarly, evaluating an eyeshadow palette with curated color story against fast-fashion trends helps in inventory planning.
  • A concealer with hydrating hyaluronic acid performance report can guide marketing claims, while data on brow gel with dermatologically-tested formulas informs product positioning for sensitive skin. An eye primer with anti-aging ingredients analysis highlights opportunities in the mature consumer demographic. Technically, understanding the long-wear capabilities of polymer film formers is key to innovation.
  • A mineral pigments vs synthetic colorants debate influences clean beauty strategies, while a focus on clean beauty with hypoallergenic properties, vegan formulations in premium cosmetics, and the cruelty-free certification impact on sales are now central to brand identity.
  • Firms tracking refillable eco-friendly packaging adoption rate and virtual try-on tools user engagement note that adoption rates for sustainable options are nearly twice as high among younger demographics, impacting operational planning.
  • This deep dive extends to skincare-infused pigments market penetration, waterproof gel technologies in eyeliner, carbon-neutral production cost analysis, micro-fine pigment milling techniques, the appeal of antioxidant-rich botanicals in eye cream, the impact of color-correcting pigments, and the benefits of breathable formulations.

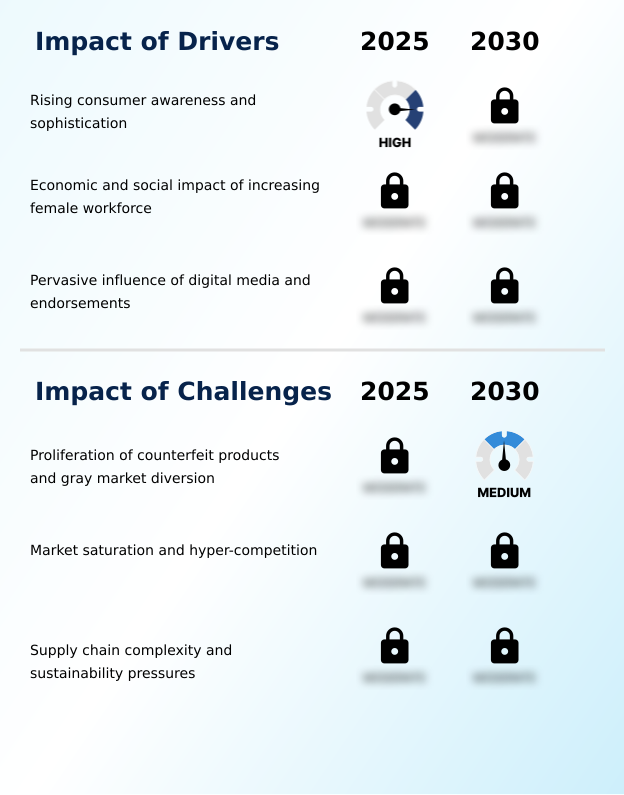
What are the key market drivers leading to the rise in the adoption of Eye Makeup Industry?

  • A primary market driver is the significant increase in consumer awareness and sophistication regarding product formulations and application techniques.

  • Market growth is significantly driven by heightened consumer education and the pervasive influence of digital media.
  • Informed consumers actively seek out dermatologically-tested formulas and cruelty-free formulations, with brands transparently highlighting these attributes seeing an average 15% higher trust score in consumer surveys. The demand for products containing anti-aging ingredients is expanding beyond skincare into color cosmetics.
  • Digital platforms accelerate this trend, where user-generated content and influencer collaboration shades can generate viral demand almost instantly, necessitating trend-driven rapid product development cycles that are 50% shorter than traditional timelines.
  • This ecosystem thrives on personalized product recommendations, which not only guide purchasing decisions but also foster a sense of community, continuously fueling interest and consumption across the market.

What are the market trends shaping the Eye Makeup Industry?

  • The ascendancy of clean beauty and ingredient transparency is a defining market trend. This shift reflects evolving consumer values toward product safety, formulation, and ethical footprint.

  • Key market trends are converging around personalization, sustainability, and the hybridization of makeup and skincare. The rise of serum-infused pigments and formulas with proven hypoallergenic properties reflects a consumer base that demands cosmetic products to deliver tangible care benefits.
  • Digital platforms are enabling unprecedented customization through direct-to-consumer catalog personalization and algorithm-driven shade matching, which have been shown to reduce product return rates by up to 25%. The adoption of virtual try-on tools has increased user engagement time by 40% on product pages.
  • Concurrently, sustainability is driving innovation in product design, with a growing demand for refillable eco-friendly packaging and modular systems like interchangeable magnetic palettes, signaling a permanent shift in consumer expectations regarding environmental impact. These trends collectively pressure brands to innovate beyond color and long-wear capabilities.

What challenges does the Eye Makeup Industry face during its growth?

  • The proliferation of counterfeit products and the diversion of goods through gray markets present a significant and multifaceted challenge to the industry.

  • The market faces significant challenges from intense saturation and the complexities of sustainable supply chains. Hyper-competition forces brands to differentiate through advanced breathable formulations and specialized products like color-correcting pigments, but this increases R&D costs by an average of 20%.
  • The consumer demand for vegan formulations and ethical practices like community fair-trade sourcing adds another layer of complexity to procurement, requiring robust verification systems that can increase raw material costs by 10-15%.
  • Furthermore, as makeup evolves into a gender-neutral tool for self-expression, brands must cater to a wider audience, including needs for professional MUA applications, while combating the proliferation of counterfeit goods that erode brand trust and pose safety risks.

Exclusive Technavio Analysis on Customer Landscape

The eye makeup market forecasting report includes the adoption lifecycle of the market, covering from the innovator’s stage to the laggard’s stage. It focuses on adoption rates in different regions based on penetration. Furthermore, the eye makeup market report also includes key purchase criteria and drivers of price sensitivity to help companies evaluate and develop their market growth analysis strategies.

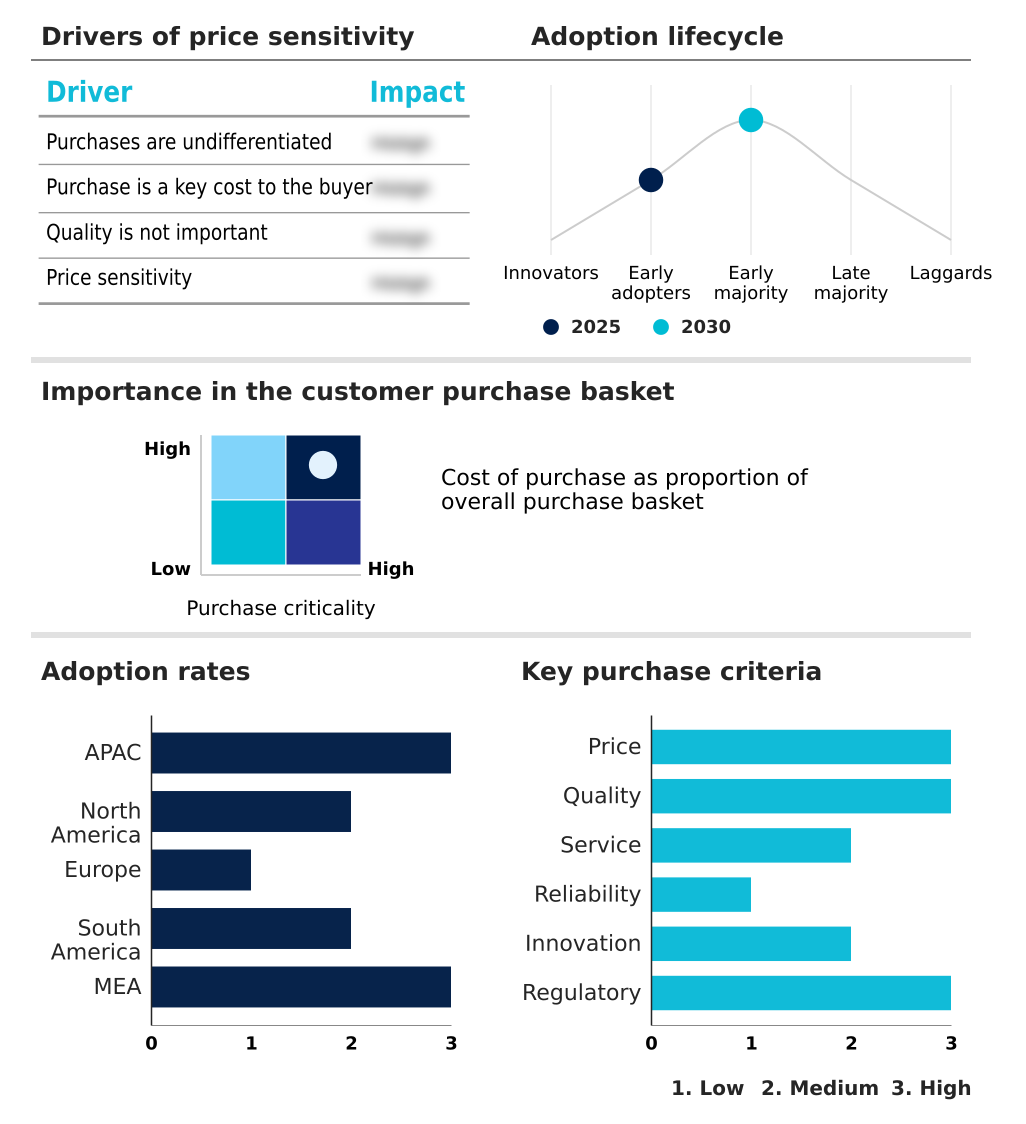
Customer Landscape of Eye Makeup Industry

Competitive Landscape

Companies are implementing various strategies, such as strategic alliances, eye makeup market forecast, partnerships, mergers and acquisitions, geographical expansion, and product/service launches, to enhance their presence in the industry.

Chanel Ltd. - Eye makeup offerings feature proprietary micro-pearl pigment technology and oil-infused formulas, delivered via signature dual-tip applicators designed for customizable application intensity and premium performance.

The industry research and growth report includes detailed analyses of the competitive landscape of the market and information about key companies, including:

  • Chanel Ltd.
  • Colorbar Cosmetics Pvt. Ltd.
  • Cosmetic Manufacturers Aust.
  • DIC Corp.
  • FORMA BRANDS LLC
  • Iredale Cosmetics Inc.
  • LOreal SA
  • LVMH Moet Hennessy
  • Manash E-Commerce Pvt. Ltd.
  • Mary Kay Inc.
  • Natura and Co Holding SA
  • Oriflame Cosmetics S.A.
  • Revolution Beauty Ltd.
  • Revlon Inc.
  • RMS Beauty
  • Shiseido Co. Ltd.
  • The Estee Lauder Co. Inc.
  • Unilever PLC

Qualitative and quantitative analysis of companies has been conducted to help clients understand the wider business environment as well as the strengths and weaknesses of key industry players. Data is qualitatively analyzed to categorize companies as pure play, category-focused, industry-focused, and diversified; it is quantitatively analyzed to categorize companies as dominant, leading, strong, tentative, and weak.

Recent Development and News in Eye makeup market

  • In November 2024, LVMH Moet Hennessy finalized its acquisition of a rising clean-beauty tech startup for an estimated $150 million, integrating its patented sustainable pigment processing into its luxury cosmetics portfolio.
  • In February 2025, Unilever PLC launched a new line of eye makeup under its prestige beauty division, featuring refillable packaging and skincare-infused formulas with clinically-backed claims of improving lash density by 15% over eight weeks.
  • In April 2025, Shiseido Co. Ltd. announced the opening of a new R&D and manufacturing hub in India, committing $200 million to develop products specifically tailored for South Asian skin tones and climates.
  • In September 2024, The Estee Lauder Co. Inc. announced a strategic partnership with a leading AI firm to deploy hyper-personalized virtual try-on experiences across its e-commerce platforms, aiming to increase online conversion rates.

Dive into Technavio’s robust research methodology, blending expert interviews, extensive data synthesis, and validated models for unparalleled Eye Makeup Market insights. See full methodology.

Market Scope
Page number 299
Base year 2025
Historic period 2020-2024
Forecast period 2026-2030
Growth momentum & CAGR Accelerate at a CAGR of 6.3%
Market growth 2026-2030 USD 7359.8 million
Market structure Fragmented
YoY growth 2025-2026(%) 6.0%
Key countries China, Japan, India, South Korea, Australia, Indonesia, US, Canada, Mexico, UK, Germany, France, Italy, Spain, The Netherlands, Brazil, Argentina, Colombia, Saudi Arabia, South Africa, UAE, Turkey and Israel
Competitive landscape Leading Companies, Market Positioning of Companies, Competitive Strategies, and Industry Risks

Request Free Sample

Research Analyst Overview

  • The market is undergoing a significant transformation driven by consumer demand for multifunctional, high-performance products with transparent and ethical credentials. Boardroom-level strategy is now centered on integrating skincare-infused pigments and anti-aging ingredients into color cosmetics, moving beyond simple aesthetics. Formulations increasingly feature hydrating hyaluronic acid, antioxidant-rich botanicals, and lash-strengthening biotin to offer tangible care benefits.
  • A key focus is the development of ophthalmologist-tested formulas and dermatologically-tested formulas that meet stringent clean beauty standards, often incorporating mineral pigments and excluding controversial chemicals. The demand for hypoallergenic properties is particularly strong, driving innovation in breathable formulations. High-performance attributes remain critical, with R&D focused on proprietary polymer film formers and waterproof gel technologies to ensure long-wear capabilities.
  • Brands that have successfully implemented these hybrid formulas have reported a 30% increase in repeat purchase rates for new product lines. The push for ethical production is also evident in the rise of cruelty-free formulations, vegan formulations, and commitments to carbon-neutral production.
  • This is complemented by aesthetic innovations like light-filtering pigments, color-correcting pigments, serum-infused pigments, high-impact mineral pigments, and micro-fine pigment milling techniques that deliver superior visual results.

What are the Key Data Covered in this Eye Makeup Market Research and Growth Report?

  • What is the expected growth of the Eye Makeup Market between 2026 and 2030?

    • USD 7.36 billion, at a CAGR of 6.3%

  • What segmentation does the market report cover?

    • The report is segmented by Distribution Channel (Offline, and Online), Type (Eyeliner, Eye shadows, False lashes, and Others), Category (Mass products, and Premium products) and Geography (APAC, North America, Europe, South America, Middle East and Africa)

  • Which regions are analyzed in the report?

    • APAC, North America, Europe, South America and Middle East and Africa

  • What are the key growth drivers and market challenges?

    • Rising consumer awareness and sophistication, Proliferation of counterfeit products and gray market diversion

  • Who are the major players in the Eye Makeup Market?

    • Chanel Ltd., Colorbar Cosmetics Pvt. Ltd., Cosmetic Manufacturers Aust., DIC Corp., FORMA BRANDS LLC, Iredale Cosmetics Inc., LOreal SA, LVMH Moet Hennessy, Manash E-Commerce Pvt. Ltd., Mary Kay Inc., Natura and Co Holding SA, Oriflame Cosmetics S.A., Revolution Beauty Ltd., Revlon Inc., RMS Beauty, Shiseido Co. Ltd., The Estee Lauder Co. Inc. and Unilever PLC

Market Research Insights

  • Market dynamics are increasingly shaped by digital engagement and the demand for personalization. The use of virtual try-on tools has demonstrated an ability to increase online conversion rates by up to 30%, while personalized product recommendations based on algorithm-driven shade matching have improved customer retention by 18% in tested cohorts.
  • Brands are leveraging user-generated content and influencer collaboration shades to build authentic community connections, a strategy that proves more effective than traditional advertising. This shift necessitates trend-driven rapid product development and a focus on creating a curated color story that resonates with consumer demand for creative self-expression.
  • The result is a highly responsive market where brand success is tied to agility and digital fluency.

We can help! Our analysts can customize this eye makeup market research report to meet your requirements.

Get in touch

1. Executive Summary

1.1 Market overview

Executive Summary - Chart on Market Overview
Executive Summary - Data Table on Market Overview
Executive Summary - Chart on Global Market Characteristics
Executive Summary - Chart on Market by Geography
Executive Summary - Chart on Market Segmentation by Distribution Channel
Executive Summary - Chart on Market Segmentation by Type
Executive Summary - Chart on Market Segmentation by Category
Executive Summary - Chart on Incremental Growth
Executive Summary - Data Table on Incremental Growth
Executive Summary - Chart on Company Market Positioning

2. Technavio Analysis

2.1 Analysis of price sensitivity, lifecycle, customer purchase basket, adoption rates, and purchase criteria

2.2 Criticality of inputs and Factors of differentiation

Chart on Overview on criticality of inputs and factors of differentiation

2.3 Factors of disruption

Chart on Overview on factors of disruption

2.4 Impact of drivers and challenges

Chart on Impact of drivers and challenges in 2025 and 2030

3. Market Landscape

3.1 Market ecosystem

Chart on Parent Market
Data Table on - Parent Market

3.2 Market characteristics

Chart on Market characteristics analysis

3.3 Value chain analysis

Chart on Value chain analysis

4. Market Sizing

4.1 Market definition

Data Table on Offerings of companies included in the market definition

4.2 Market segment analysis

Market segments

4.3 Market size 2025

4.4 Market outlook: Forecast for 2025-2030

Chart on Global - Market size and forecast 2025-2030 ($ million)
Data Table on Global - Market size and forecast 2025-2030 ($ million)
Chart on Global Market: Year-over-year growth 2025-2030 (%)
Data Table on Global Market: Year-over-year growth 2025-2030 (%)

5. Historic Market Size

5.1 Global Eye Makeup Market 2020 - 2024

Historic Market Size - Data Table on Global Eye Makeup Market 2020 - 2024 ($ million)

5.2 Distribution Channel segment analysis 2020 - 2024

Historic Market Size - Distribution Channel Segment 2020 - 2024 ($ million)

5.3 Type segment analysis 2020 - 2024

Historic Market Size - Type Segment 2020 - 2024 ($ million)

5.4 Category segment analysis 2020 - 2024

Historic Market Size - Category Segment 2020 - 2024 ($ million)

5.5 Geography segment analysis 2020 - 2024

Historic Market Size - Geography Segment 2020 - 2024 ($ million)

5.6 Country segment analysis 2020 - 2024

Historic Market Size - Country Segment 2020 - 2024 ($ million)

6. Qualitative Analysis

6.1 The AI impact on global eye makeup market

7. Five Forces Analysis

7.1 Five forces summary

Five forces analysis - Comparison between 2025 and 2030

7.2 Bargaining power of buyers

Bargaining power of buyers - Impact of key factors 2025 and 2030

7.3 Bargaining power of suppliers

Bargaining power of suppliers - Impact of key factors in 2025 and 2030

7.4 Threat of new entrants

Threat of new entrants - Impact of key factors in 2025 and 2030

7.5 Threat of substitutes

Threat of substitutes - Impact of key factors in 2025 and 2030

7.6 Threat of rivalry

Threat of rivalry - Impact of key factors in 2025 and 2030

7.7 Market condition

Chart on Market condition - Five forces 2025 and 2030

8. Market Segmentation by Distribution Channel

8.1 Market segments

Chart on Distribution Channel - Market share 2025-2030 (%)
Data Table on Distribution Channel - Market share 2025-2030 (%)

8.2 Comparison by Distribution Channel

Chart on Comparison by Distribution Channel
Data Table on Comparison by Distribution Channel

8.3 Offline - Market size and forecast 2025-2030

Chart on Offline - Market size and forecast 2025-2030 ($ million)
Data Table on Offline - Market size and forecast 2025-2030 ($ million)
Chart on Offline - Year-over-year growth 2025-2030 (%)
Data Table on Offline - Year-over-year growth 2025-2030 (%)

8.4 Online - Market size and forecast 2025-2030

Chart on Online - Market size and forecast 2025-2030 ($ million)
Data Table on Online - Market size and forecast 2025-2030 ($ million)
Chart on Online - Year-over-year growth 2025-2030 (%)
Data Table on Online - Year-over-year growth 2025-2030 (%)

8.5 Market opportunity by Distribution Channel

Market opportunity by Distribution Channel ($ million)
Data Table on Market opportunity by Distribution Channel ($ million)

9. Market Segmentation by Type

9.1 Market segments

Chart on Type - Market share 2025-2030 (%)
Data Table on Type - Market share 2025-2030 (%)

9.2 Comparison by Type

Chart on Comparison by Type
Data Table on Comparison by Type

9.3 Eyeliner - Market size and forecast 2025-2030

Chart on Eyeliner - Market size and forecast 2025-2030 ($ million)
Data Table on Eyeliner - Market size and forecast 2025-2030 ($ million)
Chart on Eyeliner - Year-over-year growth 2025-2030 (%)
Data Table on Eyeliner - Year-over-year growth 2025-2030 (%)

9.4 Eye shadows - Market size and forecast 2025-2030

Chart on Eye shadows - Market size and forecast 2025-2030 ($ million)
Data Table on Eye shadows - Market size and forecast 2025-2030 ($ million)
Chart on Eye shadows - Year-over-year growth 2025-2030 (%)
Data Table on Eye shadows - Year-over-year growth 2025-2030 (%)

9.5 False lashes - Market size and forecast 2025-2030

Chart on False lashes - Market size and forecast 2025-2030 ($ million)
Data Table on False lashes - Market size and forecast 2025-2030 ($ million)
Chart on False lashes - Year-over-year growth 2025-2030 (%)
Data Table on False lashes - Year-over-year growth 2025-2030 (%)

9.6 Others - Market size and forecast 2025-2030

Chart on Others - Market size and forecast 2025-2030 ($ million)
Data Table on Others - Market size and forecast 2025-2030 ($ million)
Chart on Others - Year-over-year growth 2025-2030 (%)
Data Table on Others - Year-over-year growth 2025-2030 (%)

9.7 Market opportunity by Type

Market opportunity by Type ($ million)
Data Table on Market opportunity by Type ($ million)

10. Market Segmentation by Category

10.1 Market segments

Chart on Market Segmentation by Category - Market share 2025-2030 (%)
Data Table on Market Segmentation by Category - Market share 2025-2030 (%)

10.2 Comparison by Market Segmentation by Category

Chart on Comparison by Market Segmentation by Category
Data Table on Comparison by Market Segmentation by Category

10.3 Mass products - Market size and forecast 2025-2030

Chart on Mass products - Market size and forecast 2025-2030 ($ million)
Data Table on Mass products - Market size and forecast 2025-2030 ($ million)
Chart on Mass products - Year-over-year growth 2025-2030 (%)
Data Table on Mass products - Year-over-year growth 2025-2030 (%)

10.4 Premium products - Market size and forecast 2025-2030

Chart on Premium products - Market size and forecast 2025-2030 ($ million)
Data Table on Premium products - Market size and forecast 2025-2030 ($ million)
Chart on Premium products - Year-over-year growth 2025-2030 (%)
Data Table on Premium products - Year-over-year growth 2025-2030 (%)

10.5 Market opportunity by Market Segmentation by Category

Market opportunity by Market Segmentation by Category ($ million)
Data Table on Market opportunity by Market Segmentation by Category ($ million)

11. Customer Landscape

11.1 Customer landscape overview

Analysis of price sensitivity, lifecycle, customer purchase basket, adoption rates, and purchase criteria

12. Geographic Landscape

12.1 Geographic segmentation

Chart on Market share by geography 2025-2030 (%)
Data Table on Market share by geography 2025-2030 (%)

12.2 Geographic comparison

Chart on Geographic comparison
Data Table on Geographic comparison

12.3 APAC - Market size and forecast 2025-2030

Chart on APAC - Market size and forecast 2025-2030 ($ million)
Data Table on APAC - Market size and forecast 2025-2030 ($ million)
Chart on APAC - Year-over-year growth 2025-2030 (%)
Data Table on APAC - Year-over-year growth 2025-2030 (%)
Chart on Regional Comparison - APAC
Data Table on Regional Comparison - APAC

12.3.1 China - Market size and forecast 2025-2030

Chart on China - Market size and forecast 2025-2030 ($ million)
Data Table on China - Market size and forecast 2025-2030 ($ million)
Chart on China - Year-over-year growth 2025-2030 (%)
Data Table on China - Year-over-year growth 2025-2030 (%)

12.3.2 Japan - Market size and forecast 2025-2030

Chart on Japan - Market size and forecast 2025-2030 ($ million)
Data Table on Japan - Market size and forecast 2025-2030 ($ million)
Chart on Japan - Year-over-year growth 2025-2030 (%)
Data Table on Japan - Year-over-year growth 2025-2030 (%)

12.3.3 India - Market size and forecast 2025-2030

Chart on India - Market size and forecast 2025-2030 ($ million)
Data Table on India - Market size and forecast 2025-2030 ($ million)
Chart on India - Year-over-year growth 2025-2030 (%)
Data Table on India - Year-over-year growth 2025-2030 (%)

12.3.4 South Korea - Market size and forecast 2025-2030

Chart on South Korea - Market size and forecast 2025-2030 ($ million)
Data Table on South Korea - Market size and forecast 2025-2030 ($ million)
Chart on South Korea - Year-over-year growth 2025-2030 (%)
Data Table on South Korea - Year-over-year growth 2025-2030 (%)

12.3.5 Australia - Market size and forecast 2025-2030

Chart on Australia - Market size and forecast 2025-2030 ($ million)
Data Table on Australia - Market size and forecast 2025-2030 ($ million)
Chart on Australia - Year-over-year growth 2025-2030 (%)
Data Table on Australia - Year-over-year growth 2025-2030 (%)

12.3.6 Indonesia - Market size and forecast 2025-2030

Chart on Indonesia - Market size and forecast 2025-2030 ($ million)
Data Table on Indonesia - Market size and forecast 2025-2030 ($ million)
Chart on Indonesia - Year-over-year growth 2025-2030 (%)
Data Table on Indonesia - Year-over-year growth 2025-2030 (%)

12.4 North America - Market size and forecast 2025-2030

Chart on North America - Market size and forecast 2025-2030 ($ million)
Data Table on North America - Market size and forecast 2025-2030 ($ million)
Chart on North America - Year-over-year growth 2025-2030 (%)
Data Table on North America - Year-over-year growth 2025-2030 (%)
Chart on Regional Comparison - North America
Data Table on Regional Comparison - North America

12.4.1 US - Market size and forecast 2025-2030

Chart on US - Market size and forecast 2025-2030 ($ million)
Data Table on US - Market size and forecast 2025-2030 ($ million)
Chart on US - Year-over-year growth 2025-2030 (%)
Data Table on US - Year-over-year growth 2025-2030 (%)

12.4.2 Canada - Market size and forecast 2025-2030

Chart on Canada - Market size and forecast 2025-2030 ($ million)
Data Table on Canada - Market size and forecast 2025-2030 ($ million)
Chart on Canada - Year-over-year growth 2025-2030 (%)
Data Table on Canada - Year-over-year growth 2025-2030 (%)

12.4.3 Mexico - Market size and forecast 2025-2030

Chart on Mexico - Market size and forecast 2025-2030 ($ million)
Data Table on Mexico - Market size and forecast 2025-2030 ($ million)
Chart on Mexico - Year-over-year growth 2025-2030 (%)
Data Table on Mexico - Year-over-year growth 2025-2030 (%)

12.5 Europe - Market size and forecast 2025-2030

Chart on Europe - Market size and forecast 2025-2030 ($ million)
Data Table on Europe - Market size and forecast 2025-2030 ($ million)
Chart on Europe - Year-over-year growth 2025-2030 (%)
Data Table on Europe - Year-over-year growth 2025-2030 (%)
Chart on Regional Comparison - Europe
Data Table on Regional Comparison - Europe

12.5.1 UK - Market size and forecast 2025-2030

Chart on UK - Market size and forecast 2025-2030 ($ million)
Data Table on UK - Market size and forecast 2025-2030 ($ million)
Chart on UK - Year-over-year growth 2025-2030 (%)
Data Table on UK - Year-over-year growth 2025-2030 (%)

12.5.2 Germany - Market size and forecast 2025-2030

Chart on Germany - Market size and forecast 2025-2030 ($ million)
Data Table on Germany - Market size and forecast 2025-2030 ($ million)
Chart on Germany - Year-over-year growth 2025-2030 (%)
Data Table on Germany - Year-over-year growth 2025-2030 (%)

12.5.3 France - Market size and forecast 2025-2030

Chart on France - Market size and forecast 2025-2030 ($ million)
Data Table on France - Market size and forecast 2025-2030 ($ million)
Chart on France - Year-over-year growth 2025-2030 (%)
Data Table on France - Year-over-year growth 2025-2030 (%)

12.5.4 Italy - Market size and forecast 2025-2030

Chart on Italy - Market size and forecast 2025-2030 ($ million)
Data Table on Italy - Market size and forecast 2025-2030 ($ million)
Chart on Italy - Year-over-year growth 2025-2030 (%)
Data Table on Italy - Year-over-year growth 2025-2030 (%)

12.5.5 Spain - Market size and forecast 2025-2030

Chart on Spain - Market size and forecast 2025-2030 ($ million)
Data Table on Spain - Market size and forecast 2025-2030 ($ million)
Chart on Spain - Year-over-year growth 2025-2030 (%)
Data Table on Spain - Year-over-year growth 2025-2030 (%)

12.5.6 The Netherlands - Market size and forecast 2025-2030

Chart on The Netherlands - Market size and forecast 2025-2030 ($ million)
Data Table on The Netherlands - Market size and forecast 2025-2030 ($ million)
Chart on The Netherlands - Year-over-year growth 2025-2030 (%)
Data Table on The Netherlands - Year-over-year growth 2025-2030 (%)

12.6 South America - Market size and forecast 2025-2030

Chart on South America - Market size and forecast 2025-2030 ($ million)
Data Table on South America - Market size and forecast 2025-2030 ($ million)
Chart on South America - Year-over-year growth 2025-2030 (%)
Data Table on South America - Year-over-year growth 2025-2030 (%)
Chart on Regional Comparison - South America
Data Table on Regional Comparison - South America

12.6.1 Brazil - Market size and forecast 2025-2030

Chart on Brazil - Market size and forecast 2025-2030 ($ million)
Data Table on Brazil - Market size and forecast 2025-2030 ($ million)
Chart on Brazil - Year-over-year growth 2025-2030 (%)
Data Table on Brazil - Year-over-year growth 2025-2030 (%)

12.6.2 Argentina - Market size and forecast 2025-2030

Chart on Argentina - Market size and forecast 2025-2030 ($ million)
Data Table on Argentina - Market size and forecast 2025-2030 ($ million)
Chart on Argentina - Year-over-year growth 2025-2030 (%)
Data Table on Argentina - Year-over-year growth 2025-2030 (%)

12.6.3 Colombia - Market size and forecast 2025-2030

Chart on Colombia - Market size and forecast 2025-2030 ($ million)
Data Table on Colombia - Market size and forecast 2025-2030 ($ million)
Chart on Colombia - Year-over-year growth 2025-2030 (%)
Data Table on Colombia - Year-over-year growth 2025-2030 (%)

12.7 Middle East and Africa - Market size and forecast 2025-2030

Chart on Middle East and Africa - Market size and forecast 2025-2030 ($ million)
Data Table on Middle East and Africa - Market size and forecast 2025-2030 ($ million)
Chart on Middle East and Africa - Year-over-year growth 2025-2030 (%)
Data Table on Middle East and Africa - Year-over-year growth 2025-2030 (%)
Chart on Regional Comparison - Middle East and Africa
Data Table on Regional Comparison - Middle East and Africa

12.7.1 Saudi Arabia - Market size and forecast 2025-2030

Chart on Saudi Arabia - Market size and forecast 2025-2030 ($ million)
Data Table on Saudi Arabia - Market size and forecast 2025-2030 ($ million)
Chart on Saudi Arabia - Year-over-year growth 2025-2030 (%)
Data Table on Saudi Arabia - Year-over-year growth 2025-2030 (%)

12.7.2 South Africa - Market size and forecast 2025-2030

Chart on South Africa - Market size and forecast 2025-2030 ($ million)
Data Table on South Africa - Market size and forecast 2025-2030 ($ million)
Chart on South Africa - Year-over-year growth 2025-2030 (%)
Data Table on South Africa - Year-over-year growth 2025-2030 (%)

12.7.3 UAE - Market size and forecast 2025-2030

Chart on UAE - Market size and forecast 2025-2030 ($ million)
Data Table on UAE - Market size and forecast 2025-2030 ($ million)
Chart on UAE - Year-over-year growth 2025-2030 (%)
Data Table on UAE - Year-over-year growth 2025-2030 (%)

12.7.4 Turkey - Market size and forecast 2025-2030

Chart on Turkey - Market size and forecast 2025-2030 ($ million)
Data Table on Turkey - Market size and forecast 2025-2030 ($ million)
Chart on Turkey - Year-over-year growth 2025-2030 (%)
Data Table on Turkey - Year-over-year growth 2025-2030 (%)

12.7.5 Israel - Market size and forecast 2025-2030

Chart on Israel - Market size and forecast 2025-2030 ($ million)
Data Table on Israel - Market size and forecast 2025-2030 ($ million)
Chart on Israel - Year-over-year growth 2025-2030 (%)
Data Table on Israel - Year-over-year growth 2025-2030 (%)

12.8 Market opportunity by geography

Market opportunity by geography ($ million)
Data Tables on Market opportunity by geography ($ million)

13. Drivers, Challenges, and Opportunity

13.1 Market drivers

Rising consumer awareness and sophistication
Economic and social impact of increasing female workforce
Pervasive influence of digital media and endorsements

13.2 Market challenges

Proliferation of counterfeit products and gray market diversion
Market saturation and hyper-competition
Supply chain complexity and sustainability pressures

13.3 Impact of drivers and challenges

Impact of drivers and challenges in 2025 and 2030

13.4 Market opportunities

Ascendancy of clean beauty and ingredient transparency
Hybridization of makeup and skincare
Radical inclusivity and celebration of individuality

14. Competitive Landscape

14.1 Overview

14.2

Overview on criticality of inputs and factors of differentiation

14.3 Landscape disruption

Overview on factors of disruption

14.4 Industry risks

Impact of key risks on business

15. Competitive Analysis

15.1 Companies profiled

Companies covered

15.2 Company ranking index

15.3 Market positioning of companies

Matrix on companies position and classification

15.4 Chanel Ltd.

Chanel Ltd. - Overview
Chanel Ltd. - Product / Service
Chanel Ltd. - Key offerings
SWOT

15.5 DIC Corp.

DIC Corp. - Overview
DIC Corp. - Business segments
DIC Corp. - Key news
DIC Corp. - Key offerings
DIC Corp. - Segment focus
SWOT

15.6 FORMA BRANDS LLC

FORMA BRANDS LLC - Overview
FORMA BRANDS LLC - Product / Service
FORMA BRANDS LLC - Key offerings
SWOT

15.7 Iredale Cosmetics Inc.

Iredale Cosmetics Inc. - Overview
Iredale Cosmetics Inc. - Product / Service
Iredale Cosmetics Inc. - Key offerings
SWOT

15.8 LOreal SA

LOreal SA - Overview
LOreal SA - Business segments
LOreal SA - Key news
LOreal SA - Key offerings
LOreal SA - Segment focus
SWOT

15.9 LVMH Moet Hennessy

LVMH Moet Hennessy - Overview
LVMH Moet Hennessy - Business segments
LVMH Moet Hennessy - Key news
LVMH Moet Hennessy - Key offerings
LVMH Moet Hennessy - Segment focus
SWOT

15.10 Manash E-Commerce Pvt. Ltd.

Manash E-Commerce Pvt. Ltd. - Overview
Manash E-Commerce Pvt. Ltd. - Product / Service
Manash E-Commerce Pvt. Ltd. - Key offerings
SWOT

15.11 Mary Kay Inc.

Mary Kay Inc. - Overview
Mary Kay Inc. - Product / Service
Mary Kay Inc. - Key offerings
SWOT

15.12 Natura and Co Holding SA

Natura and Co Holding SA - Overview
Natura and Co Holding SA - Business segments
Natura and Co Holding SA - Key offerings
Natura and Co Holding SA - Segment focus
SWOT

15.13 Oriflame Cosmetics S.A.

Oriflame Cosmetics S.A. - Overview
Oriflame Cosmetics S.A. - Product / Service
Oriflame Cosmetics S.A. - Key offerings
SWOT

15.14 Revolution Beauty Ltd.

Revolution Beauty Ltd. - Overview
Revolution Beauty Ltd. - Product / Service
Revolution Beauty Ltd. - Key offerings
SWOT

15.15 Revlon Inc.

Revlon Inc. - Overview
Revlon Inc. - Business segments
Revlon Inc. - Key offerings
Revlon Inc. - Segment focus
SWOT

15.16 Shiseido Co. Ltd.

Shiseido Co. Ltd. - Overview
Shiseido Co. Ltd. - Product / Service
Shiseido Co. Ltd. - Key offerings
SWOT

15.17 The Estee Lauder Co. Inc.

The Estee Lauder Co. Inc. - Overview
The Estee Lauder Co. Inc. - Product / Service
The Estee Lauder Co. Inc. - Key news
The Estee Lauder Co. Inc. - Key offerings
SWOT

15.18 Unilever PLC

Unilever PLC - Overview
Unilever PLC - Business segments
Unilever PLC - Key offerings
Unilever PLC - Segment focus
SWOT

16. Appendix

16.1 Scope of the report

Market definition
Objectives
Notes and caveats

16.2 Inclusions and exclusions checklist

Inclusions checklist
Exclusions checklist

16.3 Currency conversion rates for US$

16.4 Research methodology

16.5 Data procurement

Information sources

16.6 Data validation

16.7 Validation techniques employed for market sizing

16.8 Data synthesis

16.9 360 degree market analysis

16.10 List of abbreviations

Research Methodology

Technavio presents a detailed picture of the market by way of study, synthesis, and summation of data from multiple sources. The analysts have presented the various facets of the market with a particular focus on identifying the key industry influencers. The data thus presented is comprehensive, reliable, and the result of extensive research, both primary and secondary.

INFORMATION SOURCES

Primary sources

  • Manufacturers and suppliers
  • Channel partners
  • Industry experts
  • Strategic decision makers

Secondary sources

  • Industry journals and periodicals
  • Government data
  • Financial reports of key industry players
  • Historical data
  • Press releases

DATA ANALYSIS

Data Synthesis

  • Collation of data
  • Estimation of key figures
  • Analysis of derived insights

Data Validation

  • Triangulation with data models
  • Reference against proprietary databases
  • Corroboration with industry experts

REPORT WRITING

Qualitative

  • Market drivers
  • Market challenges
  • Market trends
  • Five forces analysis

Quantitative

  • Market size and forecast
  • Market segmentation
  • Geographical insights
  • Competitive landscape

Interested in this report?

Get your sample now to see our research methodology and insights!

Download Now

Frequently Asked Questions

Eye Makeup market growth will increase by USD 7359.8 million during 2026-2030.

The Eye Makeup market is expected to grow at a CAGR of 6.3% during 2026-2030.

Eye Makeup market is segmented by Distribution channel (Offline, Online) Type (Eyeliner, Eye shadows, False lashes, Others) Category (Mass products, Premium products)

Chanel Ltd., Colorbar Cosmetics Pvt. Ltd., Cosmetic Manufacturers Aust., DIC Corp., FORMA BRANDS LLC, Iredale Cosmetics Inc., LOreal SA, LVMH Moet Hennessy, Manash E-Commerce Pvt. Ltd., Mary Kay Inc., Natura and Co Holding SA, Oriflame Cosmetics S.A., Revolution Beauty Ltd., Revlon Inc., RMS Beauty, Shiseido Co. Ltd., The Estee Lauder Co. Inc., Unilever PLC are a few of the key vendors in the Eye Makeup market.

APAC will register the highest growth rate of 43.6% among the other regions. Therefore, the Eye Makeup market in APAC is expected to garner significant business opportunities for the vendors during the forecast period.

China, Japan, India, South Korea, Australia, Indonesia, US, Canada, Mexico, UK, Germany, France, Italy, Spain, The Netherlands, Brazil, Argentina, Colombia, Saudi Arabia, South Africa, UAE, Turkey, Israel

  • Rising consumer awareness and sophistication is the driving factor this market.

The Eye Makeup market vendors should focus on grabbing business opportunities from the Distribution channel segment as it accounted for the largest market share in the base year.