Ethernet Test Equipment Market Analysis, Size, and Forecast 2025-2029: North America (US and Canada), Europe (France, Germany, Italy, and UK), APAC (China, India, Japan, and South Korea), and Rest of World (ROW)

Ethernet Test Equipment Market Analysis, Size, and Forecast 2025-2029:
North America (US and Canada), Europe (France, Germany, Italy, and UK), APAC (China, India, Japan, and South Korea), and Rest of World (ROW)

Published: Jun 2025 222 Pages SKU: IRTNTR40510

Market Overview at a Glance

$742 Mn
Market Opportunity
6%
CAGR
5.6
YoY growth 2024-2025(%)

Ethernet Test Equipment Market Size 2025-2029

The ethernet test equipment market size is forecast to increase by USD 742 million, at a CAGR of 6% between 2024 and 2029.

  • The market is experiencing significant growth, driven primarily by the increasing demand for high-speed Ethernet solutions. This trend is fueled by the proliferation of IoT devices, cloud computing, and data center expansions, which necessitate robust and efficient network infrastructure. Another key trend shaping the market is the emergence of next-generation Power over Ethernet (PoE) based on the IEEE 802.3bt standard. This technology enables power and data transmission over a single Ethernet cable, reducing complexity and cost. However, the market is not without challenges. Intense competition from established players and new entrants poses a significant threat to market participants.
  • Additionally, the rapid pace of technological advancements necessitates continuous research and development efforts to stay competitive. Companies seeking to capitalize on market opportunities and navigate challenges effectively must focus on delivering high-performance, cost-effective solutions that cater to the evolving needs of their customers. Companies must differentiate themselves through innovation, competitive pricing, and exceptional customer service to secure a strong market position. This trend is driven by the proliferation of IoT devices and the need for faster data transfer rates in various industries, including telecommunications, manufacturing, and healthcare.

What will be the Size of the Ethernet Test Equipment Market during the forecast period?

Ethernet Test Equipment Market Size

Explore in-depth regional segment analysis with market size data - historical 2019-2023 and forecasts 2025-2029 - in the full report.  
Request Free Sample

The market is characterized by its continuous evolution, reflecting the dynamic nature of network technologies and their applications across various sectors. Network monitoring tools, throughput testers, VPN testing, fiber optic cables, data acquisition systems, coaxial cables, and copper cables are integral components of this market. These entities are intricately linked, with network protocols such as TCP/IP and bandwidth allocation playing a crucial role in their seamless integration. Network topology and adapters are essential foundations for establishing connections, while spectrum analyzers and testing methodologies ensure optimal network performance. Firewall testing and standards conformance are paramount for network security, with wireless LAN testing and test automation enabling efficient and effective network management.

IP addresses and fiber optic connectors facilitate communication between devices, while Wi-Fi analyzers and fiber optic splicers optimize wireless and fiber optic networks, respectively. Network simulators, latency testers, and cable certification ensure network reliability and compatibility with various standards. Light sources and compliance testing are essential for maintaining optimal network performance, while signal generators and cable testers facilitate network troubleshooting. Ethernet routers, network monitoring tools, and Ethernet switches are crucial for managing and expanding networks, with 5G testing and Bluetooth testing paving the way for future network advancements. MAC addresses and Ethernet PHYs enable unique device identification and efficient data transfer, respectively, while twisted pair cables and packet generators support network traffic analysis and simulation.

Remote access testing and power meters ensure secure and efficient network access, while network security testing and cloud testing address the evolving security challenges in today's interconnected world.

How is this Ethernet Test Equipment Industry segmented?

The ethernet test equipment industry research report provides comprehensive data (region-wise segment analysis), with forecasts and estimates in "USD million" for the period 2025-2029, as well as historical data from 2019-2023 for the following segments.

  • End-user
    • Automotive
    • Telecommunication
    • Manufacturing
    • Others
  • Product
    • 10 GbE
    • 1 GbE
    • 40 GbE and above
  • Product Type
    • Hardware
    • Software
    • Solutions
  • Geography
    • North America
      • US
      • Canada
    • Europe
      • France
      • Germany
      • Italy
      • UK
    • APAC
      • China
      • India
      • Japan
      • South Korea
    • Rest of World (ROW)

By End-user Insights

The Automotive segment is estimated to witness significant growth during the forecast period. The market encompasses a range of tools essential for evaluating and ensuring the optimal performance of ethernet networks. In various industries, including the automotive sector, ethernet technology plays a pivotal role in applications such as infotainment systems, advanced driver-assistance systems (ADAS), autonomous driving, and vehicle-to-vehicle communication. To verify the reliability, functionality, and interoperability of these networks, ethernet test equipment is indispensable. Network topology and cabling, including twisted pair, coaxial, and fiber optic cables, are assessed using cable testers, cable certification tools, and fiber optic splicers. Network adapters, such as Ethernet phys, are tested for compatibility and functionality using protocol analyzers and packet generators.

Network analyzers and spectrum analyzers are employed for monitoring and diagnosing network issues, while jitter testers measure delay variations to ensure consistent network performance. Firewall testing, compliance testing, and security testing are crucial components of the market, ensuring network security and adherence to industry standards. Test automation tools streamline the testing process, while throughput testers and bandwidth allocation tools measure network capacity and efficiency. VPN testing, 5G testing, and Bluetooth testing cater to the evolving needs of modern networks. Network simulators, latency testers, and power meters provide controlled testing environments, while network monitoring tools offer real-time insights into network performance.

Ethernet switches and routers are evaluated for their ability to handle network traffic and maintain connectivity. Light sources and signal generators are used to test fiber optic cables and components. In the automotive sector, ethernet test equipment is vital for ensuring the reliability and functionality of ethernet networks in cars. With the increasing adoption of ethernet technology in automobiles, the automotive industry represents a significant market opportunity for ethernet test equipment suppliers. This trend is fueled by the proliferation of IoT devices, cloud computing, and data center expansions, which necessitate robust and efficient network infrastructure.

Ethernet Test Equipment Market Size

Request Free Sample

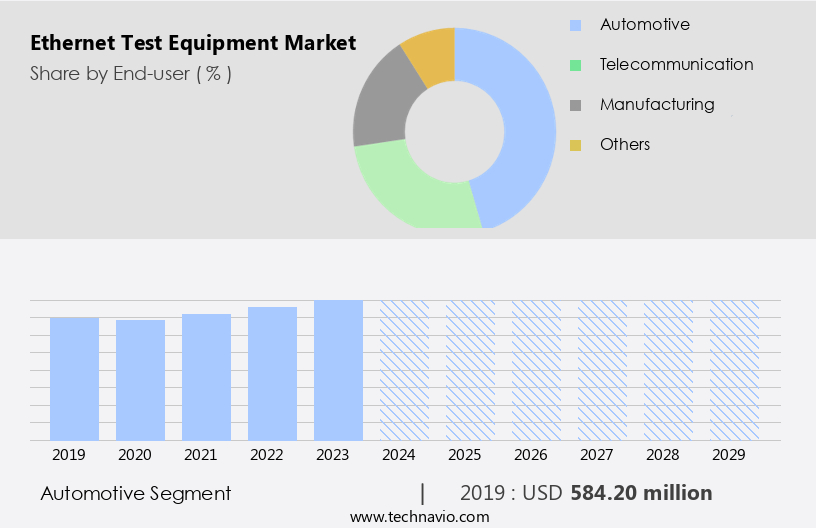
The Automotive segment was valued at USD 584.20 million in 2019 and showed a gradual increase during the forecast period.

Regional Analysis

North America is estimated to contribute 34% to the growth of the global market during the forecast period. Technavio's analysts have elaborately explained the regional trends and drivers that shape the market during the forecast period.

Ethernet Test Equipment Market Share by Geography

 Request Free Sample

The market is witnessing significant growth due to the increasing adoption of advanced network technologies, such as cloud computing and big data, in various industries, particularly in North America. The region's dominance in the market can be attributed to the widespread use of the Internet, with the US being a major contributor. Network topologies, including star, ring, and bus, require various testing tools, such as network analyzers, jitter testers, and latency testers, for ensuring optimal performance. Ethernet cables, fiber optic cables, coaxial cables, and copper cables necessitate certification through cable testers and certification tools. Firewall testing, network security testing, and compliance testing are essential for maintaining network security and ensuring adherence to standards.

Spectrum analyzers and optical spectrum analyzers are crucial for wireless LAN testing and 5G testing. Network simulators and signal generators enable the development and testing of network protocols, such as TCP/IP and network protocol analyzers. Ethernet routers, switches, and network monitoring tools facilitate throughput testing, VPN testing, and bandwidth allocation. Test automation is increasingly being adopted for enhancing efficiency and reducing human error. IP addresses, MAC addresses, and Ethernet PHYs are essential components of network infrastructure that require testing and management. Fiber optic connectors, Wi-Fi analyzers, and fiber optic splicers are vital for fiber optic networks. This trend is driven by the proliferation of IoT devices and the need for faster data transfer rates in various industries, including telecommunications, manufacturing, and healthcare.

Power meters and light sources are essential for measuring power levels and testing fiber optic cables. In the evolving technology landscape, the market trends include the integration of test automation, cloud testing, and 5G testing. Bluetooth testing and MAC address testing are gaining importance with the increasing use of IoT devices and wireless networks. The market is expected to continue its growth trajectory, driven by the increasing demand for high-speed, reliable, and secure network connections.

Market Dynamics

Our researchers analyzed the data with 2024 as the base year, along with the key drivers, trends, and challenges. A holistic analysis of drivers will help companies refine their marketing strategies to gain a competitive advantage.

What are the key market drivers leading to the rise in the adoption of Ethernet Test Equipment Industry?

  • The rise in demand for high-speed Ethernet is the primary catalyst fueling market growth. The market is experiencing significant growth due to the increasing demand for high-speed ethernet networks. This trend is driven by the expanding adoption of cloud computing, Big Data, and IoT technologies, which necessitate faster and more reliable network connections. High-performance ethernet, including ethernet at speeds of 100 Gbps or higher, is crucial for managing the escalating data traffic and providing quicker data transfer rates. It enables seamless communication and data exchange between networks, devices, and data centers, leading to efficient operations and improved user experience.
  • These devices undergo rigorous testing to verify their functionality and compatibility with various network configurations. Ethernet test equipment, such as ip address management tools, wi-fi analyzers, fiber optic splicers, network simulators, latency testers, cable certification tools, light sources, compliance testing instruments, signal generators, and cable testers, play a vital role in this process. These tools help in identifying and resolving network issues, ensuring network reliability and reducing downtime. To ensure optimal performance, companies and service providers must invest in robust network infrastructures, including ethernet switches and routers.

What are the market trends shaping the Ethernet Test Equipment Industry?

  • The IEEE 802.3bt standard is driving the emergence of next-generation Power over Ethernet (PoE) technology trend in the market. This upcoming trend signifies the mandatory adoption of this standard for delivering greater power capacity to devices connected via Ethernet cable. The market is experiencing significant growth due to the emergence of next-generation Power over Ethernet (PoE) technology, driven by the IEEE 802.3bt standard. This advanced standard enables power delivery of up to 90 watts over Ethernet cables, facilitating the efficient powering of high-performance devices such as pan-tilt-zoom cameras, LED lighting systems, and advanced wireless access points.
  • Additionally, the increasing adoption of network monitoring tools, throughput testers, VPN testing, and data acquisition systems in various industries is fueling the demand for Ethernet test equipment. Furthermore, the implementation of network protocols such as TCP/IP and bandwidth allocation, as well as the testing requirements for 5G networks, are also driving market growth. Ethernet test equipment plays a crucial role in ensuring the reliability and efficiency of networks, making it an indispensable tool for network engineers and installers. With enterprises and smart infrastructure projects increasingly adopting these power-hungry devices, the need for advanced Ethernet test equipment capable of validating IEEE 802.3bt compliance has become essential. In response, manufacturers are integrating enhanced diagnostic capabilities, higher power testing thresholds, and multi-port analysis features into their equipment.

What challenges does the Ethernet Test Equipment Industry face during its growth?

  • The intense competition prevalent in the industry poses a significant challenge to its growth. The market is characterized by intense competition, with numerous companies providing varied products and services. Key players in this market include EXFO, Viavi Solutions, Spirent Communications, Fortive, Anritsu, Tektronix, and Keysight Technologies. In addition, there are several regional players offering cost-effective solutions. The Asia Pacific region, in particular, has a significant presence in the market due to its large consumer base and price sensitivity. While these companies provide affordable options, they often compromise on product quality due to cost constraints. End-users prioritizing cost over quality opt for these low-priced alternatives. Ethernet test equipment is essential for ensuring network performance and security.
  • It is used for various applications, including Bluetooth testing, mac addresses verification, Ethernet PHY testing, twisted pair cable testing, packet generation, remote access testing, power meter measurement, and network security testing. With the increasing adoption of cloud computing and Ethernet switches, the demand for Ethernet test equipment is expected to grow. Packet generators, for instance, are crucial for testing network performance and security in cloud environments. Power meters are essential for measuring power consumption in Ethernet networks, ensuring energy efficiency and cost savings. Network security testing is another critical application area, as Ethernet networks are increasingly targeted by cybercriminals.

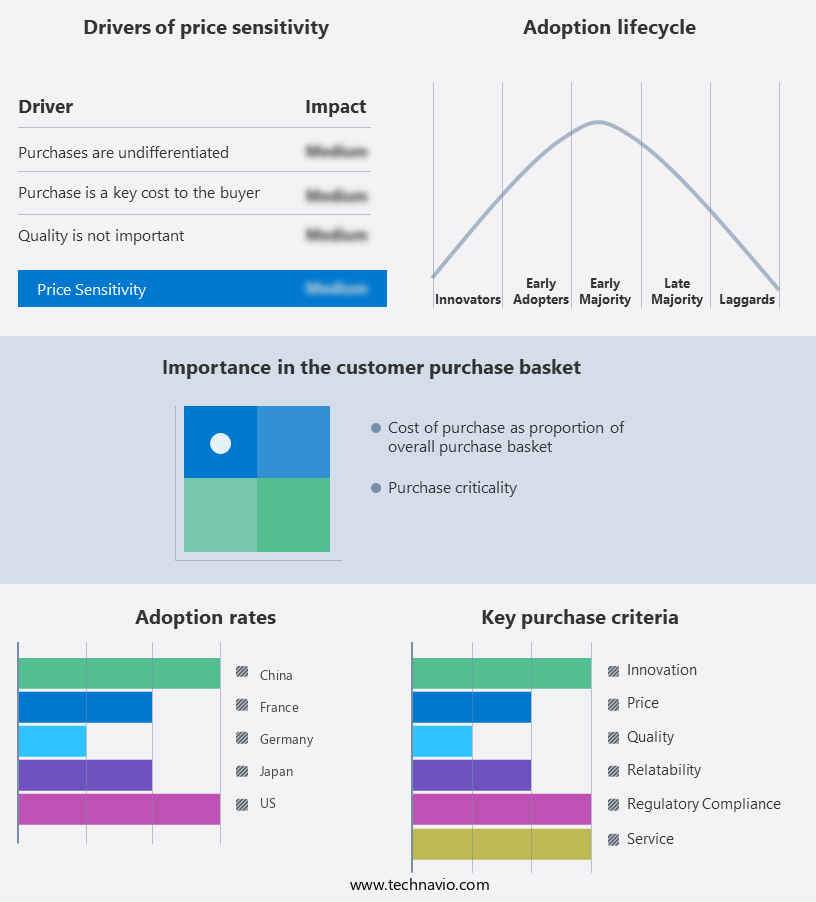
Exclusive Customer Landscape

The ethernet test equipment market forecasting report includes the adoption lifecycle of the market, covering from the innovator's stage to the laggard's stage. It focuses on adoption rates in different regions based on penetration. Furthermore, the ethernet test equipment market report also includes key purchase criteria and drivers of price sensitivity to help companies evaluate and develop their market growth analysis strategies.

Ethernet Test Equipment Market Share by Geography

 Customer Landscape

Key Companies & Market Insights

Companies are implementing various strategies, such as strategic alliances, ethernet test equipment market forecast, partnerships, mergers and acquisitions, geographical expansion, and product/service launches, to enhance their presence in the industry.

Accedian Networks Inc. - This company specializes in providing Ethernet test equipment, featuring Accedian Skylight performance monitoring solutions.

The industry research and growth report includes detailed analyses of the competitive landscape of the market and information about key companies, including:

  • Accedian Networks Inc.
  • Agilent Technologies Inc.
  • Anritsu Corp.
  • Beijing Xinertel Technology Co. Ltd.
  • EXFO Inc.
  • GAO Group Inc.
  • GL Communications Inc.
  • Ideal Industries Inc.
  • Keysight Technologies Inc.
  • Marvell Technology Inc.
  • NetScout Systems Inc.
  • Sifos Technologies Inc.
  • Silvertel
  • Spirent Communications Plc
  • TE Connectivity Ltd.
  • Teledyne Technologies Inc.
  • VeEX Inc.
  • Viavi Solutions Inc.
  • Xena Networks ApS
  • Yokogawa Electric Corp.

Qualitative and quantitative analysis of companies has been conducted to help clients understand the wider business environment as well as the strengths and weaknesses of key industry players. Data is qualitatively analyzed to categorize companies as pure play, category-focused, industry-focused, and diversified; it is quantitatively analyzed to categorize companies as dominant, leading, strong, tentative, and weak.

Recent Development and News in Ethernet Test Equipment Market

  • In January 2024, Keysight Technologies, a leading technology company, introduced the N5182A Ethernet Bit Error Rate Tester, which supports IEEE 802.3bs standard and 800G Ethernet, marking a significant leap in high-speed Ethernet testing capabilities (Keysight Technologies Press Release).
  • In March 2024, Spirent Communications and Viavi Solutions announced a strategic partnership to offer a comprehensive portfolio of Ethernet test solutions, combining Spirent's expertise in Ethernet test and measurement with Viavi's network and service assurance offerings (Viavi Solutions and Spirent Communications Press Releases).
  • In May 2024, Anritsu Corporation, a renowned test and measurement solutions provider, secured a USD 10 million contract from a leading telecommunications company for their Ethernet test equipment, underscoring the growing demand for advanced Ethernet testing solutions (Anritsu Corporation Press Release).
  • In February 2025, the European Union introduced the Digital Single Market Act, which includes provisions for interoperability testing and certification of network equipment, including Ethernet devices, aiming to boost market growth and ensure seamless connectivity across borders (European Commission Press Release).

Research Analyst Overview

The market encompasses a range of solutions designed to ensure the reliability and efficiency of various Ethernet networks. One significant trend in this market is the increasing adoption of Time-Sensitive Networking (TSN) for network deployment in industries requiring real-time communication, such as automotive and avionics. Carrier Ethernet and Ethernet over Copper continue to dominate the infrastructure landscape, while Ethernet over Fiber gains traction due to its high-speed capabilities. Network security remains a top priority, with threat detection, cable fault location, wireless security, access control, data integrity, and vulnerability assessment being key areas of focus. Performance optimization is another crucial factor, with Software-Defined Networking (SDN) and network virtualization enabling network design flexibility and improved network segmentation.

Enterprise networking also demands data encryption and penetration testing to safeguard against cyber threats. In the industrial sector, Ethernet plays a vital role in network design and troubleshooting, ensuring data integrity and enhancing automation processes. Overall, the market continues to evolve, catering to the diverse needs of various industries and applications. The market is driven by the growing demand for reliable and secure Ethernet networks. While established players offer high-quality solutions, regional players cater to cost-conscious end-users with affordable alternatives. Applications such as Bluetooth testing, mac addresses verification, Ethernet PHY testing, twisted pair cable testing, packet generation, remote access testing, power meter measurement, and network security testing continue to fuel market growth.

The Ethernet Test Equipment Market is experiencing significant growth, driven by the rapid expansion of data center infrastructure and the increasing need for high-speed connectivity solutions. Industries across the board, including industrial ethernet for factory automation, automotive ethernet in connected vehicles, and avionics ethernet for advanced aircraft systems, are demanding precise and robust testing tools to ensure reliable network performance. Fiber optic testing, link aggregation testing, network stress testing, traffic generation, packet loss analysis, QoS testing, and network simulation are additional testing requirements that cater to the diverse needs of the Ethernet ecosystem.

Dive into Technavio's robust research methodology, blending expert interviews, extensive data synthesis, and validated models for unparalleled Ethernet Test Equipment Market insights. See full methodology.

Market Scope

Report Coverage

Details

Page number

222

Base year

2024

Historic period

2019-2023

Forecast period

2025-2029

Growth momentum & CAGR

Accelerate at a CAGR of 6%

Market growth 2025-2029

USD 742 million

Market structure

Fragmented

YoY growth 2024-2025(%)

5.6

Key countries

US, China, Canada, Germany, Japan, France, India, South Korea, UK, and Italy

Competitive landscape

Leading Companies, Market Positioning of Companies, Competitive Strategies, and Industry Risks

Request Free Sample

What are the Key Data Covered in this Ethernet Test Equipment Market Research and Growth Report?

  • CAGR of the Ethernet Test Equipment industry during the forecast period
  • Detailed information on factors that will drive the growth and forecasting between 2025 and 2029
  • Precise estimation of the size of the market and its contribution of the industry in focus to the parent market
  • Accurate predictions about upcoming growth and trends and changes in consumer behaviour
  • Growth of the market across North America, APAC, Europe, Middle East and Africa, and South America
  • Thorough analysis of the market's competitive landscape and detailed information about companies
  • Comprehensive analysis of factors that will challenge the ethernet test equipment market growth of industry companies

We can help! Our analysts can customize this ethernet test equipment market research report to meet your requirements.

Get in touch

1 Executive Summary

  • 1.1 Market overview
    • Executive Summary - Chart on Market Overview
    • Executive Summary - Data Table on Market Overview
    • Executive Summary - Chart on Global Market Characteristics
    • Executive Summary - Chart on Market by Geography
    • Executive Summary - Chart on Market Segmentation by End-user
    • Executive Summary - Chart on Market Segmentation by Product
    • Executive Summary - Chart on Market Segmentation by Product Type
    • Executive Summary - Chart on Incremental Growth
    • Executive Summary - Data Table on Incremental Growth
    • Executive Summary - Chart on Company Market Positioning

2 Technavio Analysis

  • 2.1 Analysis of price sensitivity, lifecycle, customer purchase basket, adoption rates, and purchase criteria
    • Analysis of price sensitivity, lifecycle, customer purchase basket, adoption rates, and purchase criteria
  • 2.2 Criticality of inputs and Factors of differentiation
    • Overview on criticality of inputs and factors of differentiation
  • 2.3 Factors of disruption
    • Overview on factors of disruption
  • 2.4 Impact of drivers and challenges
    • Impact of drivers and challenges in 2024 and 2029

3 Market Landscape

  • 3.1 Market ecosystem
    • Parent Market
    • Data Table on - Parent Market
  • 3.2 Market characteristics
    • Market characteristics analysis
  • 3.3 Value chain analysis
    • Value chain analysis

4 Market Sizing

  • 4.1 Market definition
    • Offerings of companies included in the market definition
  • 4.2 Market segment analysis
    • Market segments
  • 4.3 Market size 2024
    • 4.4 Market outlook: Forecast for 2024-2029
      • Chart on Global - Market size and forecast 2024-2029 ($ million)
      • Data Table on Global - Market size and forecast 2024-2029 ($ million)
      • Chart on Global Market: Year-over-year growth 2024-2029 (%)
      • Data Table on Global Market: Year-over-year growth 2024-2029 (%)

    5 Historic Market Size

    • 5.1 Global Ethernet Test Equipment Market 2019 - 2023
      • Historic Market Size - Data Table on Global Ethernet Test Equipment Market 2019 - 2023 ($ million)
    • 5.2 End-user segment analysis 2019 - 2023
      • Historic Market Size - End-user Segment 2019 - 2023 ($ million)
    • 5.3 Product segment analysis 2019 - 2023
      • Historic Market Size - Product Segment 2019 - 2023 ($ million)
    • 5.4 Product Type segment analysis 2019 - 2023
      • Historic Market Size - Product Type Segment 2019 - 2023 ($ million)
    • 5.5 Geography segment analysis 2019 - 2023
      • Historic Market Size - Geography Segment 2019 - 2023 ($ million)
    • 5.6 Country segment analysis 2019 - 2023
      • Historic Market Size - Country Segment 2019 - 2023 ($ million)

    6 Qualitative Analysis

    • 6.1 The AI impact on Global Ethernet Test Equipment Market

      7 Five Forces Analysis

      • 7.1 Five forces summary
        • Five forces analysis - Comparison between 2024 and 2029
      • 7.2 Bargaining power of buyers
        • Bargaining power of buyers - Impact of key factors 2024 and 2029
      • 7.3 Bargaining power of suppliers
        • Bargaining power of suppliers - Impact of key factors in 2024 and 2029
      • 7.4 Threat of new entrants
        • Threat of new entrants - Impact of key factors in 2024 and 2029
      • 7.5 Threat of substitutes
        • Threat of substitutes - Impact of key factors in 2024 and 2029
      • 7.6 Threat of rivalry
        • Threat of rivalry - Impact of key factors in 2024 and 2029
      • 7.7 Market condition
        • Chart on Market condition - Five forces 2024 and 2029

      8 Market Segmentation by End-user

      • 8.1 Market segments
        • Chart on End-user - Market share 2024-2029 (%)
        • Data Table on End-user - Market share 2024-2029 (%)
      • 8.2 Comparison by End-user
        • Chart on Comparison by End-user
        • Data Table on Comparison by End-user
      • 8.3 Automotive - Market size and forecast 2024-2029
        • Chart on Automotive - Market size and forecast 2024-2029 ($ million)
        • Data Table on Automotive - Market size and forecast 2024-2029 ($ million)
        • Chart on Automotive - Year-over-year growth 2024-2029 (%)
        • Data Table on Automotive - Year-over-year growth 2024-2029 (%)
      • 8.4 Telecommunication - Market size and forecast 2024-2029
        • Chart on Telecommunication - Market size and forecast 2024-2029 ($ million)
        • Data Table on Telecommunication - Market size and forecast 2024-2029 ($ million)
        • Chart on Telecommunication - Year-over-year growth 2024-2029 (%)
        • Data Table on Telecommunication - Year-over-year growth 2024-2029 (%)
      • 8.5 Manufacturing - Market size and forecast 2024-2029
        • Chart on Manufacturing - Market size and forecast 2024-2029 ($ million)
        • Data Table on Manufacturing - Market size and forecast 2024-2029 ($ million)
        • Chart on Manufacturing - Year-over-year growth 2024-2029 (%)
        • Data Table on Manufacturing - Year-over-year growth 2024-2029 (%)
      • 8.6 Others - Market size and forecast 2024-2029
        • Chart on Others - Market size and forecast 2024-2029 ($ million)
        • Data Table on Others - Market size and forecast 2024-2029 ($ million)
        • Chart on Others - Year-over-year growth 2024-2029 (%)
        • Data Table on Others - Year-over-year growth 2024-2029 (%)
      • 8.7 Market opportunity by End-user
        • Market opportunity by End-user ($ million)
        • Data Table on Market opportunity by End-user ($ million)

      9 Market Segmentation by Product

      • 9.1 Market segments
        • Chart on Product - Market share 2024-2029 (%)
        • Data Table on Product - Market share 2024-2029 (%)
      • 9.2 Comparison by Product
        • Chart on Comparison by Product
        • Data Table on Comparison by Product
      • 10 GbE - Market size and forecast 2024-2029
        • Chart on 10 GbE - Market size and forecast 2024-2029 ($ million)
        • Data Table on 10 GbE - Market size and forecast 2024-2029 ($ million)
        • Chart on 10 GbE - Year-over-year growth 2024-2029 (%)
        • Data Table on 10 GbE - Year-over-year growth 2024-2029 (%)
      • 1 GbE - Market size and forecast 2024-2029
        • Chart on 1 GbE - Market size and forecast 2024-2029 ($ million)
        • Data Table on 1 GbE - Market size and forecast 2024-2029 ($ million)
        • Chart on 1 GbE - Year-over-year growth 2024-2029 (%)
        • Data Table on 1 GbE - Year-over-year growth 2024-2029 (%)
      • 40 GbE and above - Market size and forecast 2024-2029
        • Chart on 40 GbE and above - Market size and forecast 2024-2029 ($ million)
        • Data Table on 40 GbE and above - Market size and forecast 2024-2029 ($ million)
        • Chart on 40 GbE and above - Year-over-year growth 2024-2029 (%)
        • Data Table on 40 GbE and above - Year-over-year growth 2024-2029 (%)
      • 9.6 Market opportunity by Product
        • Market opportunity by Product ($ million)
        • Data Table on Market opportunity by Product ($ million)

      10 Market Segmentation by Product Type

      • 10.1 Market segments
        • Chart on Product Type - Market share 2024-2029 (%)
        • Data Table on Product Type - Market share 2024-2029 (%)
      • 10.2 Comparison by Product Type
        • Chart on Comparison by Product Type
        • Data Table on Comparison by Product Type
      • 10.3 Hardware - Market size and forecast 2024-2029
        • Chart on Hardware - Market size and forecast 2024-2029 ($ million)
        • Data Table on Hardware - Market size and forecast 2024-2029 ($ million)
        • Chart on Hardware - Year-over-year growth 2024-2029 (%)
        • Data Table on Hardware - Year-over-year growth 2024-2029 (%)
      • 10.4 Software - Market size and forecast 2024-2029
        • Chart on Software - Market size and forecast 2024-2029 ($ million)
        • Data Table on Software - Market size and forecast 2024-2029 ($ million)
        • Chart on Software - Year-over-year growth 2024-2029 (%)
        • Data Table on Software - Year-over-year growth 2024-2029 (%)
      • 10.5 Solutions - Market size and forecast 2024-2029
        • Chart on Solutions - Market size and forecast 2024-2029 ($ million)
        • Data Table on Solutions - Market size and forecast 2024-2029 ($ million)
        • Chart on Solutions - Year-over-year growth 2024-2029 (%)
        • Data Table on Solutions - Year-over-year growth 2024-2029 (%)
      • 10.6 Market opportunity by Product Type
        • Market opportunity by Product Type ($ million)
        • Data Table on Market opportunity by Product Type ($ million)

      11 Customer Landscape

      • 11.1 Customer landscape overview
        • Analysis of price sensitivity, lifecycle, customer purchase basket, adoption rates, and purchase criteria

      12 Geographic Landscape

      • 12.1 Geographic segmentation
        • Chart on Market share by geography 2024-2029 (%)
        • Data Table on Market share by geography 2024-2029 (%)
      • 12.2 Geographic comparison
        • Chart on Geographic comparison
        • Data Table on Geographic comparison
      • 12.3 North America - Market size and forecast 2024-2029
        • Chart on North America - Market size and forecast 2024-2029 ($ million)
        • Data Table on North America - Market size and forecast 2024-2029 ($ million)
        • Chart on North America - Year-over-year growth 2024-2029 (%)
        • Data Table on North America - Year-over-year growth 2024-2029 (%)
      • 12.4 APAC - Market size and forecast 2024-2029
        • Chart on APAC - Market size and forecast 2024-2029 ($ million)
        • Data Table on APAC - Market size and forecast 2024-2029 ($ million)
        • Chart on APAC - Year-over-year growth 2024-2029 (%)
        • Data Table on APAC - Year-over-year growth 2024-2029 (%)
      • 12.5 Europe - Market size and forecast 2024-2029
        • Chart on Europe - Market size and forecast 2024-2029 ($ million)
        • Data Table on Europe - Market size and forecast 2024-2029 ($ million)
        • Chart on Europe - Year-over-year growth 2024-2029 (%)
        • Data Table on Europe - Year-over-year growth 2024-2029 (%)
      • 12.6 Middle East and Africa - Market size and forecast 2024-2029
        • Chart on Middle East and Africa - Market size and forecast 2024-2029 ($ million)
        • Data Table on Middle East and Africa - Market size and forecast 2024-2029 ($ million)
        • Chart on Middle East and Africa - Year-over-year growth 2024-2029 (%)
        • Data Table on Middle East and Africa - Year-over-year growth 2024-2029 (%)
      • 12.7 South America - Market size and forecast 2024-2029
        • Chart on South America - Market size and forecast 2024-2029 ($ million)
        • Data Table on South America - Market size and forecast 2024-2029 ($ million)
        • Chart on South America - Year-over-year growth 2024-2029 (%)
        • Data Table on South America - Year-over-year growth 2024-2029 (%)
      • 12.8 US - Market size and forecast 2024-2029
        • Chart on US - Market size and forecast 2024-2029 ($ million)
        • Data Table on US - Market size and forecast 2024-2029 ($ million)
        • Chart on US - Year-over-year growth 2024-2029 (%)
        • Data Table on US - Year-over-year growth 2024-2029 (%)
      • 12.9 China - Market size and forecast 2024-2029
        • Chart on China - Market size and forecast 2024-2029 ($ million)
        • Data Table on China - Market size and forecast 2024-2029 ($ million)
        • Chart on China - Year-over-year growth 2024-2029 (%)
        • Data Table on China - Year-over-year growth 2024-2029 (%)
      • 12.10 Canada - Market size and forecast 2024-2029
        • Chart on Canada - Market size and forecast 2024-2029 ($ million)
        • Data Table on Canada - Market size and forecast 2024-2029 ($ million)
        • Chart on Canada - Year-over-year growth 2024-2029 (%)
        • Data Table on Canada - Year-over-year growth 2024-2029 (%)
      • 12.11 Germany - Market size and forecast 2024-2029
        • Chart on Germany - Market size and forecast 2024-2029 ($ million)
        • Data Table on Germany - Market size and forecast 2024-2029 ($ million)
        • Chart on Germany - Year-over-year growth 2024-2029 (%)
        • Data Table on Germany - Year-over-year growth 2024-2029 (%)
      • 12.12 Japan - Market size and forecast 2024-2029
        • Chart on Japan - Market size and forecast 2024-2029 ($ million)
        • Data Table on Japan - Market size and forecast 2024-2029 ($ million)
        • Chart on Japan - Year-over-year growth 2024-2029 (%)
        • Data Table on Japan - Year-over-year growth 2024-2029 (%)
      • 12.13 France - Market size and forecast 2024-2029
        • Chart on France - Market size and forecast 2024-2029 ($ million)
        • Data Table on France - Market size and forecast 2024-2029 ($ million)
        • Chart on France - Year-over-year growth 2024-2029 (%)
        • Data Table on France - Year-over-year growth 2024-2029 (%)
      • 12.14 India - Market size and forecast 2024-2029
        • Chart on India - Market size and forecast 2024-2029 ($ million)
        • Data Table on India - Market size and forecast 2024-2029 ($ million)
        • Chart on India - Year-over-year growth 2024-2029 (%)
        • Data Table on India - Year-over-year growth 2024-2029 (%)
      • 12.15 South Korea - Market size and forecast 2024-2029
        • Chart on South Korea - Market size and forecast 2024-2029 ($ million)
        • Data Table on South Korea - Market size and forecast 2024-2029 ($ million)
        • Chart on South Korea - Year-over-year growth 2024-2029 (%)
        • Data Table on South Korea - Year-over-year growth 2024-2029 (%)
      • 12.16 UK - Market size and forecast 2024-2029
        • Chart on UK - Market size and forecast 2024-2029 ($ million)
        • Data Table on UK - Market size and forecast 2024-2029 ($ million)
        • Chart on UK - Year-over-year growth 2024-2029 (%)
        • Data Table on UK - Year-over-year growth 2024-2029 (%)
      • 12.17 Italy - Market size and forecast 2024-2029
        • Chart on Italy - Market size and forecast 2024-2029 ($ million)
        • Data Table on Italy - Market size and forecast 2024-2029 ($ million)
        • Chart on Italy - Year-over-year growth 2024-2029 (%)
        • Data Table on Italy - Year-over-year growth 2024-2029 (%)
      • 12.18 Market opportunity by geography
        • Market opportunity by geography ($ million)
        • Data Tables on Market opportunity by geography ($ million)

      13 Drivers, Challenges, and Opportunity/Restraints

      • 13.1 Market drivers
        • 13.2 Market challenges
          • 13.3 Impact of drivers and challenges
            • Impact of drivers and challenges in 2024 and 2029
          • 13.4 Market opportunities/restraints

            14 Competitive Landscape

            • 14.1 Overview
              • 14.2 Competitive Landscape
                • Overview on criticality of inputs and factors of differentiation
              • 14.3 Landscape disruption
                • Overview on factors of disruption
              • 14.4 Industry risks
                • Impact of key risks on business

              15 Competitive Analysis

              • 15.1 Companies profiled
                • Companies covered
              • 15.2 Company ranking index
                • Company ranking index
              • 15.3 Market positioning of companies
                • Matrix on companies position and classification
              • 15.4 Accedian Networks Inc.
                • Accedian Networks Inc. - Overview
                • Accedian Networks Inc. - Product / Service
                • Accedian Networks Inc. - Key offerings
                • SWOT
              • 15.5 Agilent Technologies Inc.
                • Agilent Technologies Inc. - Overview
                • Agilent Technologies Inc. - Business segments
                • Agilent Technologies Inc. - Key news
                • Agilent Technologies Inc. - Key offerings
                • Agilent Technologies Inc. - Segment focus
                • SWOT
              • 15.6 Anritsu Corp.
                • Anritsu Corp. - Overview
                • Anritsu Corp. - Business segments
                • Anritsu Corp. - Key offerings
                • Anritsu Corp. - Segment focus
                • SWOT
              • 15.7 Beijing Xinertel Technology Co. Ltd.
                • Beijing Xinertel Technology Co. Ltd. - Overview
                • Beijing Xinertel Technology Co. Ltd. - Product / Service
                • Beijing Xinertel Technology Co. Ltd. - Key offerings
                • SWOT
              • 15.8 EXFO Inc.
                • EXFO Inc. - Overview
                • EXFO Inc. - Product / Service
                • EXFO Inc. - Key offerings
                • SWOT
              • 15.9 GAO Group Inc.
                • GAO Group Inc. - Overview
                • GAO Group Inc. - Product / Service
                • GAO Group Inc. - Key offerings
                • SWOT
              • 15.10 GL Communications Inc.
                • GL Communications Inc. - Overview
                • GL Communications Inc. - Product / Service
                • GL Communications Inc. - Key offerings
                • SWOT
              • 15.11 Ideal Industries Inc.
                • Ideal Industries Inc. - Overview
                • Ideal Industries Inc. - Product / Service
                • Ideal Industries Inc. - Key offerings
                • SWOT
              • 15.12 Keysight Technologies Inc.
                • Keysight Technologies Inc. - Overview
                • Keysight Technologies Inc. - Business segments
                • Keysight Technologies Inc. - Key news
                • Keysight Technologies Inc. - Key offerings
                • Keysight Technologies Inc. - Segment focus
                • SWOT
              • 15.13 Silvertel
                • Silvertel - Overview
                • Silvertel - Product / Service
                • Silvertel - Key offerings
                • SWOT
              • 15.14 Spirent Communications Plc
                • Spirent Communications Plc - Overview
                • Spirent Communications Plc - Product / Service
                • Spirent Communications Plc - Key offerings
                • SWOT
              • 15.15 Teledyne Technologies Inc.
                • Teledyne Technologies Inc. - Overview
                • Teledyne Technologies Inc. - Business segments
                • Teledyne Technologies Inc. - Key news
                • Teledyne Technologies Inc. - Key offerings
                • Teledyne Technologies Inc. - Segment focus
                • SWOT
              • 15.16 Viavi Solutions Inc.
                • Viavi Solutions Inc. - Overview
                • Viavi Solutions Inc. - Business segments
                • Viavi Solutions Inc. - Key news
                • Viavi Solutions Inc. - Key offerings
                • Viavi Solutions Inc. - Segment focus
                • SWOT
              • 15.17 Xena Networks ApS
                • Xena Networks ApS - Overview
                • Xena Networks ApS - Product / Service
                • Xena Networks ApS - Key offerings
                • SWOT
              • 15.18 Yokogawa Electric Corp.
                • Yokogawa Electric Corp. - Overview
                • Yokogawa Electric Corp. - Business segments
                • Yokogawa Electric Corp. - Key news
                • Yokogawa Electric Corp. - Key offerings
                • Yokogawa Electric Corp. - Segment focus
                • SWOT

              16 Appendix

              • 16.1 Scope of the report
                • 16.2 Inclusions and exclusions checklist
                  • Inclusions checklist
                  • Exclusions checklist
                • 16.3 Currency conversion rates for US$
                  • Currency conversion rates for US$
                • 16.4 Research methodology
                  • Research methodology
                • 16.5 Data procurement
                  • Information sources
                • 16.6 Data validation
                  • Data validation
                • 16.7 Validation techniques employed for market sizing
                  • Validation techniques employed for market sizing
                • 16.8 Data synthesis
                  • Data synthesis
                • 16.9 360 degree market analysis
                  • 360 degree market analysis
                • 16.10 List of abbreviations
                  • List of abbreviations

                Research Methodology

                Technavio presents a detailed picture of the market by way of study, synthesis, and summation of data from multiple sources. The analysts have presented the various facets of the market with a particular focus on identifying the key industry influencers. The data thus presented is comprehensive, reliable, and the result of extensive research, both primary and secondary.

                INFORMATION SOURCES

                Primary sources

                • Manufacturers and suppliers
                • Channel partners
                • Industry experts
                • Strategic decision makers

                Secondary sources

                • Industry journals and periodicals
                • Government data
                • Financial reports of key industry players
                • Historical data
                • Press releases

                DATA ANALYSIS

                Data Synthesis

                • Collation of data
                • Estimation of key figures
                • Analysis of derived insights

                Data Validation

                • Triangulation with data models
                • Reference against proprietary databases
                • Corroboration with industry experts

                REPORT WRITING

                Qualitative

                • Market drivers
                • Market challenges
                • Market trends
                • Five forces analysis

                Quantitative

                • Market size and forecast
                • Market segmentation
                • Geographical insights
                • Competitive landscape

                Interested in this report?

                Get your sample now to see our research methodology and insights!

                Download Now

                Frequently Asked Questions

                Ethernet Test Equipment market growth will increase by $ 742 mn during 2025-2029.

                The Ethernet Test Equipment market is expected to grow at a CAGR of 6% during 2025-2029.

                Ethernet Test Equipment market is segmented by End-user( Automotive, Telecommunication, Manufacturing, Others) Product( 10 GbE, 1 GbE, 40 GbE and above, MEA, South America) Product Type( Hardware, Software, Solutions, Middle East and Africa, South America)

                Accedian Networks Inc., Agilent Technologies Inc., Anritsu Corp., Beijing Xinertel Technology Co. Ltd., EXFO Inc., GAO Group Inc., GL Communications Inc., Ideal Industries Inc., Keysight Technologies Inc., Marvell Technology Inc., NetScout Systems Inc., Sifos Technologies Inc., Silvertel, Spirent Communications Plc, TE Connectivity Ltd., Teledyne Technologies Inc., VeEX Inc., Viavi Solutions Inc., Xena Networks ApS, Yokogawa Electric Corp. are a few of the key vendors in the Ethernet Test Equipment market.

                North America will register the highest growth rate of 34% among the other regions. Therefore, the Ethernet Test Equipment market in North America is expected to garner significant business opportunities for the vendors during the forecast period.

                US, China, Canada, Germany, Japan, France, India, South Korea, UK, Italy

                • Rising demand for high-speed ethernetHigh-speed ethernet is playing an increasingly important role in the global ethernet test equipment market as the demand continues to grow. This is due to the rapid adoption of cloud computing is the driving factor this market.
                • Big Data is the driving factor this market.
                • and IoT technologies is the driving factor this market.
                • which have necessitated faster and more dependable network connections. High-performance ethernet is the driving factor this market.
                • including ethernet at speeds of 100 Gbps or higher is the driving factor this market.
                • is essential for managing the ever-growing amount of data traffic and providing faster data transfer speeds. It facilitates the communication and exchange of data between networks is the driving factor this market.
                • devices is the driving factor this market.
                • and data centers is the driving factor this market.
                • resulting in efficient operations and enhanced user experience. Companies and service providers must invest in reliable and advanced network infrastructures to meet the requirements of high-performance ethernet is the driving factor this market.
                • which includes the implementation of ethernet switches and routers is the driving factor this market.
                • which require rigorous testing to guarantee optimal performance. Ethernet test equipment plays an essential role in the verification and validation of the performance is the driving factor this market.
                • function is the driving factor this market.
                • and interconnectivity of ethernet networks is the driving factor this market.
                • as well as in the identification and troubleshooting of network issues is the driving factor this market.
                • the measurement of signal quality is the driving factor this market.
                • and adherence to industry standards.While the adoption of high-speed ethernet will aid end-users in ensuring smooth network flow is the driving factor this market.
                • it would also increase the demand for holistic testing to realize its true benefit. The need to maintain the continuity and reliability of 400 GbE will require highly efficient testing is the driving factor this market.
                • which in turn will drive down the demand for ethernet test equipment. Companies are also developing test solutions for the 400 GbE network. With these multi-rate options is the driving factor this market.
                • network equipment manufacturers can test products at speeds based on the new IEEE 802.3cd draft standard and IEEE 802.3bs standard. The need for reliable and efficient network connections is the driving factor this market.
                • fueled by the growing use of technologies such as cloud computing and IoT is the driving factor this market.
                • will drive the growth of the global ethernet test equipment market during the forecast period. is the driving factor this market.

                The Ethernet Test Equipment market vendors should focus on grabbing business opportunities from the Automotive segment as it accounted for the largest market share in the base year.