Epidermal Growth Factor Receptor (EGFR) Inhibitors Market Analysis, Size, and Forecast 2026-2030: North America (US, Canada, and Mexico), Europe (Germany, UK, and France), APAC (China, India, and Japan), South America (Brazil, Argentina, and Colombia), Middle East and Africa (Saudi Arabia, UAE, and Turkey), Asia, Rest of World (ROW)

Epidermal Growth Factor Receptor (EGFR) Inhibitors Market Analysis, Size, and Forecast 2026-2030:
North America (US, Canada, and Mexico), Europe (Germany, UK, and France), APAC (China, India, and Japan), South America (Brazil, Argentina, and Colombia), Middle East and Africa (Saudi Arabia, UAE, and Turkey), Asia, Rest of World (ROW)

Published: Mar 2026 299 Pages SKU: IRTNTR72701

Market Overview at a Glance

$11.94 B
Market Opportunity
10.7%
CAGR 2025 - 2030
37.8%
North America Growth
$9.93 B
Lung cancer segment 2024

Epidermal Growth Factor Receptor (EGFR) Inhibitors Market Size 2026-2030

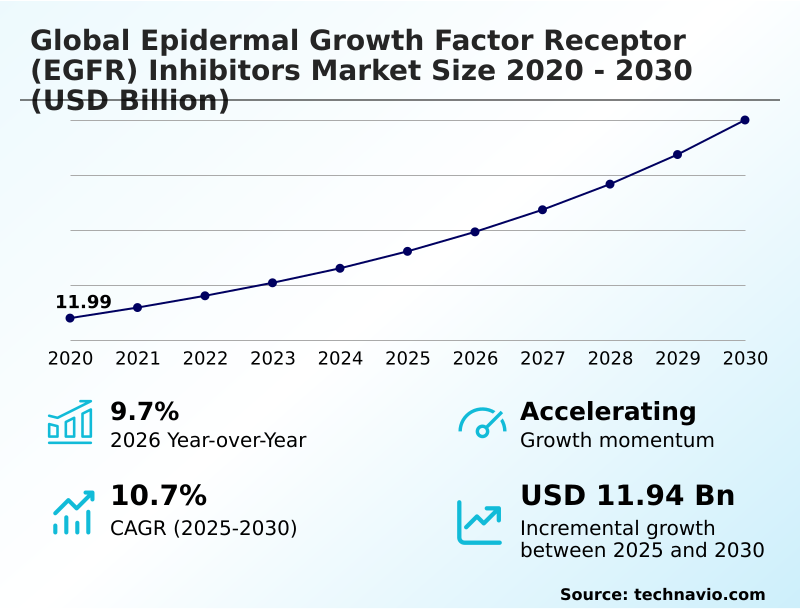
The epidermal growth factor receptor (egfr) inhibitors market size is valued to increase by USD 11.94 billion, at a CAGR of 10.7% from 2025 to 2030. Advancements in combination therapies and regulatory approvals will drive the epidermal growth factor receptor (egfr) inhibitors market.

Major Market Trends & Insights

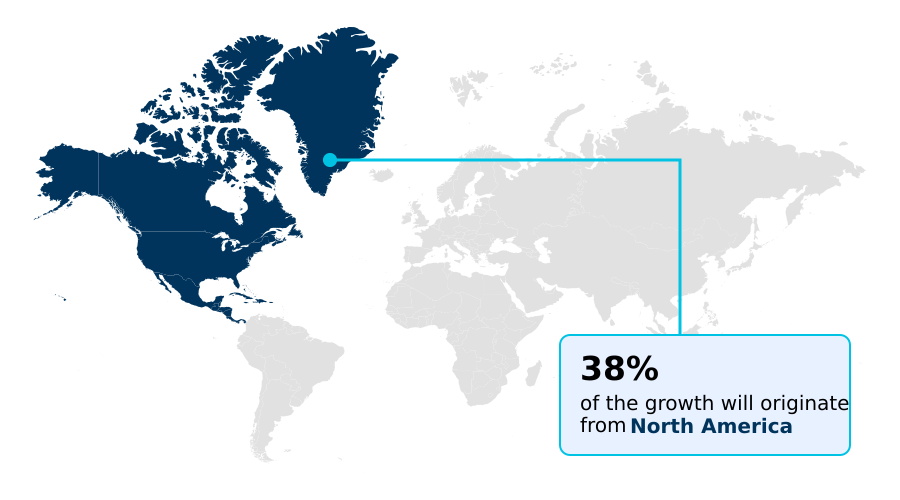
  • North America dominated the market and accounted for a 37.8% growth during the forecast period.
  • By Indication - Lung cancer segment was valued at USD 9.93 billion in 2024
  • By Distribution Channel - Retail pharmacies segment accounted for the largest market revenue share in 2024

Market Size & Forecast

  • Market Opportunities: USD 18.01 billion
  • Market Future Opportunities: USD 11.94 billion
  • CAGR from 2025 to 2030 : 10.7%

Market Summary

  • The epidermal growth factor receptor (EGFR) inhibitors market is defined by a relentless pursuit of precision oncology to combat mutation-driven tumors, particularly non-small cell lung cancer. Market expansion is fueled by the development of next-generation inhibitors and combination regimens designed to enhance clinical outcomes and overcome acquired resistance.
  • A primary trend involves the integration of advanced molecular diagnostics, such as liquid biopsy technology and genomic profiling, to enable highly specific patient selection and personalized treatment strategies. This synergy between therapeutics and diagnostics is crucial for improving progression-free survival. However, the industry grapples with the challenge of treatment-induced toxicities and the high costs associated with novel therapies.
  • A key operational scenario involves optimizing the supply chain for both oral formulations, which offer patient convenience, and intravenous monoclonal antibodies, which require specialized clinical administration.
  • The successful management of this dual supply model is essential for ensuring broad market access and maintaining therapeutic continuity for patients with locally advanced or metastatic disease, ultimately impacting both clinical success rates and commercial viability.

What will be the Size of the Epidermal Growth Factor Receptor (EGFR) Inhibitors Market during the forecast period?

Get Key Insights on Market Forecast (PDF) Request Free Sample

How is the Epidermal Growth Factor Receptor (EGFR) Inhibitors Market Segmented?

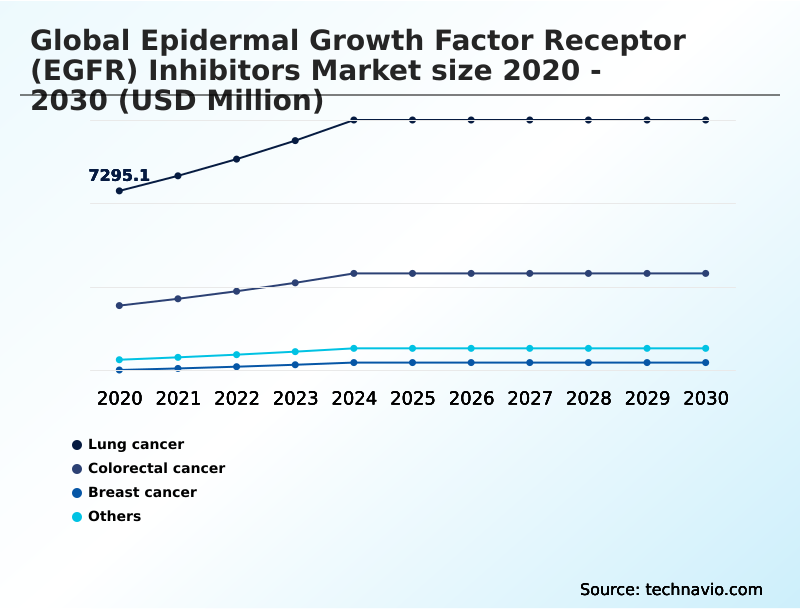
The epidermal growth factor receptor (egfr) inhibitors industry research report provides comprehensive data (region-wise segment analysis), with forecasts and estimates in "USD million" for the period 2026-2030, as well as historical data from 2020-2024 for the following segments.

  • Indication
    • Lung cancer
    • Colorectal cancer
    • Breast cancer
    • Others
  • Distribution channel
    • Retail pharmacies
    • Hospital pharmacies
    • Online pharmacies
  • Drug class
    • Small molecule TKIs
    • Monoclonal antibodies
  • Geography
    • North America
      • US
      • Canada
      • Mexico
    • Europe
      • Germany
      • UK
      • France
    • Asia
    • Rest of World (ROW)

By Indication Insights

The lung cancer segment is estimated to witness significant growth during the forecast period.

The lung cancer segment dominates the epidermal growth factor receptor (EGFR) inhibitors market, driven by the high prevalence of targetable mutations in non-small cell lung cancer.

Innovations in therapeutic agents, including both small molecule therapies and monoclonal antibodies, focus on mutation-specific targeting to improve clinical efficacy. Development is geared toward addressing acquired resistance and improving progression-free survival.

For instance, the approval of new combination regimens for first-line treatment of locally advanced cancer underscores a strategic shift. This focus on precision medicine is supported by advanced biomarker screening and molecular profiling, which have become standard practice.

In fact, the adoption of these targeted therapies in North America contributes to over 37% of the market's incremental growth, reflecting deep market penetration and a robust diagnostic infrastructure.

Request Free Sample

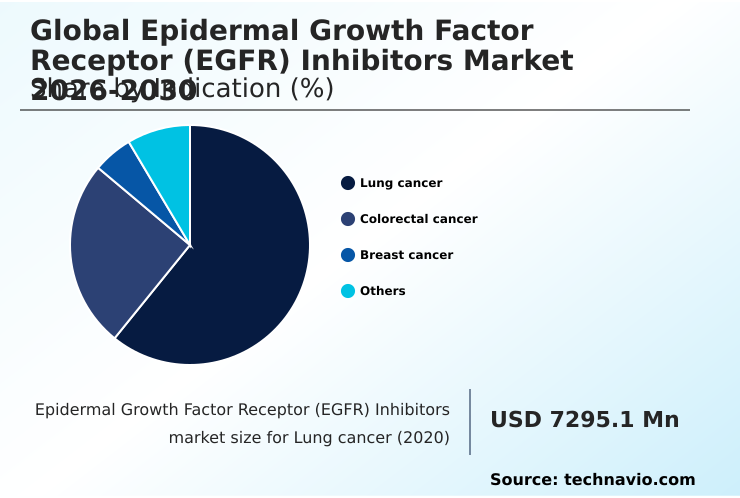
The Lung cancer segment was valued at USD 9.93 billion in 2024 and showed a gradual increase during the forecast period.

Request Free Sample

Regional Analysis

North America is estimated to contribute 37.8% to the growth of the global market during the forecast period.Technavio’s analysts have elaborately explained the regional trends and drivers that shape the market during the forecast period.

See How Epidermal Growth Factor Receptor (EGFR) Inhibitors Market Demand is Rising in North America Request Free Sample

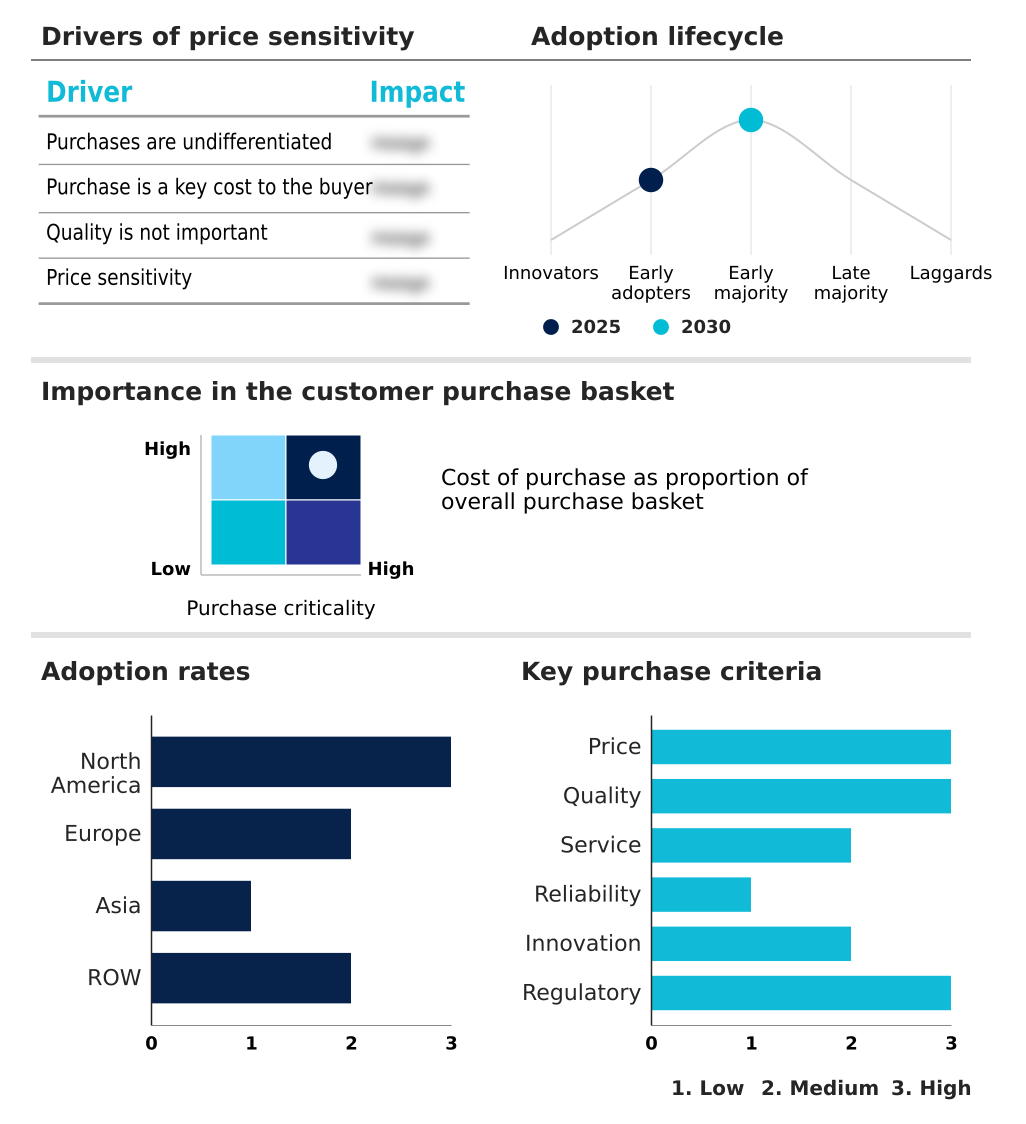
The geographic landscape is characterized by varied adoption rates and clinical priorities.

North America leads, accounting for over 37% of the market's incremental growth, driven by a sophisticated healthcare infrastructure that supports advanced biomarker screening and rapid uptake of new therapeutic agents for metastatic disease.

Europe follows, with a strong emphasis on evidence-based regulatory approvals for combination regimens and next-generation inhibitors.

The Asia region is projected to exhibit the fastest growth, with a CAGR of 12.2%, fueled by a high prevalence of EGFR mutations, rising healthcare expenditure, and increasing access to molecular diagnostics.

In these regions, the strategic focus on precision medicine is improving clinical outcomes, with some health systems reporting a 15% improvement in patient selection efficiency due to integrated digital health platforms.

Market Dynamics

Our researchers analyzed the data with 2025 as the base year, along with the key drivers, trends, and challenges. A holistic analysis of drivers will help companies refine their marketing strategies to gain a competitive advantage.

  • The strategic focus within the global epidermal growth factor receptor (EGFR) inhibitors market 2026-2030 is increasingly granular, moving beyond broad indications to address specific molecular challenges. A critical area is the development of EGFR inhibitors for brain metastases, which requires overcoming the blood-brain barrier, a significant hurdle for many existing drugs.
  • Simultaneously, research into overcoming resistance to EGFR inhibitors is paramount, with a focus on creating fourth-generation tkis for c797s mutation and other acquired resistance pathways. The management of side effects of tkis remains a key factor in ensuring long-term treatment viability, directly influencing strategies for improving patient compliance with oral inhibitors.
  • For clinical practice, the development of combination therapy for EGFR mutated NSCLC continues to evolve, integrating targeted agents with chemotherapy or immuno-oncology treatments. The transition toward subcutaneous delivery of monoclonal antibodies represents a major logistical shift, as streamlining the supply chain for these biologics presents different challenges compared to oral tkis.
  • In diagnostics, the role of liquid biopsy in monitoring treatment response and the use of next-generation sequencing for patient selection are becoming standard.
  • This precision is essential for matching patients to therapies like bispecific antibodies in oncology and antibody-drug conjugates for solid tumors, expanding the application of EGFR inhibition beyond lung cancer into areas such as breast, colorectal, and even pancreatic cancer.

What are the key market drivers leading to the rise in the adoption of Epidermal Growth Factor Receptor (EGFR) Inhibitors Industry?

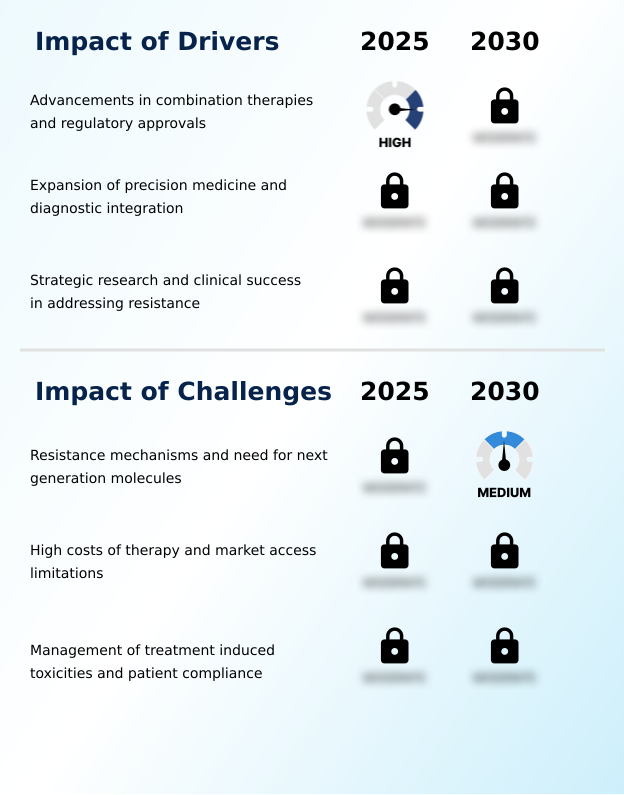
  • Advancements in combination therapies coupled with supportive regulatory approvals are key drivers propelling market growth.

  • The market is primarily driven by the continuous approval of novel combination regimens that enhance clinical outcomes. These strategies often pair tyrosine kinase inhibitors with chemotherapy or other targeted therapies to combat tumor growth more aggressively and delay acquired resistance.
  • Successful regulatory approvals for first-line treatment and second-line treatment options in indications like non-small cell lung cancer validate the efficacy of these multi-faceted approaches. For example, certain combination therapies have improved progression-free survival by over 20% in specific patient cohorts.
  • The expansion of precision medicine, underpinned by the development of companion diagnostics and wider use of liquid biopsy technology, ensures that the right therapeutic agents are matched to patients with specific genetic biomarkers, further propelling adoption and improving clinical success rates.

What are the market trends shaping the Epidermal Growth Factor Receptor (EGFR) Inhibitors Industry?

  • Advancements in next-generation tyrosine kinase inhibitors (TKIs) designed to target complex mutations represent a significant upcoming market trend. This evolution in targeted therapy aims to address treatment resistance and improve outcomes for patients with specific genetic profiles.

  • A key trend is the advancement of next-generation inhibitors, including fourth-generation inhibitors, designed to address complex resistance mechanisms such as the c797s mutation. This reflects a broader industry movement toward multi-target precision medicine.
  • Concurrently, there is a significant shift toward patient-centric delivery methods, including oral formulations and subcutaneous delivery, which have been shown to reduce clinic visit times by up to 50%. This focus on convenience enhances patient adherence and quality of life.
  • The integration of AI-powered biomarker screening and digital health platforms is also accelerating, with algorithms now capable of analyzing genomic profiling data 40% faster than manual methods, enabling more rapid and accurate patient selection for targeted therapies. This synergy of advanced molecular diagnostics and novel therapeutic agents is redefining care standards.

What challenges does the Epidermal Growth Factor Receptor (EGFR) Inhibitors Industry face during its growth?

  • The emergence of drug resistance mechanisms and the corresponding need for next-generation molecules present a key challenge affecting industry growth.

  • A persistent challenge is the evolution of drug resistance mechanisms, including mutations like kras g12c and complex exon 20 insertion mutations, which render existing treatments ineffective. This necessitates constant R&D investment in next-generation molecules and fourth-generation inhibitors.
  • Another significant hurdle is managing treatment-induced toxicities, such as dose-limiting toxicity, which can lead to poor patient adherence and therapy discontinuation in up to 25% of cases. The high cost of these small molecule therapies and immuno-oncology treatments, coupled with market access limitations and reimbursement challenges, creates economic pressure.
  • This is compounded by the need to manage side effects through supportive care, which adds complexity and cost to the patient journey, impacting overall treatment success.

Exclusive Technavio Analysis on Customer Landscape

The epidermal growth factor receptor (egfr) inhibitors market forecasting report includes the adoption lifecycle of the market, covering from the innovator’s stage to the laggard’s stage. It focuses on adoption rates in different regions based on penetration. Furthermore, the epidermal growth factor receptor (egfr) inhibitors market report also includes key purchase criteria and drivers of price sensitivity to help companies evaluate and develop their market growth analysis strategies.

Customer Landscape of Epidermal Growth Factor Receptor (EGFR) Inhibitors Industry

Competitive Landscape

Companies are implementing various strategies, such as strategic alliances, epidermal growth factor receptor (egfr) inhibitors market forecast, partnerships, mergers and acquisitions, geographical expansion, and product/service launches, to enhance their presence in the industry.

Amgen Inc. - Provides EGFR inhibitors via targeted oncology research, focusing on mutation-driven tumor signaling pathways to advance therapeutic innovation.

The industry research and growth report includes detailed analyses of the competitive landscape of the market and information about key companies, including:

  • Amgen Inc.
  • AstraZeneca Plc
  • Boehringer Ingelheim GmbH
  • Bristol Myers Squibb Co.
  • Checkpoint Therapeutics Inc.
  • Eli Lilly and Co.
  • F. Hoffmann La Roche Ltd.
  • Hansoh Pharmaceutical Group Co. Ltd.
  • Hutchison China Meditech Ltd.
  • Jiangsu Hengrui Pharmaceuticals Co. Ltd.
  • Johnson and Johnson Services
  • Lutris Pharma
  • Merus N.V.
  • Otsuka Holdings Co. Ltd.
  • Pfizer Inc.
  • Pierre Fabre SA
  • Puma Biotechnology Inc.
  • Takeda Pharmaceutical Ltd.

Qualitative and quantitative analysis of companies has been conducted to help clients understand the wider business environment as well as the strengths and weaknesses of key industry players. Data is qualitatively analyzed to categorize companies as pure play, category-focused, industry-focused, and diversified; it is quantitatively analyzed to categorize companies as dominant, leading, strong, tentative, and weak.

Recent Development and News in Epidermal growth factor receptor (egfr) inhibitors market

  • In August 2024, Johnson and Johnson Inc received regulatory approval for the combination of Rybrevant and lazertinib, offering a new first-line chemotherapy-free option for patients with common EGFR mutations.
  • In September 2024, Boehringer Ingelheim International GmbH reported positive clinical data for its investigational drug zongertinib, focusing on specific mutations that are often resistant to existing therapies.
  • In October 2024, Takeda Pharmaceutical Co. Ltd. shared new insights into its oncology pipeline, emphasizing the development of drugs that can overcome structural barriers of the EGFR receptor.
  • In August 2024, Bristol Myers Squibb Co highlighted the use of advanced bioinformatics to analyze clinical data and identify new biomarkers for colorectal cancer, aiming to design more effective combination regimens.

Dive into Technavio’s robust research methodology, blending expert interviews, extensive data synthesis, and validated models for unparalleled Epidermal Growth Factor Receptor (EGFR) Inhibitors Market insights. See full methodology.

Market Scope
Page number 299
Base year 2025
Historic period 2020-2024
Forecast period 2026-2030
Growth momentum & CAGR Accelerate at a CAGR of 10.7%
Market growth 2026-2030 USD 11937.9 million
Market structure Fragmented
YoY growth 2025-2026(%) 9.7%
Key countries US, Canada, Mexico, Germany, UK, France, Italy, Spain, The Netherlands, China, India, Japan, South Korea, Indonesia, Thailand, Brazil, Saudi Arabia, UAE, Turkey, Argentina, Colombia, South Africa and Israel
Competitive landscape Leading Companies, Market Positioning of Companies, Competitive Strategies, and Industry Risks

Request Free Sample

Research Analyst Overview

  • The epidermal growth factor receptor (EGFR) inhibitors market is sustained by a highly focused innovation cycle centered on mutation-specific targeting and overcoming acquired resistance. The development pipeline is rich with therapeutic agents, including tyrosine kinase inhibitors, monoclonal antibodies, and advanced antibody-drug conjugates, all aimed at disrupting tumor signaling pathways in indications like non-small cell lung cancer.
  • Central to this evolution is the integration of companion diagnostics, which has improved patient selection for clinical trials by over 30%. A pivotal trend influencing boardroom strategy is the shift toward subcutaneous delivery and oral formulations, which necessitates rethinking manufacturing investments and patient support infrastructure.
  • The market's trajectory is shaped by the pursuit of enhanced progression-free survival and better management of refractory cancers. This requires deep investment in pharmacovigilance infrastructure and the ability to penetrate challenging sites like the central nervous system, ensuring that therapies for metastatic disease and unresectable stage iii cancer deliver meaningful clinical outcomes through precise molecular profiling and biomarker screening.

What are the Key Data Covered in this Epidermal Growth Factor Receptor (EGFR) Inhibitors Market Research and Growth Report?

  • What is the expected growth of the Epidermal Growth Factor Receptor (EGFR) Inhibitors Market between 2026 and 2030?

    • USD 11.94 billion, at a CAGR of 10.7%

  • What segmentation does the market report cover?

    • The report is segmented by Indication (Lung cancer, Colorectal cancer, Breast cancer, and Others), Distribution Channel (Retail pharmacies, Hospital pharmacies, and Online pharmacies), Drug Class (Small molecule TKIs, and Monoclonal antibodies) and Geography (North America, Europe, Asia, Rest of World (ROW))

  • Which regions are analyzed in the report?

    • North America, Europe, Asia and Rest of World (ROW)

  • What are the key growth drivers and market challenges?

    • Advancements in combination therapies and regulatory approvals, Resistance mechanisms and need for next generation molecules

  • Who are the major players in the Epidermal Growth Factor Receptor (EGFR) Inhibitors Market?

    • Amgen Inc., AstraZeneca Plc, Boehringer Ingelheim GmbH, Bristol Myers Squibb Co., Checkpoint Therapeutics Inc., Eli Lilly and Co., F. Hoffmann La Roche Ltd., Hansoh Pharmaceutical Group Co. Ltd., Hutchison China Meditech Ltd., Jiangsu Hengrui Pharmaceuticals Co. Ltd., Johnson and Johnson Services, Lutris Pharma, Merus N.V., Otsuka Holdings Co. Ltd., Pfizer Inc., Pierre Fabre SA, Puma Biotechnology Inc. and Takeda Pharmaceutical Ltd.

Market Research Insights

  • The market dynamics are heavily influenced by the drive for enhanced clinical efficacy and patient convenience. The shift toward subcutaneous delivery for monoclonal antibodies, for instance, has been shown to reduce infusion-related reactions by over 50% compared to traditional intravenous methods, directly improving the patient experience.
  • Simultaneously, AI-driven digital health platforms are improving patient identification accuracy for targeted therapies by up to 25%, ensuring that therapeutic agents are matched with the correct genetic biomarkers. This focus on precision medicine is critical for managing metastatic disease and unresectable stage III cancers.
  • As the industry moves away from a one-size-fits-all approach, the emphasis on molecular profiling and overcoming resistance mechanisms continues to shape investment in next-generation inhibitors and supportive care strategies, driving differentiated value propositions.

We can help! Our analysts can customize this epidermal growth factor receptor (egfr) inhibitors market research report to meet your requirements.

Get in touch

1. Executive Summary

1.1 Market overview

Executive Summary - Chart on Market Overview
Executive Summary - Data Table on Market Overview
Executive Summary - Chart on Global Market Characteristics
Executive Summary - Chart on Market by Geography
Executive Summary - Chart on Market Segmentation by Indication
Executive Summary - Chart on Market Segmentation by Distribution Channel
Executive Summary - Chart on Market Segmentation by Drug Class
Executive Summary - Chart on Incremental Growth
Executive Summary - Data Table on Incremental Growth
Executive Summary - Chart on Company Market Positioning

2. Technavio Analysis

2.1 Analysis of price sensitivity, lifecycle, customer purchase basket, adoption rates, and purchase criteria

2.2 Criticality of inputs and Factors of differentiation

Chart on Overview on criticality of inputs and factors of differentiation

2.3 Factors of disruption

Chart on Overview on factors of disruption

2.4 Impact of drivers and challenges

Chart on Impact of drivers and challenges in 2025 and 2030

3. Market Landscape

3.1 Market ecosystem

Chart on Parent Market
Data Table on - Parent Market

3.2 Market characteristics

Chart on Market characteristics analysis

3.3 Value chain analysis

Chart on Value chain analysis

4. Market Sizing

4.1 Market definition

Data Table on Offerings of companies included in the market definition

4.2 Market segment analysis

Market segments

4.3 Market size 2025

4.4 Market outlook: Forecast for 2025-2030

Chart on Global - Market size and forecast 2025-2030 ($ million)
Data Table on Global - Market size and forecast 2025-2030 ($ million)
Chart on Global Market: Year-over-year growth 2025-2030 (%)
Data Table on Global Market: Year-over-year growth 2025-2030 (%)

5. Historic Market Size

5.1 Global Epidermal Growth Factor Receptor (EGFR) Inhibitors Market 2020 - 2024

Historic Market Size - Data Table on Global Epidermal Growth Factor Receptor (EGFR) Inhibitors Market 2020 - 2024 ($ million)

5.2 Indication segment analysis 2020 - 2024

Historic Market Size - Indication Segment 2020 - 2024 ($ million)

5.3 Distribution Channel segment analysis 2020 - 2024

Historic Market Size - Distribution Channel Segment 2020 - 2024 ($ million)

5.4 Drug Class segment analysis 2020 - 2024

Historic Market Size - Drug Class Segment 2020 - 2024 ($ million)

5.5 Geography segment analysis 2020 - 2024

Historic Market Size - Geography Segment 2020 - 2024 ($ million)

5.6 Country segment analysis 2020 - 2024

Historic Market Size - Country Segment 2020 - 2024 ($ million)

6. Qualitative Analysis

6.1 Impact of AI on Global Epidermal Growth Factor Receptor (EGFR) Inhibitors Market

7. Five Forces Analysis

7.1 Five forces summary

Five forces analysis - Comparison between 2025 and 2030

7.2 Bargaining power of buyers

Bargaining power of buyers - Impact of key factors 2025 and 2030

7.3 Bargaining power of suppliers

Bargaining power of suppliers - Impact of key factors in 2025 and 2030

7.4 Threat of new entrants

Threat of new entrants - Impact of key factors in 2025 and 2030

7.5 Threat of substitutes

Threat of substitutes - Impact of key factors in 2025 and 2030

7.6 Threat of rivalry

Threat of rivalry - Impact of key factors in 2025 and 2030

7.7 Market condition

Chart on Market condition - Five forces 2025 and 2030

8. Market Segmentation by Indication

8.1 Market segments

Chart on Indication - Market share 2025-2030 (%)
Data Table on Indication - Market share 2025-2030 (%)

8.2 Comparison by Indication

Chart on Comparison by Indication
Data Table on Comparison by Indication

8.3 Lung cancer - Market size and forecast 2025-2030

Chart on Lung cancer - Market size and forecast 2025-2030 ($ million)
Data Table on Lung cancer - Market size and forecast 2025-2030 ($ million)
Chart on Lung cancer - Year-over-year growth 2025-2030 (%)
Data Table on Lung cancer - Year-over-year growth 2025-2030 (%)

8.4 Colorectal cancer - Market size and forecast 2025-2030

Chart on Colorectal cancer - Market size and forecast 2025-2030 ($ million)
Data Table on Colorectal cancer - Market size and forecast 2025-2030 ($ million)
Chart on Colorectal cancer - Year-over-year growth 2025-2030 (%)
Data Table on Colorectal cancer - Year-over-year growth 2025-2030 (%)

8.5 Breast cancer - Market size and forecast 2025-2030

Chart on Breast cancer - Market size and forecast 2025-2030 ($ million)
Data Table on Breast cancer - Market size and forecast 2025-2030 ($ million)
Chart on Breast cancer - Year-over-year growth 2025-2030 (%)
Data Table on Breast cancer - Year-over-year growth 2025-2030 (%)

8.6 Others - Market size and forecast 2025-2030

Chart on Others - Market size and forecast 2025-2030 ($ million)
Data Table on Others - Market size and forecast 2025-2030 ($ million)
Chart on Others - Year-over-year growth 2025-2030 (%)
Data Table on Others - Year-over-year growth 2025-2030 (%)

8.7 Market opportunity by Indication

Market opportunity by Indication ($ million)
Data Table on Market opportunity by Indication ($ million)

9. Market Segmentation by Distribution Channel

9.1 Market segments

Chart on Distribution Channel - Market share 2025-2030 (%)
Data Table on Distribution Channel - Market share 2025-2030 (%)

9.2 Comparison by Distribution Channel

Chart on Comparison by Distribution Channel
Data Table on Comparison by Distribution Channel

9.3 Retail pharmacies - Market size and forecast 2025-2030

Chart on Retail pharmacies - Market size and forecast 2025-2030 ($ million)
Data Table on Retail pharmacies - Market size and forecast 2025-2030 ($ million)
Chart on Retail pharmacies - Year-over-year growth 2025-2030 (%)
Data Table on Retail pharmacies - Year-over-year growth 2025-2030 (%)

9.4 Hospital pharmacies - Market size and forecast 2025-2030

Chart on Hospital pharmacies - Market size and forecast 2025-2030 ($ million)
Data Table on Hospital pharmacies - Market size and forecast 2025-2030 ($ million)
Chart on Hospital pharmacies - Year-over-year growth 2025-2030 (%)
Data Table on Hospital pharmacies - Year-over-year growth 2025-2030 (%)

9.5 Online pharmacies - Market size and forecast 2025-2030

Chart on Online pharmacies - Market size and forecast 2025-2030 ($ million)
Data Table on Online pharmacies - Market size and forecast 2025-2030 ($ million)
Chart on Online pharmacies - Year-over-year growth 2025-2030 (%)
Data Table on Online pharmacies - Year-over-year growth 2025-2030 (%)

9.6 Market opportunity by Distribution Channel

Market opportunity by Distribution Channel ($ million)
Data Table on Market opportunity by Distribution Channel ($ million)

10. Market Segmentation by Drug Class

10.1 Market segments

Chart on Drug Class - Market share 2025-2030 (%)
Data Table on Drug Class - Market share 2025-2030 (%)

10.2 Comparison by Drug Class

Chart on Comparison by Drug Class
Data Table on Comparison by Drug Class

10.3 Small molecule TKIs - Market size and forecast 2025-2030

Chart on Small molecule TKIs - Market size and forecast 2025-2030 ($ million)
Data Table on Small molecule TKIs - Market size and forecast 2025-2030 ($ million)
Chart on Small molecule TKIs - Year-over-year growth 2025-2030 (%)
Data Table on Small molecule TKIs - Year-over-year growth 2025-2030 (%)

10.4 Monoclonal antibodies - Market size and forecast 2025-2030

Chart on Monoclonal antibodies - Market size and forecast 2025-2030 ($ million)
Data Table on Monoclonal antibodies - Market size and forecast 2025-2030 ($ million)
Chart on Monoclonal antibodies - Year-over-year growth 2025-2030 (%)
Data Table on Monoclonal antibodies - Year-over-year growth 2025-2030 (%)

10.5 Market opportunity by Drug Class

Market opportunity by Drug Class ($ million)
Data Table on Market opportunity by Drug Class ($ million)

11. Customer Landscape

11.1 Customer landscape overview

Analysis of price sensitivity, lifecycle, customer purchase basket, adoption rates, and purchase criteria

12. Geographic Landscape

12.1 Geographic segmentation

Chart on Market share by geography 2025-2030 (%)
Data Table on Market share by geography 2025-2030 (%)

12.2 Geographic comparison

Chart on Geographic comparison
Data Table on Geographic comparison

12.3 North America - Market size and forecast 2025-2030

Chart on North America - Market size and forecast 2025-2030 ($ million)
Data Table on North America - Market size and forecast 2025-2030 ($ million)
Chart on North America - Year-over-year growth 2025-2030 (%)
Data Table on North America - Year-over-year growth 2025-2030 (%)
Chart on Regional Comparison - North America
Data Table on Regional Comparison - North America

12.3.1 US - Market size and forecast 2025-2030

Chart on US - Market size and forecast 2025-2030 ($ million)
Data Table on US - Market size and forecast 2025-2030 ($ million)
Chart on US - Year-over-year growth 2025-2030 (%)
Data Table on US - Year-over-year growth 2025-2030 (%)

12.3.2 Canada - Market size and forecast 2025-2030

Chart on Canada - Market size and forecast 2025-2030 ($ million)
Data Table on Canada - Market size and forecast 2025-2030 ($ million)
Chart on Canada - Year-over-year growth 2025-2030 (%)
Data Table on Canada - Year-over-year growth 2025-2030 (%)

12.3.3 Mexico - Market size and forecast 2025-2030

Chart on Mexico - Market size and forecast 2025-2030 ($ million)
Data Table on Mexico - Market size and forecast 2025-2030 ($ million)
Chart on Mexico - Year-over-year growth 2025-2030 (%)
Data Table on Mexico - Year-over-year growth 2025-2030 (%)

12.4 Europe - Market size and forecast 2025-2030

Chart on Europe - Market size and forecast 2025-2030 ($ million)
Data Table on Europe - Market size and forecast 2025-2030 ($ million)
Chart on Europe - Year-over-year growth 2025-2030 (%)
Data Table on Europe - Year-over-year growth 2025-2030 (%)
Chart on Regional Comparison - Europe
Data Table on Regional Comparison - Europe

12.4.1 Germany - Market size and forecast 2025-2030

Chart on Germany - Market size and forecast 2025-2030 ($ million)
Data Table on Germany - Market size and forecast 2025-2030 ($ million)
Chart on Germany - Year-over-year growth 2025-2030 (%)
Data Table on Germany - Year-over-year growth 2025-2030 (%)

12.4.2 UK - Market size and forecast 2025-2030

Chart on UK - Market size and forecast 2025-2030 ($ million)
Data Table on UK - Market size and forecast 2025-2030 ($ million)
Chart on UK - Year-over-year growth 2025-2030 (%)
Data Table on UK - Year-over-year growth 2025-2030 (%)

12.4.3 France - Market size and forecast 2025-2030

Chart on France - Market size and forecast 2025-2030 ($ million)
Data Table on France - Market size and forecast 2025-2030 ($ million)
Chart on France - Year-over-year growth 2025-2030 (%)
Data Table on France - Year-over-year growth 2025-2030 (%)

12.4.4 Italy - Market size and forecast 2025-2030

Chart on Italy - Market size and forecast 2025-2030 ($ million)
Data Table on Italy - Market size and forecast 2025-2030 ($ million)
Chart on Italy - Year-over-year growth 2025-2030 (%)
Data Table on Italy - Year-over-year growth 2025-2030 (%)

12.4.5 Spain - Market size and forecast 2025-2030

Chart on Spain - Market size and forecast 2025-2030 ($ million)
Data Table on Spain - Market size and forecast 2025-2030 ($ million)
Chart on Spain - Year-over-year growth 2025-2030 (%)
Data Table on Spain - Year-over-year growth 2025-2030 (%)

12.4.6 The Netherlands - Market size and forecast 2025-2030

Chart on The Netherlands - Market size and forecast 2025-2030 ($ million)
Data Table on The Netherlands - Market size and forecast 2025-2030 ($ million)
Chart on The Netherlands - Year-over-year growth 2025-2030 (%)
Data Table on The Netherlands - Year-over-year growth 2025-2030 (%)

12.5 Asia - Market size and forecast 2025-2030

Chart on Asia - Market size and forecast 2025-2030 ($ million)
Data Table on Asia - Market size and forecast 2025-2030 ($ million)
Chart on Asia - Year-over-year growth 2025-2030 (%)
Data Table on Asia - Year-over-year growth 2025-2030 (%)
Chart on Regional Comparison - Asia
Data Table on Regional Comparison - Asia

12.5.1 China - Market size and forecast 2025-2030

Chart on China - Market size and forecast 2025-2030 ($ million)
Data Table on China - Market size and forecast 2025-2030 ($ million)
Chart on China - Year-over-year growth 2025-2030 (%)
Data Table on China - Year-over-year growth 2025-2030 (%)

12.5.2 India - Market size and forecast 2025-2030

Chart on India - Market size and forecast 2025-2030 ($ million)
Data Table on India - Market size and forecast 2025-2030 ($ million)
Chart on India - Year-over-year growth 2025-2030 (%)
Data Table on India - Year-over-year growth 2025-2030 (%)

12.5.3 Japan - Market size and forecast 2025-2030

Chart on Japan - Market size and forecast 2025-2030 ($ million)
Data Table on Japan - Market size and forecast 2025-2030 ($ million)
Chart on Japan - Year-over-year growth 2025-2030 (%)
Data Table on Japan - Year-over-year growth 2025-2030 (%)

12.5.4 South Korea - Market size and forecast 2025-2030

Chart on South Korea - Market size and forecast 2025-2030 ($ million)
Data Table on South Korea - Market size and forecast 2025-2030 ($ million)
Chart on South Korea - Year-over-year growth 2025-2030 (%)
Data Table on South Korea - Year-over-year growth 2025-2030 (%)

12.5.5 Indonesia - Market size and forecast 2025-2030

Chart on Indonesia - Market size and forecast 2025-2030 ($ million)
Data Table on Indonesia - Market size and forecast 2025-2030 ($ million)
Chart on Indonesia - Year-over-year growth 2025-2030 (%)
Data Table on Indonesia - Year-over-year growth 2025-2030 (%)

12.5.6 Thailand - Market size and forecast 2025-2030

Chart on Thailand - Market size and forecast 2025-2030 ($ million)
Data Table on Thailand - Market size and forecast 2025-2030 ($ million)
Chart on Thailand - Year-over-year growth 2025-2030 (%)
Data Table on Thailand - Year-over-year growth 2025-2030 (%)

12.6 Rest of World (ROW) - Market size and forecast 2025-2030

Chart on Rest of World (ROW) - Market size and forecast 2025-2030 ($ million)
Data Table on Rest of World (ROW) - Market size and forecast 2025-2030 ($ million)
Chart on Rest of World (ROW) - Year-over-year growth 2025-2030 (%)
Data Table on Rest of World (ROW) - Year-over-year growth 2025-2030 (%)
Chart on Regional Comparison - Rest of World (ROW)
Data Table on Regional Comparison - Rest of World (ROW)

12.6.1 Brazil - Market size and forecast 2025-2030

Chart on Brazil - Market size and forecast 2025-2030 ($ million)
Data Table on Brazil - Market size and forecast 2025-2030 ($ million)
Chart on Brazil - Year-over-year growth 2025-2030 (%)
Data Table on Brazil - Year-over-year growth 2025-2030 (%)

12.6.2 Saudi Arabia - Market size and forecast 2025-2030

Chart on Saudi Arabia - Market size and forecast 2025-2030 ($ million)
Data Table on Saudi Arabia - Market size and forecast 2025-2030 ($ million)
Chart on Saudi Arabia - Year-over-year growth 2025-2030 (%)
Data Table on Saudi Arabia - Year-over-year growth 2025-2030 (%)

12.6.3 UAE - Market size and forecast 2025-2030

Chart on UAE - Market size and forecast 2025-2030 ($ million)
Data Table on UAE - Market size and forecast 2025-2030 ($ million)
Chart on UAE - Year-over-year growth 2025-2030 (%)
Data Table on UAE - Year-over-year growth 2025-2030 (%)

12.6.4 Turkey - Market size and forecast 2025-2030

Chart on Turkey - Market size and forecast 2025-2030 ($ million)
Data Table on Turkey - Market size and forecast 2025-2030 ($ million)
Chart on Turkey - Year-over-year growth 2025-2030 (%)
Data Table on Turkey - Year-over-year growth 2025-2030 (%)

12.6.5 Argentina - Market size and forecast 2025-2030

Chart on Argentina - Market size and forecast 2025-2030 ($ million)
Data Table on Argentina - Market size and forecast 2025-2030 ($ million)
Chart on Argentina - Year-over-year growth 2025-2030 (%)
Data Table on Argentina - Year-over-year growth 2025-2030 (%)

12.6.6 Colombia - Market size and forecast 2025-2030

Chart on Colombia - Market size and forecast 2025-2030 ($ million)
Data Table on Colombia - Market size and forecast 2025-2030 ($ million)
Chart on Colombia - Year-over-year growth 2025-2030 (%)
Data Table on Colombia - Year-over-year growth 2025-2030 (%)

12.6.7 South Africa - Market size and forecast 2025-2030

Chart on South Africa - Market size and forecast 2025-2030 ($ million)
Data Table on South Africa - Market size and forecast 2025-2030 ($ million)
Chart on South Africa - Year-over-year growth 2025-2030 (%)
Data Table on South Africa - Year-over-year growth 2025-2030 (%)

12.6.8 Israel - Market size and forecast 2025-2030

Chart on Israel - Market size and forecast 2025-2030 ($ million)
Data Table on Israel - Market size and forecast 2025-2030 ($ million)
Chart on Israel - Year-over-year growth 2025-2030 (%)
Data Table on Israel - Year-over-year growth 2025-2030 (%)

12.7 Market opportunity by geography

Market opportunity by geography ($ million)
Data Tables on Market opportunity by geography ($ million)

13. Drivers, Challenges, and Opportunity

13.1 Market drivers

Advancements in combination therapies and regulatory approvals
Expansion of precision medicine and diagnostic integration
Strategic research and clinical success in addressing resistance

13.2 Market challenges

Resistance mechanisms and need for next generation molecules
High costs of therapy and market access limitations
Management of treatment induced toxicities and patient compliance

13.3 Impact of drivers and challenges

Impact of drivers and challenges in 2025 and 2030

13.4 Market opportunities

Advancements in next generation TKIs for complex mutations
Shift toward subcutaneous delivery and enhanced patient convenience
Integration of AI and advanced biomarker screening

14. Competitive Landscape

14.1 Overview

14.2

Overview on criticality of inputs and factors of differentiation

14.3 Landscape disruption

Overview on factors of disruption

14.4 Industry risks

Impact of key risks on business

15. Competitive Analysis

15.1 Companies profiled

Companies covered

15.2 Company ranking index

15.3 Market positioning of companies

Matrix on companies position and classification

15.4 Amgen Inc.

Amgen Inc. - Overview
Amgen Inc. - Product / Service
Amgen Inc. - Key news
Amgen Inc. - Key offerings
SWOT

15.5 AstraZeneca Plc

AstraZeneca Plc - Overview
AstraZeneca Plc - Product / Service
AstraZeneca Plc - Key news
AstraZeneca Plc - Key offerings
SWOT

15.6 Boehringer Ingelheim GmbH

Boehringer Ingelheim GmbH - Overview
Boehringer Ingelheim GmbH - Product / Service
Boehringer Ingelheim GmbH - Key news
Boehringer Ingelheim GmbH - Key offerings
SWOT

15.7 Bristol Myers Squibb Co.

Bristol Myers Squibb Co. - Overview
Bristol Myers Squibb Co. - Product / Service
Bristol Myers Squibb Co. - Key news
Bristol Myers Squibb Co. - Key offerings
SWOT

15.8 Checkpoint Therapeutics Inc.

Checkpoint Therapeutics Inc. - Overview
Checkpoint Therapeutics Inc. - Product / Service
Checkpoint Therapeutics Inc. - Key offerings
SWOT

15.9 Eli Lilly and Co.

Eli Lilly and Co. - Overview
Eli Lilly and Co. - Product / Service
Eli Lilly and Co. - Key offerings
SWOT

15.10 F. Hoffmann La Roche Ltd.

F. Hoffmann La Roche Ltd. - Overview
F. Hoffmann La Roche Ltd. - Business segments
F. Hoffmann La Roche Ltd. - Key news
F. Hoffmann La Roche Ltd. - Key offerings
F. Hoffmann La Roche Ltd. - Segment focus
SWOT

15.11 Hutchison China Meditech Ltd.

Hutchison China Meditech Ltd. - Overview
Hutchison China Meditech Ltd. - Business segments
Hutchison China Meditech Ltd. - Key offerings
Hutchison China Meditech Ltd. - Segment focus
SWOT

15.12 Lutris Pharma

Lutris Pharma - Overview
Lutris Pharma - Product / Service
Lutris Pharma - Key offerings
SWOT

15.13 Merus N.V.

Merus N.V. - Overview
Merus N.V. - Product / Service
Merus N.V. - Key offerings
SWOT

15.14 Otsuka Holdings Co. Ltd.

Otsuka Holdings Co. Ltd. - Overview
Otsuka Holdings Co. Ltd. - Business segments
Otsuka Holdings Co. Ltd. - Key news
Otsuka Holdings Co. Ltd. - Key offerings
Otsuka Holdings Co. Ltd. - Segment focus
SWOT

15.15 Pfizer Inc.

Pfizer Inc. - Overview
Pfizer Inc. - Business segments
Pfizer Inc. - Key news
Pfizer Inc. - Key offerings
Pfizer Inc. - Segment focus
SWOT

15.16 Pierre Fabre SA

Pierre Fabre SA - Overview
Pierre Fabre SA - Product / Service
Pierre Fabre SA - Key offerings
SWOT

15.17 Puma Biotechnology Inc.

Puma Biotechnology Inc. - Overview
Puma Biotechnology Inc. - Product / Service
Puma Biotechnology Inc. - Key offerings
SWOT

15.18 Takeda Pharmaceutical Ltd.

Takeda Pharmaceutical Ltd. - Overview
Takeda Pharmaceutical Ltd. - Business segments
Takeda Pharmaceutical Ltd. - Key news
Takeda Pharmaceutical Ltd. - Key offerings
Takeda Pharmaceutical Ltd. - Segment focus
SWOT

16. Appendix

16.1 Scope of the report

Market definition
Objectives
Notes and caveats

16.2 Inclusions and exclusions checklist

Inclusions checklist
Exclusions checklist

16.3 Currency conversion rates for US$

16.4 Research methodology

16.5 Data procurement

Information sources

16.6 Data validation

16.7 Validation techniques employed for market sizing

16.8 Data synthesis

16.9 360 degree market analysis

16.10 List of abbreviations

Research Methodology

Technavio presents a detailed picture of the market by way of study, synthesis, and summation of data from multiple sources. The analysts have presented the various facets of the market with a particular focus on identifying the key industry influencers. The data thus presented is comprehensive, reliable, and the result of extensive research, both primary and secondary.

INFORMATION SOURCES

Primary sources

  • Manufacturers and suppliers
  • Channel partners
  • Industry experts
  • Strategic decision makers

Secondary sources

  • Industry journals and periodicals
  • Government data
  • Financial reports of key industry players
  • Historical data
  • Press releases

DATA ANALYSIS

Data Synthesis

  • Collation of data
  • Estimation of key figures
  • Analysis of derived insights

Data Validation

  • Triangulation with data models
  • Reference against proprietary databases
  • Corroboration with industry experts

REPORT WRITING

Qualitative

  • Market drivers
  • Market challenges
  • Market trends
  • Five forces analysis

Quantitative

  • Market size and forecast
  • Market segmentation
  • Geographical insights
  • Competitive landscape

Interested in this report?

Get your sample now to see our research methodology and insights!

Download Now

Frequently Asked Questions

Epidermal Growth Factor Receptor (EGFR) Inhibitors market growth will increase by USD 11937.9 million during 2026-2030.

The Epidermal Growth Factor Receptor (EGFR) Inhibitors market is expected to grow at a CAGR of 10.7% during 2026-2030.

Epidermal Growth Factor Receptor (EGFR) Inhibitors market is segmented by Indication (Lung cancer, Colorectal cancer, Breast cancer, Others) Distribution channel (Retail pharmacies, Hospital pharmacies, Online pharmacies) Drug class (Small molecule TKIs, Monoclonal antibodies)

Amgen Inc., AstraZeneca Plc, Boehringer Ingelheim GmbH, Bristol Myers Squibb Co., Checkpoint Therapeutics Inc., Eli Lilly and Co., F. Hoffmann La Roche Ltd., Hansoh Pharmaceutical Group Co. Ltd., Hutchison China Meditech Ltd., Jiangsu Hengrui Pharmaceuticals Co. Ltd., Johnson and Johnson Services, Lutris Pharma, Merus N.V., Otsuka Holdings Co. Ltd., Pfizer Inc., Pierre Fabre SA, Puma Biotechnology Inc., Takeda Pharmaceutical Ltd. are a few of the key vendors in the Epidermal Growth Factor Receptor (EGFR) Inhibitors market.

North America will register the highest growth rate of 37.8% among the other regions. Therefore, the Epidermal Growth Factor Receptor (EGFR) Inhibitors market in North America is expected to garner significant business opportunities for the vendors during the forecast period.

US, Canada, Mexico, Germany, UK, France, Italy, Spain, The Netherlands, China, India, Japan, South Korea, Indonesia, Thailand, Brazil, Saudi Arabia, UAE, Turkey, Argentina, Colombia, South Africa, Israel

  • Advancements in combination therapies and regulatory approvals is the driving factor this market.

The Epidermal Growth Factor Receptor (EGFR) Inhibitors market vendors should focus on grabbing business opportunities from the Indication segment as it accounted for the largest market share in the base year.
RIA - Research AI Assistant
Ask RIA