Enterprise Flash Storage Market Analysis, Size, and Forecast 2025-2029: APAC (Australia, China, India, Japan, South Korea), North America (US and Canada), Europe (France, Germany, UK), South America , and Middle East and Africa

Enterprise Flash Storage Market Analysis, Size, and Forecast 2025-2029:
APAC (Australia, China, India, Japan, South Korea), North America (US and Canada), Europe (France, Germany, UK), South America , and Middle East and Africa

Published: Mar 2025 228 Pages SKU: IRTNTR75786

Market Overview at a Glance

$27.70 B
Market Opportunity
27.5%
CAGR
17.3
YoY growth 2024-2025(%)

Enterprise Flash Storage Market Size 2025-2029

The enterprise flash storage market size is forecast to increase by USD 27.7 billion, at a CAGR of 27.5% between 2024 and 2029.

  • The market is experiencing significant growth due to the increasing demand for high-performance storage solutions. Businesses are recognizing the need for faster data access and processing capabilities to remain competitive in today's digital landscape. One technology driving this trend is Non-Volatile Memory Express (NVMe), which offers improved speed and efficiency compared to traditional storage systems. However, the high initial investment costs associated with flash storage systems pose a challenge for some organizations. Despite this, the potential benefits of faster data processing and improved application performance make flash storage an attractive option for those able to invest. Companies seeking to capitalize on these opportunities must carefully evaluate their budgets and strategic priorities to determine if the investment in enterprise flash storage is worthwhile.
  • Meanwhile, those facing financial constraints may need to explore alternative storage solutions or focus on optimizing their existing infrastructure to maximize performance. Overall, the market presents both opportunities and challenges, requiring strategic planning and careful consideration from organizations.

What will be the Size of the Enterprise Flash Storage Market during the forecast period?

Enterprise Flash Storage Market Size

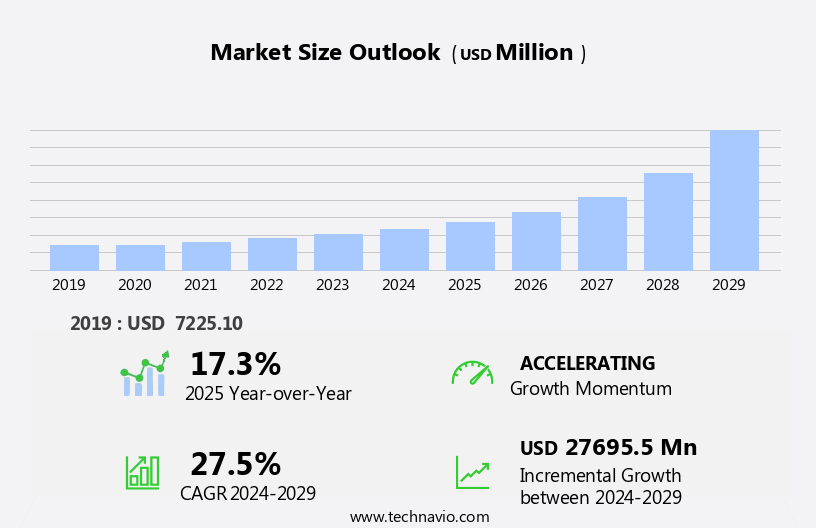
Explore in-depth regional segment analysis with market size data - historical 2019-2023 and forecasts 2025-2029 - in the full report.  
Request Free Sample

The market continues to evolve, driven by advancements in technology and shifting business requirements. Thin provisioning, a dynamic storage allocation strategy, is increasingly adopted to optimize data center infrastructure. This approach allows organizations to allocate storage space as needed, improving efficiency and reducing power consumption. Data-intensive applications, such as server virtualization, virtual desktops, big data analytics, and machine learning, fuel the demand for high-performance storage solutions. Storage performance monitoring is crucial to ensure optimal service levels and prevent bottlenecks. Cloud storage and hybrid cloud models are transforming the storage landscape, offering scalability, flexibility, and cost savings. Data migration, snapshot management, and backup and recovery are essential components of any comprehensive storage strategy.

Data security and compliance regulations remain top priorities, necessitating robust security protocols, data encryption, and disaster recovery solutions. Capacity planning and tiered storage strategies help organizations manage their storage resources effectively. Edge computing and 3D NAND technologies are emerging trends, offering improved performance and reduced latency. Fibre Channel and Hyperconverged Infrastructure (HCI) are gaining popularity due to their ease of deployment and management. Storage management software, all-flash arrays, software-defined storage (SDS), and hybrid flash arrays are key solutions that cater to various business needs. Fault tolerance and high availability are critical features that ensure business continuity. The market is a dynamic and evolving landscape, with ongoing innovations and shifting market patterns.

Organizations must stay informed and adapt to these changes to optimize their storage infrastructure and meet their business objectives.

How is this Enterprise Flash Storage Industry segmented?

The enterprise flash storage industry research report provides comprehensive data (region-wise segment analysis), with forecasts and estimates in "USD million" for the period 2025-2029, as well as historical data from 2019-2023 for the following segments.

  • Application
    • Telecom and IT
    • Banking
    • Financial services
    • Others
  • Type
    • Single-level cell (SLC)
    • Multi-level cell (MLC)
    • Triple-level cell flash (TLC)
    • Serial NAND
  • Product Type
    • Hybrid flash array
    • All-flash array
  • Capacity
    • Less than 1TB
    • 1TB to 5TB
    • 5TB to 10TB
    • Above 10TB
  • Geography
    • North America
      • US
      • Canada
    • Europe
      • France
      • Germany
      • UK
    • APAC
      • Australia
      • China
      • India
      • Japan
      • South Korea
    • Rest of World (ROW)

    By Application Insights

    The telecom and it segment is estimated to witness significant growth during the forecast period.

    The market is experiencing significant growth in the telecom and IT sectors due to the increasing demand for high-performance storage solutions that can handle large-scale data generation and processing. Enterprise flash storage offers numerous advantages, such as speed, reliability, and scalability, making it an ideal choice for these industries. With the adoption of technologies like cloud computing, big data analytics, and virtualization, the need for enterprise flash storage is anticipated to continue growing. Network-attached storage (NAS) and direct-attached storage (DAS) are popular enterprise flash storage solutions. NAS provides centralized storage access over a network, enabling easy data sharing and management.

    DAS, on the other hand, offers direct access to storage devices connected to the server, providing faster access to data. Data compression, deduplication, and tiered storage help optimize storage capacity and reduce power consumption. Machine learning (ML) and artificial intelligence (AI) are being integrated into enterprise flash storage systems for performance optimization and data management. High availability, fault tolerance, and snapshot management ensure data integrity and disaster recovery. Virtualization technologies, such as server, storage, and virtual desktop infrastructure, are also driving the adoption of enterprise flash storage. Hybrid flash arrays and all-flash arrays offer flexible storage solutions for various workloads.

    Compliance regulations require robust data encryption and security protocols, which are essential features of enterprise flash storage systems. Capacity planning and edge computing are emerging trends in the market. Fibre channel and hyperconverged infrastructure (HCI) are popular technologies used for enterprise flash storage deployment. Storage management software, including backup and recovery, data lifecycle management, and performance optimization tools, are essential for effective enterprise flash storage implementation. In conclusion, the market is witnessing extensive adoption in the telecom and IT sectors due to the increasing demand for high-performance storage solutions. The market is expected to continue growing as more technologies, including cloud computing, big data analytics, and virtualization, are adopted.

    Enterprise flash storage offers numerous benefits, including speed, reliability, and scalability, making it an ideal choice for these industries.

    Enterprise Flash Storage Market Size

    Request Free Sample

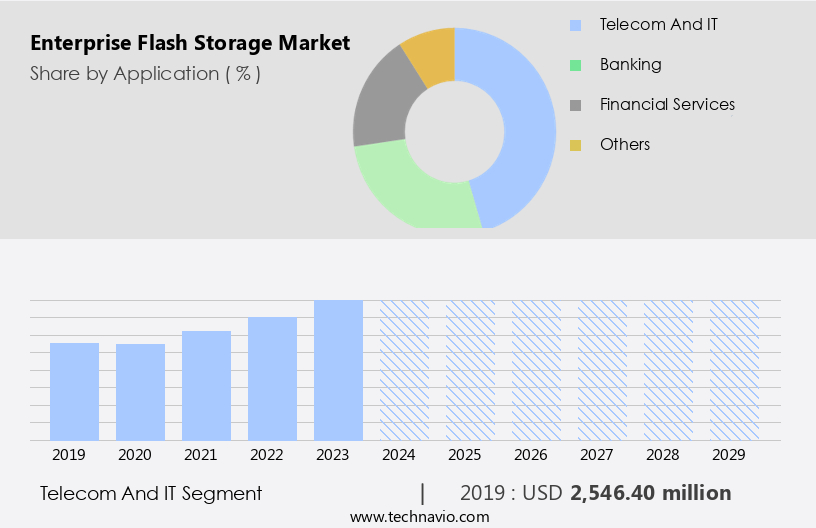
    The Telecom and IT segment was valued at USD 2.55 billion in 2019 and showed a gradual increase during the forecast period.

    Regional Analysis

    APAC is estimated to contribute 72% to the growth of the global market during the forecast period.Technavio’s analysts have elaborately explained the regional trends and drivers that shape the market during the forecast period.

    Enterprise Flash Storage Market Share by Geography

     Request Free Sample

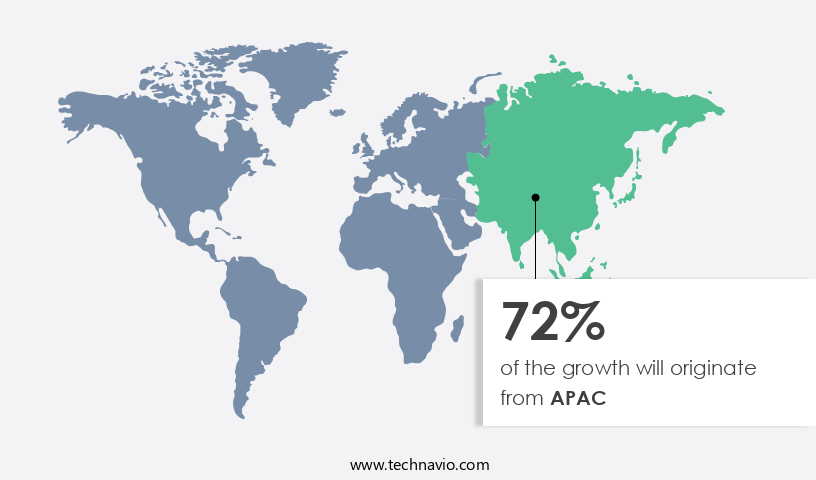
    The market in APAC is experiencing substantial growth and revolutionizing traditional storage concepts. Factors such as the increasing adoption of cloud computing, Big Data analytics, and high-performance storage demands in industries like finance, healthcare, and manufacturing are driving this expansion. With digital transformation advancing rapidly in APAC countries, including China, Japan, and South Korea, the need for storage and data generation is escalating. Major market players in the enterprise flash storage sector, including Dell, IBM, and HP, are headquartered in this region, fostering competition and innovation. Network-attached storage (NAS) and direct-attached storage (DAS) are being replaced by more efficient solutions like all-flash arrays, software-defined storage (SDS), and hybrid flash arrays.

    Data compression, deduplication, and tiered storage are essential techniques for managing data effectively and optimizing storage capacity. Machine learning (ML) and artificial intelligence (AI) are being integrated into storage systems for performance optimization and predictive analytics. Power consumption is a significant concern in data centers, leading to the adoption of power-efficient technologies like 3D Nand and fibre channel. Data integrity, security, and compliance regulations are crucial considerations for businesses, necessitating data encryption, disaster recovery, and backup and recovery solutions. Capacity planning, performance optimization, and fault tolerance are essential for ensuring high availability and minimizing downtime. Virtualization technologies like server, virtual machines (VMs), and virtual san are increasingly being used for storage consolidation and data migration.

    Edge computing and capacity planning are gaining traction as businesses seek to reduce latency and improve data accessibility. Remote replication and snapshot management are essential for data protection and disaster recovery. Cloud storage and disaster recovery as a service are becoming more popular, offering businesses flexibility and cost savings. Security protocols and data encryption are crucial for protecting sensitive data in the cloud. The market is a dynamic and evolving landscape, with continuous innovation and advancements in technology shaping its future.

    Market Dynamics

    Our researchers analyzed the data with 2024 as the base year, along with the key drivers, trends, and challenges. A holistic analysis of drivers will help companies refine their marketing strategies to gain a competitive advantage.

    In the dynamic and evolving landscape of data storage, the market continues to gain momentum as businesses seek faster, more efficient, and reliable solutions for their mission-critical applications. This market is characterized by high-performance, solid-state drives (SSDs) designed specifically for enterprise-level use. These SSDs deliver superior read and write speeds, ensuring swift data access and reduced latency. The market caters to organizations requiring large-scale storage solutions, offering advanced features such as data protection, data reduction, and multi-protocol support. Additionally, it integrates seamlessly with virtualized environments, cloud computing, and big data analytics. With the increasing demand for real-time data processing and business agility, the market is poised to revolutionize the way organizations manage and utilize their data. It encompasses various applications, including database, virtual desktop infrastructure (VDI), and server environments, providing unparalleled performance and flexibility. Furthermore, it offers various form factors, including all-flash arrays, hybrid arrays, and flash-enabled systems, catering to diverse storage requirements. The market is a game-changer, enabling organizations to optimize their IT infrastructure, enhance productivity, and gain a competitive edge.

    What are the key market drivers leading to the rise in the adoption of Enterprise Flash Storage Industry?

    • The market is propelled forward by the escalating demand for advanced storage solutions, which prioritizes high performance. 

    • The market is experiencing significant growth due to the increasing demand for high-performance storage systems capable of handling big data and analytics applications. Flash storage outperforms traditional storage systems in terms of speed and efficiency, enabling swift data access, retrieval, and analysis. With the capacity to manage multiple workloads concurrently and provide stable performance, flash storage enhances the efficiency of big data processing. This technology is essential for businesses seeking to extract valuable insights from their data quickly and effectively. Furthermore, edge computing and capacity planning are driving the adoption of enterprise flash storage, as they require low latency and high IOPS for real-time data processing.
    • Additionally, the implementation of storage virtualization, tiered storage, and virtual machines (VMs) further enhances the capabilities of enterprise flash storage systems. The use of 3D NAND technology ensures data integrity and reliability, making it an ideal choice for businesses seeking to maintain the security and consistency of their data. Remote replication is another feature that adds value to enterprise flash storage, enabling businesses to replicate data across multiple sites for disaster recovery and business continuity purposes.

    What are the market trends shaping the Enterprise Flash Storage Industry?

    • The adoption of Non-Volatile Memory Express (NVMe) technology is an emerging market trend. This advanced technology offers significant improvements in data transfer rates and response times compared to traditional storage systems.

    • The market is experiencing significant growth due to the adoption of NVMe (Non-Volatile Memory Express) technology. NVMe technology enables faster data transfer rates and lower latency, allowing flash storage to reach its full potential. This technology establishes a direct connection between the storage device and the central processing unit (CPU) of the server, utilizing the fast PCIe interface, as opposed to conventional storage protocols like SATA and SAS. The elimination of bottlenecks and introduction of parallel processing significantly enhances the performance of flash storage solutions and decreases data access latency. Cloud computing is also driving the market's growth, as businesses increasingly move their data to the cloud for improved scalability, flexibility, and cost savings.
    • Security protocols, data encryption, disaster recovery, and data protection are essential considerations for enterprise storage solutions, and companies are focusing on providing robust solutions to meet these demands. Storage management software, such as all-flash arrays, software-defined storage (SDS), hybrid flash arrays, and fault tolerance solutions, are essential for managing and optimizing enterprise flash storage systems. These solutions offer features like thin provisioning, snapshotting, and replication, enabling businesses to efficiently manage their storage resources and ensure data availability and protection.

    What challenges does the Enterprise Flash Storage Industry face during its growth?

    • The high initial investment costs linked to the implementation of flash storage systems represent a significant challenge that can hinder the growth of the industry. 

    • The market faces a significant challenge due to the high initial investment costs. Flash storage systems offer superior performance and efficiency compared to traditional storage solutions, making them an attractive choice for businesses. However, the expense of establishing a flash storage infrastructure, which includes purchasing hardware, software, and accessories, can be prohibitive for some organizations. Consequently, some businesses may forego flash storage or limit their capacity expansion plans.
    • The enterprise decision-making process is complicated by budgetary constraints and the need to demonstrate a return on investment (ROI). These factors could potentially hinder the growth of the market during the forecast period.

    Exclusive Customer Landscape

    The enterprise flash storage market forecasting report includes the adoption lifecycle of the market, covering from the innovator’s stage to the laggard’s stage. It focuses on adoption rates in different regions based on penetration. Furthermore, the enterprise flash storage market report also includes key purchase criteria and drivers of price sensitivity to help companies evaluate and develop their market growth analysis strategies.

    Enterprise Flash Storage Market Share by Geography

     Customer Landscape

    Key Companies & Market Insights

    Companies are implementing various strategies, such as strategic alliances, enterprise flash storage market forecast, partnerships, mergers and acquisitions, geographical expansion, and product/service launches, to enhance their presence in the industry.

    Broadcom Inc. - Enterprise flash storage solutions necessitate advanced IT infrastructure, spanning data centers and desktops, to uncover customer insights, process billing systems, and facilitate employee communication. These systems enable businesses to optimize operations and enhance productivity. Flash storage technology delivers faster data access and improved performance, essential for today's data-driven organizations.

    The industry research and growth report includes detailed analyses of the competitive landscape of the market and information about key companies, including:

    • Broadcom Inc.
    • Cisco Systems Inc.
    • Datrox Computer Technologies Inc.
    • Dell Technologies Inc.
    • Hewlett Packard Enterprise Co.
    • Hitachi Ltd.
    • Huawei Technologies Co. Ltd.
    • Infortrend Technology Inc.
    • Intel Corp.
    • International Business Machines Corp.
    • Kioxia Corp.
    • Lenovo Group Ltd.
    • NetApp Inc.
    • Nimbus Data Inc.
    • Nutanix Inc.
    • Oracle Corp.
    • Pure Storage Inc.
    • Seagate Technology LLC
    • StorCentric Inc.
    • Western Digital Corp.

    Qualitative and quantitative analysis of companies has been conducted to help clients understand the wider business environment as well as the strengths and weaknesses of key industry players. Data is qualitatively analyzed to categorize companies as pure play, category-focused, industry-focused, and diversified; it is quantitatively analyzed to categorize companies as dominant, leading, strong, tentative, and weak.

    Recent Development and News in Enterprise Flash Storage Market

    • In January 2024, IBM announced the launch of its new FlashSystem 9100C all-flash storage system, offering up to 32 petabytes of capacity per system, marking a significant advancement in enterprise-level storage solutions (IBM Press Release).
    • In March 2024, Intel and Micron Technology, leaders in semiconductor manufacturing, formed a long-term strategic partnership to co-develop advanced NAND technology for enterprise SSDs, aiming to improve performance and reduce costs (Intel Press Release).
    • In May 2024, Pure Storage raised USD750 million in a funding round, bringing its total funding to over USD2.2 billion, further solidifying its position as a major player in the market (Pure Storage Press Release).
    • In January 2025, NetApp and Amazon Web Services (AWS) expanded their strategic collaboration by announcing the availability of NetApp ONTAP software on AWS Outposts, enabling customers to run enterprise-grade storage and data management services on-premises and in the cloud (NetApp Press Release).

    Research Analyst Overview

    • The market is experiencing significant activity and trends, with key areas of focus including storage upgrade strategies, optimization, and data security. Dram cache and read caching technologies enhance storage performance, while storage protocols ensure interoperability and network connectivity. Storage lifecycle management and wear leveling extend the life of flash storage, and storage support services offer maintenance and performance analysis. Data security is paramount, with data governance and encryption essential for protecting sensitive information. Storage automation streamlines implementation and budgeting, while hybrid cloud storage and multi-cloud storage solutions offer flexibility. Flash memory controllers and storage architecture innovations drive efficiency, and write acceleration tools improve application performance.
    • Cloud storage migration and storage migration tools facilitate seamless transitions, while data analytics provide valuable insights into storage usage and capacity. Storage company selection and storage architecture design are crucial elements of storage upgrade planning, with an emphasis on performance, capacity, and cost-effectiveness. Storage implementation and optimization strategies must balance these factors, while ensuring data security and network connectivity.

    Dive into Technavio’s robust research methodology, blending expert interviews, extensive data synthesis, and validated models for unparalleled Enterprise Flash Storage Market insights. See full methodology.

    Market Scope

    Report Coverage

    Details

    Page number

    228

    Base year

    2024

    Historic period

    2019-2023

    Forecast period

    2025-2029

    Growth momentum & CAGR

    Accelerate at a CAGR of 27.5%

    Market growth 2025-2029

    USD 27695.5 million

    Market structure

    Fragmented

    YoY growth 2024-2025(%)

    17.3

    Key countries

    US, China, Japan, India, South Korea, Australia, Canada, UK, Germany, and France

    Competitive landscape

    Leading Companies, Market Positioning of Companies, Competitive Strategies, and Industry Risks

    Request Free Sample

    What are the Key Data Covered in this Enterprise Flash Storage Market Research and Growth Report?

    • CAGR of the Enterprise Flash Storage industry during the forecast period
    • Detailed information on factors that will drive the growth and forecasting between 2025 and 2029
    • Precise estimation of the size of the market and its contribution of the industry in focus to the parent market
    • Accurate predictions about upcoming growth and trends and changes in consumer behaviour
    • Growth of the market across APAC, North America, Europe, South America, and Middle East and Africa
    • Thorough analysis of the market’s competitive landscape and detailed information about companies
    • Comprehensive analysis of factors that will challenge the enterprise flash storage market growth of industry companies

    We can help! Our analysts can customize this enterprise flash storage market research report to meet your requirements.

    Get in touch


    1 Executive Summary

    • 1.1 Market overview
      • Executive Summary - Chart on Market Overview
      • Executive Summary - Data Table on Market Overview
      • Executive Summary - Chart on Global Market Characteristics
      • Executive Summary - Chart on Market by Geography
      • Executive Summary - Chart on Market Segmentation by Application
      • Executive Summary - Chart on Market Segmentation by Type
      • Executive Summary - Chart on Market Segmentation by Product Type
      • Executive Summary - Chart on Market Segmentation by Capacity
      • Executive Summary - Chart on Incremental Growth
      • Executive Summary - Data Table on Incremental Growth
      • Executive Summary - Chart on Company Market Positioning

    2 Technavio Analysis

    • 2.1 Analysis of price sensitivity, lifecycle, customer purchase basket, adoption rates, and purchase criteria
      • Analysis of price sensitivity, lifecycle, customer purchase basket, adoption rates, and purchase criteria
    • 2.2 Criticality of inputs and Factors of differentiation
      • Overview on criticality of inputs and factors of differentiation
    • 2.3 Factors of disruption
      • Overview on factors of disruption
    • 2.4 Impact of drivers and challenges
      • Impact of drivers and challenges in 2024 and 2029

    3 Market Landscape

    • 3.1 Market ecosystem
      • Parent Market
      • Data Table on - Parent Market
    • 3.2 Market characteristics
      • Market characteristics analysis
    • 3.3 Value chain analysis
      • Value chain analysis

    4 Market Sizing

    • 4.1 Market definition
      • Offerings of companies included in the market definition
    • 4.2 Market segment analysis
      • Market segments
    • 4.3 Market size 2024
      • 4.4 Market outlook: Forecast for 2024-2029
        • Chart on Global - Market size and forecast 2024-2029 ($ million)
        • Data Table on Global - Market size and forecast 2024-2029 ($ million)
        • Chart on Global Market: Year-over-year growth 2024-2029 (%)
        • Data Table on Global Market: Year-over-year growth 2024-2029 (%)

      5 Historic Market Size

      • 5.1 Global Enterprise Flash Storage Market 2019 - 2023
        • Historic Market Size - Data Table on Global Enterprise Flash Storage Market 2019 - 2023 ($ million)
      • 5.2 Application segment analysis 2019 - 2023
        • Historic Market Size - Application Segment 2019 - 2023 ($ million)
      • 5.3 Type segment analysis 2019 - 2023
        • Historic Market Size - Type Segment 2019 - 2023 ($ million)
      • 5.4 Product Type segment analysis 2019 - 2023
        • Historic Market Size - Product Type Segment 2019 - 2023 ($ million)
      • 5.5 Capacity segment analysis 2019 - 2023
        • Historic Market Size - Capacity Segment 2019 - 2023 ($ million)
      • 5.6 Geography segment analysis 2019 - 2023
        • Historic Market Size - Geography Segment 2019 - 2023 ($ million)
      • 5.7 Country segment analysis 2019 - 2023
        • Historic Market Size - Country Segment 2019 - 2023 ($ million)

      6 Qualitative Analysis

      • 6.1 AI Impact on Global Enterprise Flash Storage Market

        7 Five Forces Analysis

        • 7.1 Five forces summary
          • Five forces analysis - Comparison between 2024 and 2029
        • 7.2 Bargaining power of buyers
          • Bargaining power of buyers - Impact of key factors 2024 and 2029
        • 7.3 Bargaining power of suppliers
          • Bargaining power of suppliers - Impact of key factors in 2024 and 2029
        • 7.4 Threat of new entrants
          • Threat of new entrants - Impact of key factors in 2024 and 2029
        • 7.5 Threat of substitutes
          • Threat of substitutes - Impact of key factors in 2024 and 2029
        • 7.6 Threat of rivalry
          • Threat of rivalry - Impact of key factors in 2024 and 2029
        • 7.7 Market condition
          • Chart on Market condition - Five forces 2024 and 2029

        8 Market Segmentation by Application

        • 8.1 Market segments
          • Chart on Application - Market share 2024-2029 (%)
          • Data Table on Application - Market share 2024-2029 (%)
        • 8.2 Comparison by Application
          • Chart on Comparison by Application
          • Data Table on Comparison by Application
        • 8.3 Telecom and IT - Market size and forecast 2024-2029
          • Chart on Telecom and IT - Market size and forecast 2024-2029 ($ million)
          • Data Table on Telecom and IT - Market size and forecast 2024-2029 ($ million)
          • Chart on Telecom and IT - Year-over-year growth 2024-2029 (%)
          • Data Table on Telecom and IT - Year-over-year growth 2024-2029 (%)
        • 8.4 Banking - Market size and forecast 2024-2029
          • Chart on Banking - Market size and forecast 2024-2029 ($ million)
          • Data Table on Banking - Market size and forecast 2024-2029 ($ million)
          • Chart on Banking - Year-over-year growth 2024-2029 (%)
          • Data Table on Banking - Year-over-year growth 2024-2029 (%)
        • 8.5 Financial services - Market size and forecast 2024-2029
          • Chart on Financial services - Market size and forecast 2024-2029 ($ million)
          • Data Table on Financial services - Market size and forecast 2024-2029 ($ million)
          • Chart on Financial services - Year-over-year growth 2024-2029 (%)
          • Data Table on Financial services - Year-over-year growth 2024-2029 (%)
        • 8.6 Others - Market size and forecast 2024-2029
          • Chart on Others - Market size and forecast 2024-2029 ($ million)
          • Data Table on Others - Market size and forecast 2024-2029 ($ million)
          • Chart on Others - Year-over-year growth 2024-2029 (%)
          • Data Table on Others - Year-over-year growth 2024-2029 (%)
        • 8.7 Market opportunity by Application
          • Market opportunity by Application ($ million)
          • Data Table on Market opportunity by Application ($ million)

        9 Market Segmentation by Type

        • 9.1 Market segments
          • Chart on Type - Market share 2024-2029 (%)
          • Data Table on Type - Market share 2024-2029 (%)
        • 9.2 Comparison by Type
          • Chart on Comparison by Type
          • Data Table on Comparison by Type
        • 9.3 Single level cell (SLC) - Market size and forecast 2024-2029
          • Chart on Single level cell (SLC) - Market size and forecast 2024-2029 ($ million)
          • Data Table on Single level cell (SLC) - Market size and forecast 2024-2029 ($ million)
          • Chart on Single level cell (SLC) - Year-over-year growth 2024-2029 (%)
          • Data Table on Single level cell (SLC) - Year-over-year growth 2024-2029 (%)
        • 9.4 Multi level cell (MLC) - Market size and forecast 2024-2029
          • Chart on Multi level cell (MLC) - Market size and forecast 2024-2029 ($ million)
          • Data Table on Multi level cell (MLC) - Market size and forecast 2024-2029 ($ million)
          • Chart on Multi level cell (MLC) - Year-over-year growth 2024-2029 (%)
          • Data Table on Multi level cell (MLC) - Year-over-year growth 2024-2029 (%)
        • 9.5 Triple level cell flash (TLC) - Market size and forecast 2024-2029
          • Chart on Triple level cell flash (TLC) - Market size and forecast 2024-2029 ($ million)
          • Data Table on Triple level cell flash (TLC) - Market size and forecast 2024-2029 ($ million)
          • Chart on Triple level cell flash (TLC) - Year-over-year growth 2024-2029 (%)
          • Data Table on Triple level cell flash (TLC) - Year-over-year growth 2024-2029 (%)
        • 9.6 Serial NAND - Market size and forecast 2024-2029
          • Chart on Serial NAND - Market size and forecast 2024-2029 ($ million)
          • Data Table on Serial NAND - Market size and forecast 2024-2029 ($ million)
          • Chart on Serial NAND - Year-over-year growth 2024-2029 (%)
          • Data Table on Serial NAND - Year-over-year growth 2024-2029 (%)
        • 9.7 Market opportunity by Type
          • Market opportunity by Type ($ million)
          • Data Table on Market opportunity by Type ($ million)

        10 Market Segmentation by Product Type

        • 10.1 Market segments
          • Chart on Product Type - Market share 2024-2029 (%)
          • Data Table on Product Type - Market share 2024-2029 (%)
        • 10.2 Comparison by Product Type
          • Chart on Comparison by Product Type
          • Data Table on Comparison by Product Type
        • 10.3 Hybrid flash array - Market size and forecast 2024-2029
          • Chart on Hybrid flash array - Market size and forecast 2024-2029 ($ million)
          • Data Table on Hybrid flash array - Market size and forecast 2024-2029 ($ million)
          • Chart on Hybrid flash array - Year-over-year growth 2024-2029 (%)
          • Data Table on Hybrid flash array - Year-over-year growth 2024-2029 (%)
        • 10.4 All-flash array - Market size and forecast 2024-2029
          • Chart on All-flash array - Market size and forecast 2024-2029 ($ million)
          • Data Table on All-flash array - Market size and forecast 2024-2029 ($ million)
          • Chart on All-flash array - Year-over-year growth 2024-2029 (%)
          • Data Table on All-flash array - Year-over-year growth 2024-2029 (%)
        • 10.5 Market opportunity by Product Type
          • Market opportunity by Product Type ($ million)
          • Data Table on Market opportunity by Product Type ($ million)

        11 Market Segmentation by Capacity

        • 11.1 Market segments
          • Chart on Capacity - Market share 2024-2029 (%)
          • Data Table on Capacity - Market share 2024-2029 (%)
        • 11.2 Comparison by Capacity
          • Chart on Comparison by Capacity
          • Data Table on Comparison by Capacity
        • 11.3 Less than 1TB - Market size and forecast 2024-2029
          • Chart on Less than 1TB - Market size and forecast 2024-2029 ($ million)
          • Data Table on Less than 1TB - Market size and forecast 2024-2029 ($ million)
          • Chart on Less than 1TB - Year-over-year growth 2024-2029 (%)
          • Data Table on Less than 1TB - Year-over-year growth 2024-2029 (%)
        • 1TB to 5TB - Market size and forecast 2024-2029
          • Chart on 1TB to 5TB - Market size and forecast 2024-2029 ($ million)
          • Data Table on 1TB to 5TB - Market size and forecast 2024-2029 ($ million)
          • Chart on 1TB to 5TB - Year-over-year growth 2024-2029 (%)
          • Data Table on 1TB to 5TB - Year-over-year growth 2024-2029 (%)
        • 5TB to 10TB - Market size and forecast 2024-2029
          • Chart on 5TB to 10TB - Market size and forecast 2024-2029 ($ million)
          • Data Table on 5TB to 10TB - Market size and forecast 2024-2029 ($ million)
          • Chart on 5TB to 10TB - Year-over-year growth 2024-2029 (%)
          • Data Table on 5TB to 10TB - Year-over-year growth 2024-2029 (%)
        • 11.6 Above 10TB - Market size and forecast 2024-2029
          • Chart on Above 10TB - Market size and forecast 2024-2029 ($ million)
          • Data Table on Above 10TB - Market size and forecast 2024-2029 ($ million)
          • Chart on Above 10TB - Year-over-year growth 2024-2029 (%)
          • Data Table on Above 10TB - Year-over-year growth 2024-2029 (%)
        • 11.7 Market opportunity by Capacity
          • Market opportunity by Capacity ($ million)
          • Data Table on Market opportunity by Capacity ($ million)

        12 Customer Landscape

        • 12.1 Customer landscape overview
          • Analysis of price sensitivity, lifecycle, customer purchase basket, adoption rates, and purchase criteria

        13 Geographic Landscape

        • 13.1 Geographic segmentation
          • Chart on Market share by geography 2024-2029 (%)
          • Data Table on Market share by geography 2024-2029 (%)
        • 13.2 Geographic comparison
          • Chart on Geographic comparison
          • Data Table on Geographic comparison
        • 13.3 APAC - Market size and forecast 2024-2029
          • Chart on APAC - Market size and forecast 2024-2029 ($ million)
          • Data Table on APAC - Market size and forecast 2024-2029 ($ million)
          • Chart on APAC - Year-over-year growth 2024-2029 (%)
          • Data Table on APAC - Year-over-year growth 2024-2029 (%)
        • 13.4 North America - Market size and forecast 2024-2029
          • Chart on North America - Market size and forecast 2024-2029 ($ million)
          • Data Table on North America - Market size and forecast 2024-2029 ($ million)
          • Chart on North America - Year-over-year growth 2024-2029 (%)
          • Data Table on North America - Year-over-year growth 2024-2029 (%)
        • 13.5 Europe - Market size and forecast 2024-2029
          • Chart on Europe - Market size and forecast 2024-2029 ($ million)
          • Data Table on Europe - Market size and forecast 2024-2029 ($ million)
          • Chart on Europe - Year-over-year growth 2024-2029 (%)
          • Data Table on Europe - Year-over-year growth 2024-2029 (%)
        • 13.6 South America - Market size and forecast 2024-2029
          • Chart on South America - Market size and forecast 2024-2029 ($ million)
          • Data Table on South America - Market size and forecast 2024-2029 ($ million)
          • Chart on South America - Year-over-year growth 2024-2029 (%)
          • Data Table on South America - Year-over-year growth 2024-2029 (%)
        • 13.7 Middle East and Africa - Market size and forecast 2024-2029
          • Chart on Middle East and Africa - Market size and forecast 2024-2029 ($ million)
          • Data Table on Middle East and Africa - Market size and forecast 2024-2029 ($ million)
          • Chart on Middle East and Africa - Year-over-year growth 2024-2029 (%)
          • Data Table on Middle East and Africa - Year-over-year growth 2024-2029 (%)
        • 13.8 US - Market size and forecast 2024-2029
          • Chart on US - Market size and forecast 2024-2029 ($ million)
          • Data Table on US - Market size and forecast 2024-2029 ($ million)
          • Chart on US - Year-over-year growth 2024-2029 (%)
          • Data Table on US - Year-over-year growth 2024-2029 (%)
        • 13.9 China - Market size and forecast 2024-2029
          • Chart on China - Market size and forecast 2024-2029 ($ million)
          • Data Table on China - Market size and forecast 2024-2029 ($ million)
          • Chart on China - Year-over-year growth 2024-2029 (%)
          • Data Table on China - Year-over-year growth 2024-2029 (%)
        • 13.10 Japan - Market size and forecast 2024-2029
          • Chart on Japan - Market size and forecast 2024-2029 ($ million)
          • Data Table on Japan - Market size and forecast 2024-2029 ($ million)
          • Chart on Japan - Year-over-year growth 2024-2029 (%)
          • Data Table on Japan - Year-over-year growth 2024-2029 (%)
        • 13.11 India - Market size and forecast 2024-2029
          • Chart on India - Market size and forecast 2024-2029 ($ million)
          • Data Table on India - Market size and forecast 2024-2029 ($ million)
          • Chart on India - Year-over-year growth 2024-2029 (%)
          • Data Table on India - Year-over-year growth 2024-2029 (%)
        • 13.12 South Korea - Market size and forecast 2024-2029
          • Chart on South Korea - Market size and forecast 2024-2029 ($ million)
          • Data Table on South Korea - Market size and forecast 2024-2029 ($ million)
          • Chart on South Korea - Year-over-year growth 2024-2029 (%)
          • Data Table on South Korea - Year-over-year growth 2024-2029 (%)
        • 13.13 Australia - Market size and forecast 2024-2029
          • Chart on Australia - Market size and forecast 2024-2029 ($ million)
          • Data Table on Australia - Market size and forecast 2024-2029 ($ million)
          • Chart on Australia - Year-over-year growth 2024-2029 (%)
          • Data Table on Australia - Year-over-year growth 2024-2029 (%)
        • 13.14 Canada - Market size and forecast 2024-2029
          • Chart on Canada - Market size and forecast 2024-2029 ($ million)
          • Data Table on Canada - Market size and forecast 2024-2029 ($ million)
          • Chart on Canada - Year-over-year growth 2024-2029 (%)
          • Data Table on Canada - Year-over-year growth 2024-2029 (%)
        • 13.15 UK - Market size and forecast 2024-2029
          • Chart on UK - Market size and forecast 2024-2029 ($ million)
          • Data Table on UK - Market size and forecast 2024-2029 ($ million)
          • Chart on UK - Year-over-year growth 2024-2029 (%)
          • Data Table on UK - Year-over-year growth 2024-2029 (%)
        • 13.16 Germany - Market size and forecast 2024-2029
          • Chart on Germany - Market size and forecast 2024-2029 ($ million)
          • Data Table on Germany - Market size and forecast 2024-2029 ($ million)
          • Chart on Germany - Year-over-year growth 2024-2029 (%)
          • Data Table on Germany - Year-over-year growth 2024-2029 (%)
        • 13.17 France - Market size and forecast 2024-2029
          • Chart on France - Market size and forecast 2024-2029 ($ million)
          • Data Table on France - Market size and forecast 2024-2029 ($ million)
          • Chart on France - Year-over-year growth 2024-2029 (%)
          • Data Table on France - Year-over-year growth 2024-2029 (%)
        • 13.18 Market opportunity by geography
          • Market opportunity by geography ($ million)
          • Data Tables on Market opportunity by geography ($ million)

        14 Drivers, Challenges, and Opportunity/Restraints

        • 14.1 Market drivers
          • 14.2 Market challenges
            • 14.3 Impact of drivers and challenges
              • Impact of drivers and challenges in 2024 and 2029
            • 14.4 Market opportunities/restraints

              15 Competitive Landscape

              • 15.1 Overview
                • 15.2 Competitive Landscape
                  • Overview on criticality of inputs and factors of differentiation
                • 15.3 Landscape disruption
                  • Overview on factors of disruption
                • 15.4 Industry risks
                  • Impact of key risks on business

                16 Competitive Analysis

                • 16.1 Companies profiled
                  • Companies covered
                • 16.2 Company ranking index
                  • Company ranking index
                • 16.3 Market positioning of companies
                  • Matrix on companies position and classification
                • 16.4 Broadcom Inc.
                  • Broadcom Inc. - Overview
                  • Broadcom Inc. - Business segments
                  • Broadcom Inc. - Key news
                  • Broadcom Inc. - Key offerings
                  • Broadcom Inc. - Segment focus
                  • SWOT
                • 16.5 Dell Technologies Inc.
                  • Dell Technologies Inc. - Overview
                  • Dell Technologies Inc. - Business segments
                  • Dell Technologies Inc. - Key news
                  • Dell Technologies Inc. - Key offerings
                  • Dell Technologies Inc. - Segment focus
                  • SWOT
                • 16.6 Hewlett Packard Enterprise Co.
                  • Hewlett Packard Enterprise Co. - Overview
                  • Hewlett Packard Enterprise Co. - Business segments
                  • Hewlett Packard Enterprise Co. - Key news
                  • Hewlett Packard Enterprise Co. - Key offerings
                  • Hewlett Packard Enterprise Co. - Segment focus
                  • SWOT
                • 16.7 Hitachi Ltd.
                  • Hitachi Ltd. - Overview
                  • Hitachi Ltd. - Business segments
                  • Hitachi Ltd. - Key news
                  • Hitachi Ltd. - Key offerings
                  • Hitachi Ltd. - Segment focus
                  • SWOT
                • 16.8 Huawei Technologies Co. Ltd.
                  • Huawei Technologies Co. Ltd. - Overview
                  • Huawei Technologies Co. Ltd. - Product / Service
                  • Huawei Technologies Co. Ltd. - Key news
                  • Huawei Technologies Co. Ltd. - Key offerings
                  • SWOT
                • 16.9 Intel Corp.
                  • Intel Corp. - Overview
                  • Intel Corp. - Business segments
                  • Intel Corp. - Key news
                  • Intel Corp. - Key offerings
                  • Intel Corp. - Segment focus
                  • SWOT
                • 16.10 International Business Machines Corp.
                  • International Business Machines Corp. - Overview
                  • International Business Machines Corp. - Business segments
                  • International Business Machines Corp. - Key news
                  • International Business Machines Corp. - Key offerings
                  • International Business Machines Corp. - Segment focus
                  • SWOT
                • 16.11 Kioxia Corp.
                  • Kioxia Corp. - Overview
                  • Kioxia Corp. - Product / Service
                  • Kioxia Corp. - Key offerings
                  • SWOT
                • 16.12 NetApp Inc.
                  • NetApp Inc. - Overview
                  • NetApp Inc. - Product / Service
                  • NetApp Inc. - Key news
                  • NetApp Inc. - Key offerings
                  • SWOT
                • 16.13 Nimbus Data Inc.
                  • Nimbus Data Inc. - Overview
                  • Nimbus Data Inc. - Product / Service
                  • Nimbus Data Inc. - Key offerings
                  • SWOT
                • 16.14 Oracle Corp.
                  • Oracle Corp. - Overview
                  • Oracle Corp. - Business segments
                  • Oracle Corp. - Key news
                  • Oracle Corp. - Key offerings
                  • Oracle Corp. - Segment focus
                  • SWOT
                • 16.15 Pure Storage Inc.
                  • Pure Storage Inc. - Overview
                  • Pure Storage Inc. - Product / Service
                  • Pure Storage Inc. - Key news
                  • Pure Storage Inc. - Key offerings
                  • SWOT
                • 16.16 Seagate Technology LLC
                  • Seagate Technology LLC - Overview
                  • Seagate Technology LLC - Product / Service
                  • Seagate Technology LLC - Key news
                  • Seagate Technology LLC - Key offerings
                  • SWOT
                • 16.17 StorCentric Inc.
                  • StorCentric Inc. - Overview
                  • StorCentric Inc. - Product / Service
                  • StorCentric Inc. - Key offerings
                  • SWOT
                • 16.18 Western Digital Corp.
                  • Western Digital Corp. - Overview
                  • Western Digital Corp. - Business segments
                  • Western Digital Corp. - Key offerings
                  • Western Digital Corp. - Segment focus
                  • SWOT

                17 Appendix

                • 17.1 Scope of the report
                  • 17.2 Inclusions and exclusions checklist
                    • Inclusions checklist
                    • Exclusions checklist
                  • 17.3 Currency conversion rates for US$
                    • Currency conversion rates for US$
                  • 17.4 Research methodology
                    • Research methodology
                  • 17.5 Data procurement
                    • Information sources
                  • 17.6 Data validation
                    • Data validation
                  • 17.7 Validation techniques employed for market sizing
                    • Validation techniques employed for market sizing
                  • 17.8 Data synthesis
                    • Data synthesis
                  • 17.9 360 degree market analysis
                    • 360 degree market analysis
                  • 17.10 List of abbreviations
                    • List of abbreviations

                  Research Methodology

                  Technavio presents a detailed picture of the market by way of study, synthesis, and summation of data from multiple sources. The analysts have presented the various facets of the market with a particular focus on identifying the key industry influencers. The data thus presented is comprehensive, reliable, and the result of extensive research, both primary and secondary.

                  INFORMATION SOURCES

                  Primary sources

                  • Manufacturers and suppliers
                  • Channel partners
                  • Industry experts
                  • Strategic decision makers

                  Secondary sources

                  • Industry journals and periodicals
                  • Government data
                  • Financial reports of key industry players
                  • Historical data
                  • Press releases

                  DATA ANALYSIS

                  Data Synthesis

                  • Collation of data
                  • Estimation of key figures
                  • Analysis of derived insights

                  Data Validation

                  • Triangulation with data models
                  • Reference against proprietary databases
                  • Corroboration with industry experts

                  REPORT WRITING

                  Qualitative

                  • Market drivers
                  • Market challenges
                  • Market trends
                  • Five forces analysis

                  Quantitative

                  • Market size and forecast
                  • Market segmentation
                  • Geographical insights
                  • Competitive landscape

                  Interested in this report?

                  Get your sample now to see our research methodology and insights!

                  Download Now

                  Frequently Asked Questions

                  Enterprise Flash Storage market growth will increase by $ 27695.5 mn during 2025-2029.

                  The Enterprise Flash Storage market is expected to grow at a CAGR of 27.5% during 2025-2029.

                  Enterprise Flash Storage market is segmented by Application( Telecom and IT, Banking, Financial services, Others) Type( Single-level cell (SLC), Multi-level cell (MLC), Triple-level cell flash (TLC), Serial NAND) Product Type( Hybrid flash array, All-flash array, Europe, South America, Middle East and Africa)

                  Broadcom Inc., Cisco Systems Inc., Datrox Computer Technologies Inc., Dell Technologies Inc., Hewlett Packard Enterprise Co., Hitachi Ltd., Huawei Technologies Co. Ltd., Infortrend Technology Inc., Intel Corp., International Business Machines Corp., Kioxia Corp., Lenovo Group Ltd., NetApp Inc., Nimbus Data Inc., Nutanix Inc., Oracle Corp., Pure Storage Inc., Seagate Technology LLC, StorCentric Inc., Western Digital Corp. are a few of the key vendors in the Enterprise Flash Storage market.

                  APAC will register the highest growth rate of 72% among the other regions. Therefore, the Enterprise Flash Storage market in APAC is expected to garner significant business opportunities for the vendors during the forecast period.

                  US, China, Japan, India, South Korea, Australia, Canada, UK, Germany, France

                  • Increasing demand for high-performance storage solutionsA significant driver driving the global enterprise flash storage market is the rise in demand for high-performance storage systems to handle big data and analytics applications. To extract useful insights from big data and analytics is the driving factor this market.
                  • data processing must be quick and effective. Enterprise flash storage outperforms conventional storage systems in terms of performance is the driving factor this market.
                  • allowing for rapid data access is the driving factor this market.
                  • retrieval is the driving factor this market.
                  • and analysis. Flash storage is highly suited for managing significant amounts of data in real time due to its high input/output operations per second (IOPS) and low latency. Additionally is the driving factor this market.
                  • the efficiency of big data processing is increased by the capacity of the flash storage system to manage multiple workloads simultaneously and provide stable performance. Enterprise flash storage will continue to be in high demand as long as businesses continue to produce enormous amounts of data is the driving factor this market.
                  • which is a fundamental enabler of big data analytics. This is the driving factor this market.
                  • in turn is the driving factor this market.
                  • will drive the growth of the global enterprise flash storage market during the forecast period. is the driving factor this market.

                  The Enterprise Flash Storage market vendors should focus on grabbing business opportunities from the Telecom and IT segment as it accounted for the largest market share in the base year.