
Enhanced Oil Recovery Market Size 2024-2028
The enhanced oil recovery market size is forecast to increase by USD 23.81 billion at a CAGR of 8.51% between 2023 and 2028.
- The Enhanced Oil Recovery (EOR) market is experiencing significant growth due to the exploration of unconventional resources and increasing R&D investments. EOR technologies are essential for extracting oil from reservoirs that cannot be recovered through conventional methods. One of the primary drivers is the application of advanced technologies, such as CO2 injection, in the Permian Basin, which has led to the extraction of crude oil from reservoirs previously considered uneconomical. However, the implementation of these technologies comes with environmental risks, which are a major challenge for market growth. The thermal segment, which includes thermal EOR techniques, is expected to grow due to the high oil viscosity and mobility ratio of heavy oil reservoirs. To mitigate these risks, companies are focusing on developing eco-friendly EOR methods. Additionally, the high capital requirements and operational complexities associated with EOR technologies are also hindering market growth. Nevertheless, the potential for increased oil production and the depletion of conventional oil reserves are driving market demand. The market is expected to witness steady growth In the coming years, with a focus on innovation and sustainability.
What will be the Size of the Enhanced Oil Recovery Market During the Forecast Period?

- The Enhanced Oil Recovery (EOR) market is experiencing significant growth due to the increasing focus on maximizing production from mature oil fields. With the depletion of conventional oil reserves, the global energy landscape is shifting towards tertiary oil recovery methods. EOR technologies, including thermal, gas, and chemical injection techniques, are increasingly being adopted to extract heavy oil and hydrocarbons from reservoirs with poor permeability. Mature oilfields, which account for a substantial portion of global oil reserves, are particularly benefiting from these advanced recovery methods. Thermal EOR techniques, such as steam injection, are effective in extracting heavy oil from reservoirs. Gas injection, including carbon dioxide and natural gas, is another popular method for improving oil recovery. Chemical injection, which involves the use of solvents, surfactants, and other chemicals, is also gaining traction In the market. With the depletion of conventional oil reserves, focus is shifting towards tertiary oil recovery methods to extract hydrocarbons from aged wells and oilfields.
- Furthermore, the ongoing construction of LNG projects and the shift towards renewable energy sources are expected to provide opportunities for growth In the EOR market. Despite these opportunities, challenges such as high capital costs and operational complexities remain. The use of EOR technologies is becoming increasingly important as the world moves towards LNG project constructions and the transition towards renewable energy sources. The market is expected to continue its growth trajectory, driven by the need to extract hard-to-reach hydrocarbons and maximize production from aging oil reservoirs. Primary and secondary recovery methods, while effective In their own right, are no longer sufficient to meet the world's increasing energy demands. EOR technologies offer a viable solution for extracting oil from reservoirs that were once thought to be depleted. The future of the oil and gas industry lies In the adoption of these advanced recovery methods.
How is this Enhanced Oil Recovery Industry segmented and which is the largest segment?
The enhanced oil recovery industry research report provides comprehensive data (region-wise segment analysis), with forecasts and estimates in "USD billion" for the period 2024-2028, as well as historical data from 2018-2022 for the following segments.
- Technology
- Thermal injection
- Gas injection
- Chemical injection
- Others
- Geography
- North America
- Canada
- US
- Europe
- UK
- Norway
- APAC
- China
- Middle East and Africa
- South America
- North America
By Technology Insights
- The thermal injection segment is estimated to witness significant growth during the forecast period.
Thermal Enhanced Oil Recovery (EOR) is a technique used to extract heavy and viscous crude oil from mature fields with poor permeability. This process employs thermal methods, including steam and in situ combustion, to inject heat into the reservoir. The heat reduces oil viscosity and enhances mobility, enabling the recovery of crude oil from aged wells and unconventional resources, such as shale reserves and tar sand. Thermal EOR technologies, including steam injection and thermal injection, are commonly used In the oil industry for tertiary oil recovery. These methods involve the injection of heat, typically In the form of steam, into the reservoir to improve oil recovery rates.
Additionally, thermal EOR is particularly effective for heavy oil reservoirs, where the high viscosity and mobility ratio pose challenges for conventional extraction methods. Government funding and financial incentives, such as tax credits and subsidies, have driven the adoption of these technologies, especially In the Permian Basin and offshore oilfields. CO2 injection technology, CCS technology, polymers, and surfactants are also used in conjunction with thermal EOR to enhance oil recovery. Thermal EOR is a crucial component of the oil industry's efforts to maximize the recovery of crude oil reserves while minimizing greenhouse gas emissions.
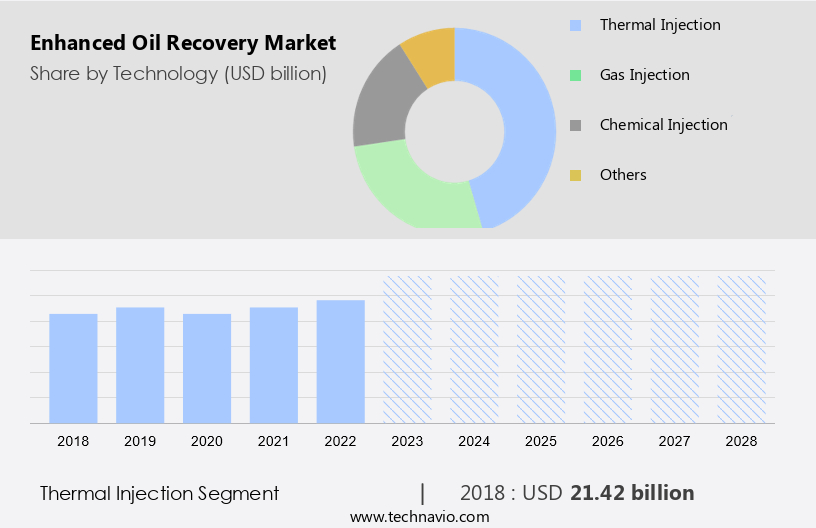
Get a glance at the Enhanced Oil Recovery Industry report of share of various segments Request Free Sample
The thermal injection segment was valued at USD 21.42 billion in 2018 and showed a gradual increase during the forecast period.
Regional Analysis
- North America is estimated to contribute 38% to the growth of the global market during the forecast period.
Technavio's analysts have elaborately explained the regional trends and drivers that shape the market during the forecast period.

For more insights on the market share of various regions, Request Free Sample
The Enhanced Oil Recovery (EOR) market in North America is poised for growth due to the presence of a substantial mature oil and gas asset base, particularly In the Gulf of Mexico. This region also holds significant potential for unconventional oil and gas resources in countries like Canada, the US, Mexico, and Argentina. In the US, thermal and gas injection techniques dominate EOR production, accounting for approximately 40% and 60% respectively. Thermal techniques, including Steam, In situ combustion, and Thermal injection, are widely used to enhance oil recovery from aging wells and oilfields with poor permeability and heavy oil reservoirs.
Moreover, CO? injection technology, a type of gas injection, is projected to unlock an additional 39-48 billion barrels of oil In the US before 2030. The EOR market expansion is further driven by the increasing demand for crude oil, government funding, and financial incentives such as tax benefits and subsidies. EOR technologies, including Chemical injection (using polymers, surfactants, and alkali), Hot water, and Natural gas or Nitrogen injection, are essential for maximizing oil recovery from both onshore and offshore oilfields. The oil industry's ongoing activities, including the construction of LNG projects, are also expected to boost the market's growth. Additionally, Carbon Capture, Utilization, and Storage (CCS) technology is gaining traction as a sustainable solution for reducing greenhouse gas emissions.
Market Dynamics
Our researchers analyzed the data with 2023 as the base year, along with the key drivers, trends, and challenges. A holistic analysis of drivers will help companies refine their marketing strategies to gain a competitive advantage.
What are the key market drivers leading to the rise In the adoption of Enhanced Oil Recovery Industry?
Exploring unconventional resources is the key driver of the market.
- As traditional oil and gas reserves become increasingly scarce, the focus on enhancing the recovery of hydrocarbons from mature fields through Enhanced Oil Recovery (EOR) technologies has gained significant importance. EOR techniques, including thermal, chemical, and gas injection methods, are being employed to extract heavy oil from reservoirs with poor permeability and high oil viscosity. The thermal segment, which includes Steam Assisted Gravity Drainage (SAGD) and Cyclic Steam Stimulation (CSS), is particularly effective for heavy oil reserves. In situ combustion, another thermal EOR method, involves the controlled burning of heavy oil in place to reduce its viscosity and improve mobility ratio. These techniques, which include thermal EOR methods such as steam injection and in situ combustion, are particularly effective for extracting heavy oil and bitumen.
- The onshore segment dominates the EOR market due to the presence of a large number of aged wells and shallow wells. However, offshore oilfields, such as those In the Permian Basin, are also adopting EOR technologies to maximize crude oil production. Unconventional resources, including shale reserves, are also being targeted through EOR processes to extract hard-to-reach hydrocarbons. Government funding, tax benefits, and financial incentives are driving the adoption of EOR technologies. For instance, Carbon Capture, Utilization, and Storage (CCS) technology, which is used in CO2 injection for EOR, is receiving significant attention due to its potential to reduce greenhouse gas emissions. Polymers and surfactants are also used in EOR processes to improve the mobility of oil and reduce interfacial pressure. The oil industry is investing heavily in EOR technologies to reduce crude oil prices and maintain profitability, despite the high upfront costs. The global EOR market is expected to grow significantly In the coming years due to the increasing demand for hydrocarbons and the need to optimize oil and gas production from mature fields.
What are the market trends shaping the Enhanced Oil Recovery Industry?
Increasing R&D investment is the upcoming market trend.
- The global oil and gas industry is witnessing significant investment in Enhanced Oil Recovery (EOR) technologies to maximize the extraction of heavy oil reserves from mature fields. EOR techniques, including thermal, gas, and chemical methods, are increasingly being adopted to improve the mobility ratio of hydrocarbons in reservoirs with poor permeability. In the US, the Permian Basin is a major focus area for EOR, with companies employing CO2 injection technology, such as Miscalible Floods and Carbon Capture and Storage (CCS), to extract crude oil from unconventional resources like shale reserves. Government funding and financial incentives, including tax benefits and subsidies, are crucial for the growth of the EOR market.
- For instance, the thermal segment, which utilizes heat to reduce oil viscosity, is expected to dominate the market due to its proven success in increasing oil recovery rates. In situ combustion, a thermal EOR method, has shown promising results in enhancing the recovery of heavy oil from shallow wells. Moreover, the offshore oil industry is also adopting EOR technologies to optimize the production from aging wells and onshore oilfields. Companies are exploring the use of surfactants, polymers, and alkali solutions to improve the interfacial pressure and flooded viscosity, thereby reducing the conventional extraction costs. The adoption of EOR technologies is also essential to reduce greenhouse gas emissions from the oil industry activities, as the use of natural gas, nitrogen, and carbon dioxide for injection can help minimize the carbon footprint. In summary, the global EOR market is expected to grow significantly In the coming years due to the increasing demand for crude oil and the need to optimize the production from mature oilfields. The market is driven by the advancements in EOR technologies, government funding, and the growing focus on reducing carbon emissions. The thermal segment, with its proven success in improving oil recovery rates, is expected to dominate the market, while the use of CCS technology and chemical injection methods is gaining popularity to reduce the environmental impact of oil production.
What challenges does the Enhanced Oil Recovery Industry face during its growth?
Environmental risks associated with enhanced oil recovery technologies are key challenges affecting the industry growth.
- Enhanced oil recovery (EOR) In the oil and gas industry involves the application of advanced technologies to extract hard-to-reach hydrocarbons from mature fields, including heavy oil reserves and unconventional resources such as shale reserves and tar sands. EOR technologies, including thermal EOR methods like steam injection, in situ combustion, and chemical injection using polymers, surfactants, and alkali, enable the extraction of oil from reservoirs with poor permeability and high oil viscosity. These techniques are crucial for maximizing production from aging wells and oilfields, especially as crude oil prices remain volatile and government funding for exploration and conventional extraction costs rise.
- However, EOR projects come with environmental challenges. Thermal EOR methods, for instance, require large quantities of heat and water, leading to significant greenhouse gas emissions and water usage. In addition, CO2 injection technology used in some EOR processes contributes to carbon emissions and requires careful management to minimize leakage. These concerns have led to increased focus on carbon capture, utilization, and storage (CCS) technology and the use of renewable energy sources in EOR projects. Despite these challenges, the onshore segment of the oil industry continues to invest in EOR technologies, with companies like Repsol and others pursuing innovative approaches to reduce environmental impact and improve efficiency. Offshore oilfields also employ EOR methods, particularly In the thermal segment, where heat is used to reduce oil viscosity and improve mobility ratio. The use of miscible fluids, such as natural gas, nitrogen, and carbon dioxide, in gas injection and chemical injection processes, can also enhance oil recovery. Government subsidies, tax benefits, and financial incentives play a crucial role In the adoption of EOR technologies. For instance, the US government has provided significant funding for research and development in EOR, recognizing its importance in maximizing domestic oil production while minimizing environmental impact. As the oil industry continues to evolve, EOR technologies will remain a critical component of the energy landscape, enabling the recovery of vast oil reserves while addressing the challenges of sustainability and environmental stewardship.
Exclusive Customer Landscape
The enhanced oil recovery market forecasting report includes the adoption lifecycle of the market, market growth and forecasting, covering from the innovator's stage to the laggard's stage. It focuses on adoption rates in different regions based on penetration. Furthermore, the enhanced oil recovery market report also includes key purchase criteria and drivers of price sensitivity to help companies evaluate and develop their market growth analysis strategies.

Customer Landscape
Key Companies & Market Insights
Companies are implementing various strategies, such as strategic alliances, enhanced oil recovery market forecast, partnerships, mergers and acquisitions, geographical expansion, and product/service launches, to enhance their presence In the industry. The industry research and growth report includes detailed analyses of the competitive landscape of the market and information about key companies, including:
- Baker Hughes Co.
- BP Plc
- Cenovus Energy Inc.
- ChampionX Corp.
- Chemiphase Ltd.
- Chevron Corp.
- Clariant International Ltd.
- DuPont de Nemours Inc.
- Halliburton Co.
- Japan Petroleum Exploration Co. Ltd.
- Linde Plc
- Oil and Natural Gas Corp. Ltd.
- Petroleum Development Oman LLC
- Qyrin Petroleum Technology
- Schlumberger Ltd.
- Shell plc
- TechnipFMC plc
- Titan Oil Recovery Inc.
- TotalEnergies SE
- XYTEL Corp.
Qualitative and quantitative analysis of companies has been conducted to help clients understand the wider business environment as well as the strengths and weaknesses of key industry players. Data is qualitatively analyzed to categorize companies as pure play, category-focused, industry-focused, and diversified; it is quantitatively analyzed to categorize companies as dominant, leading, strong, tentative, and weak.
Research Analyst Overview
The Enhanced Oil Recovery (EOR) market encompasses a range of technologies and techniques employed to extract hydrocarbons from reservoirs that have reached the limits of primary and secondary recovery methods. EOR processes aim to improve the mobility of hydrocarbons within reservoirs, enhancing the recovery rate and ultimately increasing the overall production from oilfields. Mature fields, characterized by heavy oil reserves and poor permeability, have become a significant focus for EOR technologies. These methods, including thermal EOR, in situ combustion, and chemical injection, have proven effective in extracting hydrocarbons from reservoirs that were once thought to be depleted. EOR technologies have gained increasing attention due to the growing importance of maximizing oil production from existing reserves. With the global focus on reducing crude oil prices and minimizing carbon emissions, EOR processes offer a viable solution for the oil industry. Heat is a crucial factor in many EOR processes. Thermal EOR methods, such as steam injection and thermal injection, use heat to reduce the viscosity of heavy oil and improve its mobility. In situ combustion, on the other hand, involves igniting the oil in place, releasing the heat required to mobilize the hydrocarbons. The use of miscible fluids, such as CO2, nitrogen, and natural gas, is another common EOR technique.
Furthermore, these fluids are injected into the reservoir to displace the oil and reduce its viscosity, making it easier to extract. Surfactant solutions and alkali are also employed to reduce interfacial tension and improve the wettability of the reservoir rock, enhancing the oil recovery. EOR processes can be applied to both onshore and offshore oilfields, with offshore oilfields presenting unique challenges due to their complex geological structures and operational conditions. Offshore oil industry players have shown significant interest in EOR technologies, with companies such as Repsol investing in CO2 injection and other tertiary oil recovery methods. Government funding, subsidies, tax benefits, and financial incentives have played a crucial role In the adoption of EOR technologies. These initiatives have encouraged the development and implementation of EOR processes, particularly in regions with significant oil reserves and high production costs, such as the Permian Basin.
Thus, despite the advantages of EOR technologies, they also present challenges, including high capital costs, complex operational requirements, and potential environmental concerns related to greenhouse gas emissions. The ongoing research and development efforts In the field aim to address these challenges and improve the efficiency and sustainability of EOR processes. In summary, the market represents a critical area of innovation and growth within the oil industry. With a focus on maximizing production from mature fields and reducing crude oil prices, EOR technologies offer a viable solution for extracting hydrocarbons from reservoirs that have reached the limits of primary and secondary recovery methods. The ongoing development and implementation of these technologies will continue to shape the future of the oil industry.
|
Market Scope |
|
|
Report Coverage |
Details |
|
Page number |
161 |
|
Base year |
2023 |
|
Historic period |
2018-2022 |
|
Forecast period |
2024-2028 |
|
Growth momentum & CAGR |
Accelerate at a CAGR of 8.51% |
|
Market growth 2024-2028 |
USD 23.81 billion |
|
Market structure |
Fragmented |
|
YoY growth 2023-2024(%) |
7.67 |
|
Key countries |
US, Canada, Norway, Russia, China, and UK |
|
Competitive landscape |
Leading Companies, Market Positioning of Companies, Competitive Strategies, and Industry Risks |
What are the Key Data Covered in this Enhanced Oil Recovery Market Research and Growth Report?
- CAGR of the Enhanced Oil Recovery industry during the forecast period
- Detailed information on factors that will drive the growth and forecasting between 2024 and 2028
- Precise estimation of the size of the market and its contribution of the industry in focus to the parent market
- Accurate predictions about upcoming growth and trends and changes in consumer behaviour
- Growth of the market across North America, Europe, APAC, Middle East and Africa, and South America
- Thorough analysis of the market's competitive landscape and detailed information about companies
- Comprehensive analysis of factors that will challenge the enhanced oil recovery market growth of industry companies
We can help! Our analysts can customize this enhanced oil recovery market research report to meet your requirements.
 RIA -
RIA - 
