Edible Oil Market Analysis, Size, and Forecast 2025-2029: North America (US and Canada), Europe (Germany, Russia, and UK), APAC (China, India, Indonesia, and Japan), South America (Brazil), and Rest of World (ROW)

Edible Oil Market Analysis, Size, and Forecast 2025-2029:
North America (US and Canada), Europe (Germany, Russia, and UK), APAC (China, India, Indonesia, and Japan), South America (Brazil), and Rest of World (ROW)

Published: Jun 2025 217 Pages SKU: IRTNTR71559

Market Overview at a Glance

$18.37 B
Market Opportunity
3.4%
CAGR
3.2
YoY growth 2024-2025(%)

Edible Oil Market Size 2025-2029

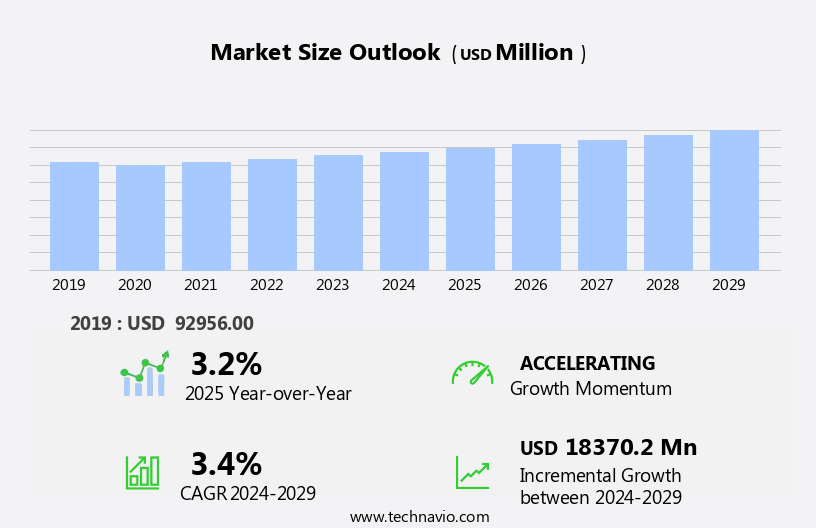
The edible oil market size is forecast to increase by USD 18.37 billion, at a CAGR of 3.4% between 2024 and 2029.

  • The market is driven by the surging demand for trans-fat-free oils due to growing health consciousness among consumers. This trend is fueled by increasing awareness regarding the harmful effects of trans fats on human health. Furthermore, advancements in agriculture technology have enabled the production of high-quality, healthy oils, providing opportunities for market growth. However, the market faces distribution challenges that hinder its expansion. The complex supply chain and logistical issues in transporting edible oils from production sites to consumers in various regions create hurdles for market participants.
  • Companies must navigate these challenges by implementing robust logistics strategies and collaborating with reliable partners to ensure the timely and efficient delivery of their products. By addressing these challenges and catering to the evolving consumer preferences, market players can capitalize on the growing demand for healthier edible oil options and strengthen their market position. Consumer preferences for healthier alternatives, such as olive oil, are driving demand for alternative oils

What will be the Size of the Edible Oil Market during the forecast period?

Edible Oil Market Size

Explore in-depth regional segment analysis with market size data - historical 2019-2023 and forecasts 2025-2029 - in the full report.  
Request Free Sample

The market continues to evolve, shaped by dynamic market forces and shifting consumer preferences. Unsaturated fats, such as monounsaturated and polyunsaturated fatty acids, have gained prominence in food processing due to their health benefits. Cold-pressed oils, like olive and avocado, with their desirable nutritional profiles and high omega-3 and omega-6 fatty acid content, have gained popularity in various sectors. The fatty acid profile of oils, including rapeseed, sunflower, safflower, and canola, influences their applications in food processing and dietary guidelines. Smoke point and peroxide value are crucial factors in determining the suitability of oils for cooking applications. Linseed oil, with its high polyunsaturated fat content and low smoke point, is often used in non-cooking applications.

Price volatility, driven by factors like supply chain disruptions and government regulations, impacts the market. Organic and unrefined oils, with their perceived health benefits and higher production costs, command premium prices. Oxidation stability and moisture content are essential considerations for maintaining the quality and shelf life of edible oils. Sustainability concerns, particularly in the palm oil sector, have led to increased scrutiny and regulations. Corn oil, peanut oil, and other vegetable oils are used extensively in salad dressings and food manufacturing. Labeling requirements and consumer preferences for trans-fat-free and low-saturated fat options continue to shape the market landscape. The market is a complex web of interconnected factors, from production methods like solvent extraction and expeller-pressed oil to consumer preferences and government regulations.

The ongoing unfolding of market activities and evolving patterns underscores the importance of staying informed and adaptable in this ever-changing industry.

How is this Edible Oil Industry segmented?

The edible oil industry research report provides comprehensive data (region-wise segment analysis), with forecasts and estimates in "USD million" for the period 2025-2029, as well as historical data from 2019-2023 for the following segments.

  • End-user
    • Retail
    • Food service
    • Food processor
  • Packaging
    • Pouches
    • Bottles
    • Jars
    • Cans
  • Type
    • Palm oil
    • Soybean oil
    • Sunflower oil
    • Mustard oil
    • Others
  • Geography
    • North America
      • US
      • Canada
    • Europe
      • Germany
      • Russia
      • UK
    • APAC
      • China
      • India
      • Indonesia
      • Japan
    • South America
      • Brazil
    • Rest of World (ROW)

By End-user Insights

The Retail segment is estimated to witness significant growth during the forecast period. The market encompasses various types of oils, including unsaturated ones like rapeseed, sunflower, safflower, olive, and avocado, which provide healthier alternatives to saturated fats. The futures market plays a significant role in price determination, influencing the supply chain. Trans fats, however, are a concern due to their adverse health effects, leading to increased focus on omega-6 and omega-3 fatty acids. Cholesterol content is a critical consideration, with olive, canola, and flaxseed oils offering heart-healthy benefits. Food processing techniques, such as cold-pressing, expeller-pressing, and solvent extraction, impact the oil's nutritional value, smoke point, and oxidation stability. Consumer preferences prioritize monounsaturated and polyunsaturated fats, leading to the popularity of olive, avocado, and nut oils.

Labeling requirements ensure transparency regarding the oil's origin, production methods, and nutritional information. Government regulations mandate food safety and sustainability standards, particularly for palm oil production. The retail segment, including supermarkets, hypermarkets, and online platforms, caters to diverse consumer preferences, with growing demand for organic, unrefined, and specialty oils. In 2024, the retail segment experienced significant growth due to increasing health consciousness and consumer interest in premium oil options.

Edible Oil Market Size

Request Free Sample

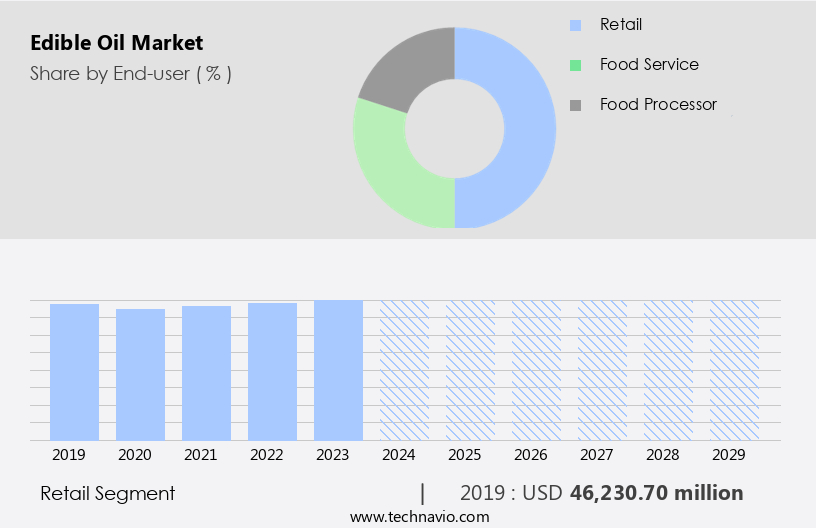
The Retail segment was valued at USD 46.23 billion in 2019 and showed a gradual increase during the forecast period.

The Edible Oil Market is flourishing with diverse offerings that cater to health-conscious and culinary-focused consumers alike. Oils such as cottonseed oil, rice bran oil, and safflower oil are gaining prominence for their favorable nutritional profiles and versatility. The market distinguishes between refined oil and unrefined oil, with many consumers turning to virgin oil, organic oil, and coldpressed oil for their natural properties and minimal processing. Emphasis is growing on oils rich in unsaturated fat, which support heart health, while products containing trans fat are increasingly avoided. A popular application remains in salad dressing, where flavor, aroma, and nutritional value play crucial roles.

Regional Analysis

APAC is estimated to contribute 45% to the growth of the global market during the forecast period. Technavio's analysts have elaborately explained the regional trends and drivers that shape the market during the forecast period.

Edible Oil Market Share by Geography

 Request Free Sample

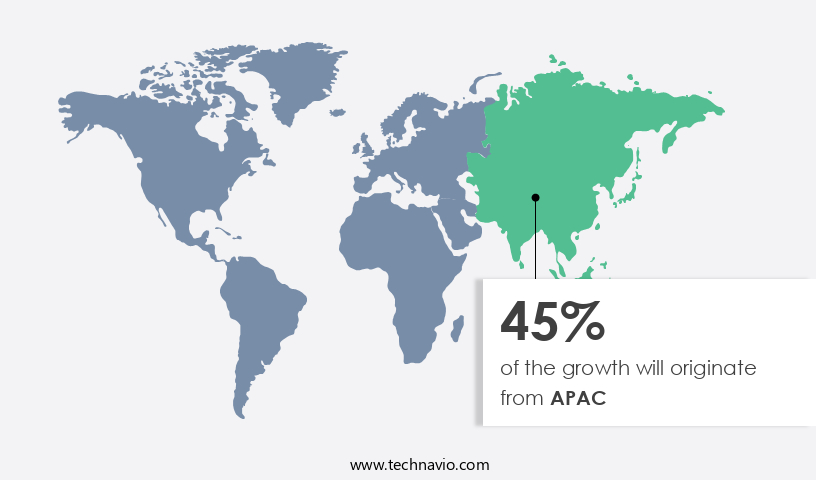
The market in Asia Pacific (APAC) is experiencing notable growth, fueled by population expansion, rising disposable income, and evolving dietary preferences. Urbanization leads consumers to opt for convenience foods, escalating the demand for various edible oils such as palm, soybean, and canola. Palm oil, renowned for its versatility and affordability, is the most consumed edible oil in APAC. Indonesia and Malaysia, as leading producers, significantly influence the regional supply chain. According to the USDA Foreign Agricultural Services 2024 Palm Oil Production Report, these countries continued to dominate global palm oil production. Unsaturated fats, particularly omega-6 and omega-3 fatty acids, are integral components of edible oils.

Cold-pressed oils, like olive and sesame, retain their natural nutritional value due to minimal processing. Trans fats, however, are detrimental to health and have been phased out in many countries. Food processing, including refining, solvent extraction, and expeller-pressing, impacts the oil's fatty acid profile, smoke point, peroxide value, and oxidation stability. Edible oils, including rapeseed, sunflower, safflower, corn, and peanut, cater to diverse consumer preferences and dietary guidelines. Nutritional value, health benefits, and monounsaturated and polyunsaturated fat content influence consumer choices. Labeling requirements and food safety regulations are essential considerations for manufacturers and consumers. Coconut oil and avocado oil, with their unique taste and nutritional properties, are gaining popularity.

Linseed oil, rich in omega-3 fatty acids, is used for culinary and industrial purposes. Price volatility, driven by supply chain disruptions and government regulations, impacts the market dynamics. Organic and unrefined oils are preferred for their superior nutritional value and health benefits. Palm oil sustainability is a critical issue, with increasing concerns over deforestation and its environmental impact. Soybean oil production is also a significant factor, with the US, Brazil, and Argentina being major producers. The market in APAC is witnessing significant growth, driven by population expansion, rising disposable income, and evolving dietary preferences.

The market is diverse, with various edible oils catering to different consumer preferences and health concerns. Producers and manufacturers must navigate the complex supply chain, price volatility, and regulatory landscape to meet consumer demands and maintain profitability.

Market Dynamics

Our researchers analyzed the data with 2024 as the base year, along with the key drivers, trends, and challenges. A holistic analysis of drivers will help companies refine their marketing strategies to gain a competitive advantage.

What are the key market drivers leading to the rise in the adoption of Edible Oil Industry?

  • The significant rise in demand for trans-fat-free oils serves as the primary market driver. Edible oils, such as sunflower oil, canola oil, coconut oil, and avocado oil, have gained significant attention due to their nutritional value and health benefits. With increasing health concerns, consumers are becoming more conscious of their dietary choices. According to the International Diabetes Federation (IDF) Diabetes Atlas 11th Edition, the global prevalence of diabetes reached 589 million adults in 2020, representing 11.1% of the global adult population. This alarming increase in health issues has led people to prioritize healthy eating habits. Sunflower oil, rich in monounsaturated fat, is a popular choice for heart health.
  • Avocado oil, known for its high oleic acid content, is another preferred option due to its health benefits. Nutritional guidelines recommend limiting free fatty acids and saturated fats, making monounsaturated and polyunsaturated oils preferred choices for cooking. Food processing techniques, such as expeller-pressed oil, are increasingly popular due to their minimal processing and preservation of nutritional value. Canola oil, a popular cooking oil, is rich in monounsaturated and polyunsaturated fats, making it a healthy alternative to traditional oils. Coconut oil, while high in saturated fats, is still used in various applications due to its unique flavor and health benefits.

What are the market trends shaping the Edible Oil Industry?

  • Advancements in agriculture technology are currently shaping market trends. The integration of innovative farming technologies, such as precision agriculture and automation, is revolutionizing modern farming practices. The market is experiencing significant advancements due to technological innovations in agriculture. Precision farming, which employs data analytics and satellite imagery, optimizes resource usage and enhances crop health, leading to increased production of oilseeds such as soybeans, palm oil, and canola. The integration of biotechnology and genetically modified (GM) crops improves resistance to pests, diseases, and environmental stresses, contributing to sustainable farming practices and higher yields. These developments also reduce the need for chemical pesticides, ensuring a more eco-friendly approach to oilseed production.
  • Smoke point and peroxide value are crucial factors influencing the choice of edible oils in the market. Palm oil, a widely used edible oil, is undergoing sustainability initiatives to address concerns regarding its production methods. Corn oil, another popular choice, is subject to labeling requirements due to its high polyunsaturated fat content. The market's price volatility is influenced by various factors, including supply and demand dynamics, weather conditions, and geopolitical events. Moreover, consumer preferences for healthier alternatives are driving demand for edible oils with high oxidation stability, such as organic and unrefined oils, including linseed oil and peanut oil.

What challenges does the Edible Oil Industry face during its growth?

  • The distribution challenges represent a significant hurdle to the expansion and growth of the industry. The market dynamics are influenced by various factors, including raw material prices, logistical challenges, and regulatory requirements. Volatility in energy and input costs, geopolitical instability, and export restrictions create uncertainties in sourcing and inventory management for manufacturers. Logistical hurdles such as port congestion, container shortages, and customs clearance inefficiencies can delay shipments and increase operational expenses. Compliance with sustainability and traceability regulations adds complexity to distribution, necessitating substantial investment in digital monitoring systems and closer collaboration with supply chain partners. Retailers and distributors face challenges in ensuring a steady supply and competitive pricing due to tariff adjustments and regional policy changes.
  • Consumer preferences for healthier options, such as salad dressings made with rice bran or sesame oil, and lower moisture content in refined oils like cottonseed and soybean oil, further impact market dynamics. Government regulations on saturated fat content in food products also influence the demand for various edible oils. Oil refining processes, such as degumming, neutralization, bleaching, and deodorization, are used to improve the appearance, taste, and shelf life of edible oils. Despite these processes, the nutritional value and health benefits of the oils remain largely intact. Overall, the demand for edible oils with superior nutritional profiles and health benefits continues to grow as consumers prioritize their health and well-being.

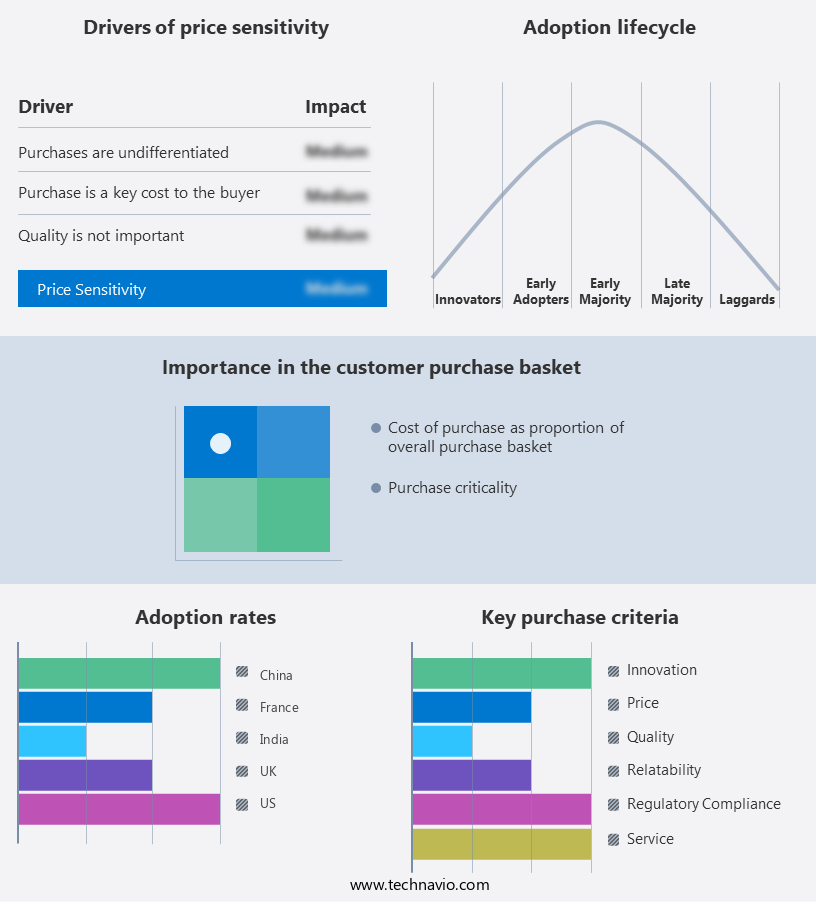
Exclusive Customer Landscape

The edible oil market forecasting report includes the adoption lifecycle of the market, covering from the innovator's stage to the laggard's stage. It focuses on adoption rates in different regions based on penetration. Furthermore, the edible oil market report also includes key purchase criteria and drivers of price sensitivity to help companies evaluate and develop their market growth analysis strategies.

Edible Oil Market Share by Geography

 Customer Landscape

Key Companies & Market Insights

Companies are implementing various strategies, such as strategic alliances, edible oil market forecast, partnerships, mergers and acquisitions, geographical expansion, and product/service launches, to enhance their presence in the industry.

Adams Group - This company specializes in providing a diverse selection of certified organic edible oils, including palm, soybean, coconut, canola, and high-oleic varieties.

The industry research and growth report includes detailed analyses of the competitive landscape of the market and information about key companies, including:

  • Adams Group
  • American Vegetable Oils Inc.
  • Archer Daniels Midland Co.
  • Associated British Foods Plc
  • Aveno NV
  • AWL Agri Business Limited
  • Bunge Global SA
  • Cargill Inc.
  • Cereal Docks Spa
  • COFCO Corp.
  • Emami Agrotech Ltd.
  • Fuji Oil Co. Ltd.
  • Fytel Edible Oils Ltd
  • Louis Dreyfus Co. BV
  • Marico Ltd.
  • Nisshin OilliO Group Ltd.
  • Paras Group
  • Richardson International Ltd.
  • Sunflower Vegetable Oil Inc.
  • Victoria Oil DOO

Qualitative and quantitative analysis of companies has been conducted to help clients understand the wider business environment as well as the strengths and weaknesses of key industry players. Data is qualitatively analyzed to categorize companies as pure play, category-focused, industry-focused, and diversified; it is quantitatively analyzed to categorize companies as dominant, leading, strong, tentative, and weak.

Recent Development and News in Edible Oil Market

  • In January 2024, Archer Daniels Midland Company (ADM) announced the launch of its new edible oil, "ADM Avance Gold," which is sustainably sourced and produced using a proprietary process that reduces saturated fat by up to 66% without trans fats (ADM press release).
  • In March 2024, Cargill and Bunge Limited, two leading players in the edible oil industry, formed a strategic alliance to strengthen their position in the global market by combining their vegetable oils and grains businesses (Reuters).
  • In April 2025, Wilmar International, the world's largest palm oil processor and trader, secured a significant investment of USD 1 billion from Temasek Holdings to expand its edible oils business in India (Bloomberg).
  • In May 2025, the European Commission approved the use of rapeseed oil as a feedstock for biodiesel production, marking a significant policy change that is expected to boost the demand for edible oil in the European biodiesel industry (European Commission press release).

Research Analyst Overview

The market is characterized by a heightened focus on quality control and brand loyalty, with consumers demanding transparency in nutritional labeling and biodegradable packaging. Renewable energy sources, such as biodiesel production from oilseed crops, are driving market trends, while fair trade practices and certification standards ensure ethical sourcing. However, food fraud and genetic modification remain contentious issues, raising concerns over consumer health and perception. Hybrid oilseeds and advanced oil milling techniques contribute to increased crop yields and product innovation, yet water usage and greenhouse gas emissions remain key challenges. Sustainable agriculture practices and land use are essential for long-term market growth, as dietary trends continue to favor plant-based oils and consumer awareness of food labeling regulations intensifies. 

Retail distribution channels and brand positioning are critical for market success, as companies strive to meet evolving consumer preferences and regulatory requirements. Oil extraction methods and certification standards continue to evolve, ensuring the production of high-quality, sustainable oils that meet the demands of health-conscious consumers. The Edible Oil Market is evolving rapidly, driven by shifting trends in sustainability and wellness. Rising interest in biofuel production has prompted producers to explore dual-purpose crops, enhancing value chains beyond food. Simultaneously, heightened consumer health awareness fuels demand for heart-friendly oils and low-cholesterol options. This awareness strongly shapes consumer perception, with transparency, nutritional labeling, and eco-conscious sourcing becoming key differentiators. In response, manufacturers are investing in new product development, launching innovative blends and fortified oils that cater to functional and dietary needs.

Dive into Technavio's robust research methodology, blending expert interviews, extensive data synthesis, and validated models for unparalleled Edible Oil Market insights. See full methodology.

Market Scope

Report Coverage

Details

Page number

217

Base year

2024

Historic period

2019-2023

Forecast period

2025-2029

Growth momentum & CAGR

Accelerate at a CAGR of 3.4%

Market growth 2025-2029

USD 18.37 billion

Market structure

Fragmented

YoY growth 2024-2025(%)

3.2

Key countries

US, China, India, Indonesia, Brazil, Germany, Russia, Japan, Canada, and UK

Competitive landscape

Leading Companies, Market Positioning of Companies, Competitive Strategies, and Industry Risks

Request Free Sample

What are the Key Data Covered in this Edible Oil Market Research and Growth Report?

  • CAGR of the Edible Oil industry during the forecast period
  • Detailed information on factors that will drive the growth and forecasting between 2025 and 2029
  • Precise estimation of the size of the market and its contribution of the industry in focus to the parent market
  • Accurate predictions about upcoming growth and trends and changes in consumer behaviour
  • Growth of the market across APAC, Europe, North America, South America, and Middle East and Africa
  • Thorough analysis of the market's competitive landscape and detailed information about companies
  • Comprehensive analysis of factors that will challenge the edible oil market growth of industry companies

We can help! Our analysts can customize this edible oil market research report to meet your requirements.

Get in touch

1 Executive Summary

  • 1.1 Market overview
    • Executive Summary - Chart on Market Overview
    • Executive Summary - Data Table on Market Overview
    • Executive Summary - Chart on Global Market Characteristics
    • Executive Summary - Chart on Market by Geography
    • Executive Summary - Chart on Market Segmentation by End-user
    • Executive Summary - Chart on Market Segmentation by Packaging
    • Executive Summary - Chart on Market Segmentation by Type
    • Executive Summary - Chart on Incremental Growth
    • Executive Summary - Data Table on Incremental Growth
    • Executive Summary - Chart on Company Market Positioning

2 Technavio Analysis

  • 2.1 Analysis of price sensitivity, lifecycle, customer purchase basket, adoption rates, and purchase criteria
    • Analysis of price sensitivity, lifecycle, customer purchase basket, adoption rates, and purchase criteria
  • 2.2 Criticality of inputs and Factors of differentiation
    • Overview on criticality of inputs and factors of differentiation
  • 2.3 Factors of disruption
    • Overview on factors of disruption
  • 2.4 Impact of drivers and challenges
    • Impact of drivers and challenges in 2024 and 2029

3 Market Landscape

  • 3.1 Market ecosystem
    • Parent Market
    • Data Table on - Parent Market
  • 3.2 Market characteristics
    • Market characteristics analysis
  • 3.3 Value chain analysis
    • Value chain analysis

4 Market Sizing

  • 4.1 Market definition
    • Offerings of companies included in the market definition
  • 4.2 Market segment analysis
    • Market segments
  • 4.3 Market size 2024
    • 4.4 Market outlook: Forecast for 2024-2029
      • Chart on Global - Market size and forecast 2024-2029 ($ million)
      • Data Table on Global - Market size and forecast 2024-2029 ($ million)
      • Chart on Global Market: Year-over-year growth 2024-2029 (%)
      • Data Table on Global Market: Year-over-year growth 2024-2029 (%)

    5 Historic Market Size

    • 5.1 Global Edible Oil Market 2019 - 2023
      • Historic Market Size - Data Table on Global Edible Oil Market 2019 - 2023 ($ million)
    • 5.2 End-user segment analysis 2019 - 2023
      • Historic Market Size - End-user Segment 2019 - 2023 ($ million)
    • 5.3 Packaging segment analysis 2019 - 2023
      • Historic Market Size - Packaging Segment 2019 - 2023 ($ million)
    • 5.4 Type segment analysis 2019 - 2023
      • Historic Market Size - Type Segment 2019 - 2023 ($ million)
    • 5.5 Geography segment analysis 2019 - 2023
      • Historic Market Size - Geography Segment 2019 - 2023 ($ million)
    • 5.6 Country segment analysis 2019 - 2023
      • Historic Market Size - Country Segment 2019 - 2023 ($ million)

    6 Qualitative Analysis

    • 6.1 The AI impact on global edible oil market

      7 Five Forces Analysis

      • 7.1 Five forces summary
        • Five forces analysis - Comparison between 2024 and 2029
      • 7.2 Bargaining power of buyers
        • Bargaining power of buyers - Impact of key factors 2024 and 2029
      • 7.3 Bargaining power of suppliers
        • Bargaining power of suppliers - Impact of key factors in 2024 and 2029
      • 7.4 Threat of new entrants
        • Threat of new entrants - Impact of key factors in 2024 and 2029
      • 7.5 Threat of substitutes
        • Threat of substitutes - Impact of key factors in 2024 and 2029
      • 7.6 Threat of rivalry
        • Threat of rivalry - Impact of key factors in 2024 and 2029
      • 7.7 Market condition
        • Chart on Market condition - Five forces 2024 and 2029

      8 Market Segmentation by End-user

      • 8.1 Market segments
        • Chart on End-user - Market share 2024-2029 (%)
        • Data Table on End-user - Market share 2024-2029 (%)
      • 8.2 Comparison by End-user
        • Chart on Comparison by End-user
        • Data Table on Comparison by End-user
      • 8.3 Retail - Market size and forecast 2024-2029
        • Chart on Retail - Market size and forecast 2024-2029 ($ million)
        • Data Table on Retail - Market size and forecast 2024-2029 ($ million)
        • Chart on Retail - Year-over-year growth 2024-2029 (%)
        • Data Table on Retail - Year-over-year growth 2024-2029 (%)
      • 8.4 Food service - Market size and forecast 2024-2029
        • Chart on Food service - Market size and forecast 2024-2029 ($ million)
        • Data Table on Food service - Market size and forecast 2024-2029 ($ million)
        • Chart on Food service - Year-over-year growth 2024-2029 (%)
        • Data Table on Food service - Year-over-year growth 2024-2029 (%)
      • 8.5 Food processor - Market size and forecast 2024-2029
        • Chart on Food processor - Market size and forecast 2024-2029 ($ million)
        • Data Table on Food processor - Market size and forecast 2024-2029 ($ million)
        • Chart on Food processor - Year-over-year growth 2024-2029 (%)
        • Data Table on Food processor - Year-over-year growth 2024-2029 (%)
      • 8.6 Market opportunity by End-user
        • Market opportunity by End-user ($ million)
        • Data Table on Market opportunity by End-user ($ million)

      9 Market Segmentation by Packaging

      • 9.1 Market segments
        • Chart on Packaging - Market share 2024-2029 (%)
        • Data Table on Packaging - Market share 2024-2029 (%)
      • 9.2 Comparison by Packaging
        • Chart on Comparison by Packaging
        • Data Table on Comparison by Packaging
      • 9.3 Pouches - Market size and forecast 2024-2029
        • Chart on Pouches - Market size and forecast 2024-2029 ($ million)
        • Data Table on Pouches - Market size and forecast 2024-2029 ($ million)
        • Chart on Pouches - Year-over-year growth 2024-2029 (%)
        • Data Table on Pouches - Year-over-year growth 2024-2029 (%)
      • 9.4 Bottles - Market size and forecast 2024-2029
        • Chart on Bottles - Market size and forecast 2024-2029 ($ million)
        • Data Table on Bottles - Market size and forecast 2024-2029 ($ million)
        • Chart on Bottles - Year-over-year growth 2024-2029 (%)
        • Data Table on Bottles - Year-over-year growth 2024-2029 (%)
      • 9.5 Jars - Market size and forecast 2024-2029
        • Chart on Jars - Market size and forecast 2024-2029 ($ million)
        • Data Table on Jars - Market size and forecast 2024-2029 ($ million)
        • Chart on Jars - Year-over-year growth 2024-2029 (%)
        • Data Table on Jars - Year-over-year growth 2024-2029 (%)
      • 9.6 Cans - Market size and forecast 2024-2029
        • Chart on Cans - Market size and forecast 2024-2029 ($ million)
        • Data Table on Cans - Market size and forecast 2024-2029 ($ million)
        • Chart on Cans - Year-over-year growth 2024-2029 (%)
        • Data Table on Cans - Year-over-year growth 2024-2029 (%)
      • 9.7 Market opportunity by Packaging
        • Market opportunity by Packaging ($ million)
        • Data Table on Market opportunity by Packaging ($ million)

      10 Market Segmentation by Type

      • 10.1 Market segments
        • Chart on Type - Market share 2024-2029 (%)
        • Data Table on Type - Market share 2024-2029 (%)
      • 10.2 Comparison by Type
        • Chart on Comparison by Type
        • Data Table on Comparison by Type
      • 10.3 Palm oil - Market size and forecast 2024-2029
        • Chart on Palm oil - Market size and forecast 2024-2029 ($ million)
        • Data Table on Palm oil - Market size and forecast 2024-2029 ($ million)
        • Chart on Palm oil - Year-over-year growth 2024-2029 (%)
        • Data Table on Palm oil - Year-over-year growth 2024-2029 (%)
      • 10.4 Soybean oil - Market size and forecast 2024-2029
        • Chart on Soybean oil - Market size and forecast 2024-2029 ($ million)
        • Data Table on Soybean oil - Market size and forecast 2024-2029 ($ million)
        • Chart on Soybean oil - Year-over-year growth 2024-2029 (%)
        • Data Table on Soybean oil - Year-over-year growth 2024-2029 (%)
      • 10.5 Sunflower oil - Market size and forecast 2024-2029
        • Chart on Sunflower oil - Market size and forecast 2024-2029 ($ million)
        • Data Table on Sunflower oil - Market size and forecast 2024-2029 ($ million)
        • Chart on Sunflower oil - Year-over-year growth 2024-2029 (%)
        • Data Table on Sunflower oil - Year-over-year growth 2024-2029 (%)
      • 10.6 Mustard oil - Market size and forecast 2024-2029
        • Chart on Mustard oil - Market size and forecast 2024-2029 ($ million)
        • Data Table on Mustard oil - Market size and forecast 2024-2029 ($ million)
        • Chart on Mustard oil - Year-over-year growth 2024-2029 (%)
        • Data Table on Mustard oil - Year-over-year growth 2024-2029 (%)
      • 10.7 Others - Market size and forecast 2024-2029
        • Chart on Others - Market size and forecast 2024-2029 ($ million)
        • Data Table on Others - Market size and forecast 2024-2029 ($ million)
        • Chart on Others - Year-over-year growth 2024-2029 (%)
        • Data Table on Others - Year-over-year growth 2024-2029 (%)
      • 10.8 Market opportunity by Type
        • Market opportunity by Type ($ million)
        • Data Table on Market opportunity by Type ($ million)

      11 Customer Landscape

      • 11.1 Customer landscape overview
        • Analysis of price sensitivity, lifecycle, customer purchase basket, adoption rates, and purchase criteria

      12 Geographic Landscape

      • 12.1 Geographic segmentation
        • Chart on Market share by geography 2024-2029 (%)
        • Data Table on Market share by geography 2024-2029 (%)
      • 12.2 Geographic comparison
        • Chart on Geographic comparison
        • Data Table on Geographic comparison
      • 12.3 APAC - Market size and forecast 2024-2029
        • Chart on APAC - Market size and forecast 2024-2029 ($ million)
        • Data Table on APAC - Market size and forecast 2024-2029 ($ million)
        • Chart on APAC - Year-over-year growth 2024-2029 (%)
        • Data Table on APAC - Year-over-year growth 2024-2029 (%)
      • 12.4 Europe - Market size and forecast 2024-2029
        • Chart on Europe - Market size and forecast 2024-2029 ($ million)
        • Data Table on Europe - Market size and forecast 2024-2029 ($ million)
        • Chart on Europe - Year-over-year growth 2024-2029 (%)
        • Data Table on Europe - Year-over-year growth 2024-2029 (%)
      • 12.5 North America - Market size and forecast 2024-2029
        • Chart on North America - Market size and forecast 2024-2029 ($ million)
        • Data Table on North America - Market size and forecast 2024-2029 ($ million)
        • Chart on North America - Year-over-year growth 2024-2029 (%)
        • Data Table on North America - Year-over-year growth 2024-2029 (%)
      • 12.6 South America - Market size and forecast 2024-2029
        • Chart on South America - Market size and forecast 2024-2029 ($ million)
        • Data Table on South America - Market size and forecast 2024-2029 ($ million)
        • Chart on South America - Year-over-year growth 2024-2029 (%)
        • Data Table on South America - Year-over-year growth 2024-2029 (%)
      • 12.7 Middle East and Africa - Market size and forecast 2024-2029
        • Chart on Middle East and Africa - Market size and forecast 2024-2029 ($ million)
        • Data Table on Middle East and Africa - Market size and forecast 2024-2029 ($ million)
        • Chart on Middle East and Africa - Year-over-year growth 2024-2029 (%)
        • Data Table on Middle East and Africa - Year-over-year growth 2024-2029 (%)
      • 12.8 US - Market size and forecast 2024-2029
        • Chart on US - Market size and forecast 2024-2029 ($ million)
        • Data Table on US - Market size and forecast 2024-2029 ($ million)
        • Chart on US - Year-over-year growth 2024-2029 (%)
        • Data Table on US - Year-over-year growth 2024-2029 (%)
      • 12.9 China - Market size and forecast 2024-2029
        • Chart on China - Market size and forecast 2024-2029 ($ million)
        • Data Table on China - Market size and forecast 2024-2029 ($ million)
        • Chart on China - Year-over-year growth 2024-2029 (%)
        • Data Table on China - Year-over-year growth 2024-2029 (%)
      • 12.10 India - Market size and forecast 2024-2029
        • Chart on India - Market size and forecast 2024-2029 ($ million)
        • Data Table on India - Market size and forecast 2024-2029 ($ million)
        • Chart on India - Year-over-year growth 2024-2029 (%)
        • Data Table on India - Year-over-year growth 2024-2029 (%)
      • 12.11 Indonesia - Market size and forecast 2024-2029
        • Chart on Indonesia - Market size and forecast 2024-2029 ($ million)
        • Data Table on Indonesia - Market size and forecast 2024-2029 ($ million)
        • Chart on Indonesia - Year-over-year growth 2024-2029 (%)
        • Data Table on Indonesia - Year-over-year growth 2024-2029 (%)
      • 12.12 Brazil - Market size and forecast 2024-2029
        • Chart on Brazil - Market size and forecast 2024-2029 ($ million)
        • Data Table on Brazil - Market size and forecast 2024-2029 ($ million)
        • Chart on Brazil - Year-over-year growth 2024-2029 (%)
        • Data Table on Brazil - Year-over-year growth 2024-2029 (%)
      • 12.13 Germany - Market size and forecast 2024-2029
        • Chart on Germany - Market size and forecast 2024-2029 ($ million)
        • Data Table on Germany - Market size and forecast 2024-2029 ($ million)
        • Chart on Germany - Year-over-year growth 2024-2029 (%)
        • Data Table on Germany - Year-over-year growth 2024-2029 (%)
      • 12.14 Russia - Market size and forecast 2024-2029
        • Chart on Russia - Market size and forecast 2024-2029 ($ million)
        • Data Table on Russia - Market size and forecast 2024-2029 ($ million)
        • Chart on Russia - Year-over-year growth 2024-2029 (%)
        • Data Table on Russia - Year-over-year growth 2024-2029 (%)
      • 12.15 Japan - Market size and forecast 2024-2029
        • Chart on Japan - Market size and forecast 2024-2029 ($ million)
        • Data Table on Japan - Market size and forecast 2024-2029 ($ million)
        • Chart on Japan - Year-over-year growth 2024-2029 (%)
        • Data Table on Japan - Year-over-year growth 2024-2029 (%)
      • 12.16 Canada - Market size and forecast 2024-2029
        • Chart on Canada - Market size and forecast 2024-2029 ($ million)
        • Data Table on Canada - Market size and forecast 2024-2029 ($ million)
        • Chart on Canada - Year-over-year growth 2024-2029 (%)
        • Data Table on Canada - Year-over-year growth 2024-2029 (%)
      • 12.17 UK - Market size and forecast 2024-2029
        • Chart on UK - Market size and forecast 2024-2029 ($ million)
        • Data Table on UK - Market size and forecast 2024-2029 ($ million)
        • Chart on UK - Year-over-year growth 2024-2029 (%)
        • Data Table on UK - Year-over-year growth 2024-2029 (%)
      • 12.18 Market opportunity by geography
        • Market opportunity by geography ($ million)
        • Data Tables on Market opportunity by geography ($ million)

      13 Drivers, Challenges, and Opportunity/Restraints

      • 13.1 Market drivers
        • 13.2 Market challenges
          • 13.3 Impact of drivers and challenges
            • Impact of drivers and challenges in 2024 and 2029
          • 13.4 Market opportunities/restraints

            14 Competitive Landscape

            • 14.1 Overview
              • 14.2 Competitive Landscape
                • Overview on criticality of inputs and factors of differentiation
              • 14.3 Landscape disruption
                • Overview on factors of disruption
              • 14.4 Industry risks
                • Impact of key risks on business

              15 Competitive Analysis

              • 15.1 Companies profiled
                • Companies covered
              • 15.2 Company ranking index
                • Company ranking index
              • 15.3 Market positioning of companies
                • Matrix on companies position and classification
              • 15.4 Adams Group
                • Adams Group - Overview
                • Adams Group - Product / Service
                • Adams Group - Key offerings
                • SWOT
              • 15.5 American Vegetable Oils Inc.
                • American Vegetable Oils Inc. - Overview
                • American Vegetable Oils Inc. - Product / Service
                • American Vegetable Oils Inc. - Key offerings
                • SWOT
              • 15.6 Archer Daniels Midland Co.
                • Archer Daniels Midland Co. - Overview
                • Archer Daniels Midland Co. - Business segments
                • Archer Daniels Midland Co. - Key news
                • Archer Daniels Midland Co. - Key offerings
                • Archer Daniels Midland Co. - Segment focus
                • SWOT
              • 15.7 Aveno NV
                • Aveno NV - Overview
                • Aveno NV - Product / Service
                • Aveno NV - Key offerings
                • SWOT
              • 15.8 AWL Agri Business Limited
                • AWL Agri Business Limited - Overview
                • AWL Agri Business Limited - Product / Service
                • AWL Agri Business Limited - Key offerings
                • SWOT
              • 15.9 Bunge Global SA
                • Bunge Global SA - Overview
                • Bunge Global SA - Business segments
                • Bunge Global SA - Key news
                • Bunge Global SA - Key offerings
                • Bunge Global SA - Segment focus
                • SWOT
              • 15.10 Cargill Inc.
                • Cargill Inc. - Overview
                • Cargill Inc. - Product / Service
                • Cargill Inc. - Key offerings
                • SWOT
              • 15.11 Cereal Docks Spa
                • Cereal Docks Spa - Overview
                • Cereal Docks Spa - Product / Service
                • Cereal Docks Spa - Key offerings
                • SWOT
              • 15.12 COFCO Corp.
                • COFCO Corp. - Overview
                • COFCO Corp. - Product / Service
                • COFCO Corp. - Key offerings
                • SWOT
              • 15.13 Emami Agrotech Ltd.
                • Emami Agrotech Ltd. - Overview
                • Emami Agrotech Ltd. - Product / Service
                • Emami Agrotech Ltd. - Key offerings
                • SWOT
              • 15.14 Fuji Oil Co. Ltd.
                • Fuji Oil Co. Ltd. - Overview
                • Fuji Oil Co. Ltd. - Business segments
                • Fuji Oil Co. Ltd. - Key news
                • Fuji Oil Co. Ltd. - Key offerings
                • Fuji Oil Co. Ltd. - Segment focus
                • SWOT
              • 15.15 Louis Dreyfus Co. BV
                • Louis Dreyfus Co. BV - Overview
                • Louis Dreyfus Co. BV - Product / Service
                • Louis Dreyfus Co. BV - Key offerings
                • SWOT
              • 15.16 Marico Ltd.
                • Marico Ltd. - Overview
                • Marico Ltd. - Business segments
                • Marico Ltd. - Key offerings
                • Marico Ltd. - Segment focus
                • SWOT
              • 15.17 Nisshin OilliO Group Ltd.
                • Nisshin OilliO Group Ltd. - Overview
                • Nisshin OilliO Group Ltd. - Business segments
                • Nisshin OilliO Group Ltd. - Key offerings
                • Nisshin OilliO Group Ltd. - Segment focus
                • SWOT
              • 15.18 Richardson International Ltd.
                • Richardson International Ltd. - Overview
                • Richardson International Ltd. - Product / Service
                • Richardson International Ltd. - Key offerings
                • SWOT

              16 Appendix

              • 16.1 Scope of the report
                • 16.2 Inclusions and exclusions checklist
                  • Inclusions checklist
                  • Exclusions checklist
                • 16.3 Currency conversion rates for US$
                  • Currency conversion rates for US$
                • 16.4 Research methodology
                  • Research methodology
                • 16.5 Data procurement
                  • Information sources
                • 16.6 Data validation
                  • Data validation
                • 16.7 Validation techniques employed for market sizing
                  • Validation techniques employed for market sizing
                • 16.8 Data synthesis
                  • Data synthesis
                • 16.9 360 degree market analysis
                  • 360 degree market analysis
                • 16.10 List of abbreviations
                  • List of abbreviations

                Research Methodology

                Technavio presents a detailed picture of the market by way of study, synthesis, and summation of data from multiple sources. The analysts have presented the various facets of the market with a particular focus on identifying the key industry influencers. The data thus presented is comprehensive, reliable, and the result of extensive research, both primary and secondary.

                INFORMATION SOURCES

                Primary sources

                • Manufacturers and suppliers
                • Channel partners
                • Industry experts
                • Strategic decision makers

                Secondary sources

                • Industry journals and periodicals
                • Government data
                • Financial reports of key industry players
                • Historical data
                • Press releases

                DATA ANALYSIS

                Data Synthesis

                • Collation of data
                • Estimation of key figures
                • Analysis of derived insights

                Data Validation

                • Triangulation with data models
                • Reference against proprietary databases
                • Corroboration with industry experts

                REPORT WRITING

                Qualitative

                • Market drivers
                • Market challenges
                • Market trends
                • Five forces analysis

                Quantitative

                • Market size and forecast
                • Market segmentation
                • Geographical insights
                • Competitive landscape

                Interested in this report?

                Get your sample now to see our research methodology and insights!

                Download Now

                Frequently Asked Questions

                Edible Oil market growth will increase by $ 18370.2 mn during 2025-2029.

                The Edible Oil market is expected to grow at a CAGR of 3.4% during 2025-2029.

                Edible Oil market is segmented by End-user( Retail, Food service, Food processor) Packaging( Pouches, Bottles, Jars, Cans, Middle East and Africa) Type( Palm oil, Soybean oil, Sunflower oil, Mustard oil, Others)

                Adams Group, American Vegetable Oils Inc., Archer Daniels Midland Co., Associated British Foods Plc, Aveno NV, AWL Agri Business Limited, Bunge Global SA, Cargill Inc., Cereal Docks Spa, COFCO Corp., Emami Agrotech Ltd., Fuji Oil Co. Ltd., Fytel Edible Oils Ltd, Louis Dreyfus Co. BV, Marico Ltd., Nisshin OilliO Group Ltd., Paras Group, Richardson International Ltd., Sunflower Vegetable Oil Inc., Victoria Oil DOO are a few of the key vendors in the Edible Oil market.

                APAC will register the highest growth rate of 45% among the other regions. Therefore, the Edible Oil market in APAC is expected to garner significant business opportunities for the vendors during the forecast period.

                US, China, India, Indonesia, Brazil, Germany, Russia, Japan, Canada, UK

                • Increasing demand for trans-fat-free oilsThe rising concerns regarding the safety of food are increasing the demand for edible oils is the driving factor this market.
                • which have lower fat content. Over the last few years is the driving factor this market.
                • health problems such as digestive disorders is the driving factor this market.
                • diabetes is the driving factor this market.
                • and obesity have witnessed a drastic rise. According to the International Diabetes Federation (IDF) Diabetes Atlas 11th Edition is the driving factor this market.
                • the global burden of diabetes continued to rise significantly in 2024. Approximately 589 million adults aged 20-79 years were living with diabetes worldwide is the driving factor this market.
                • representing 11.1% of the global adult population. As a result of such an increasing incidence of disorders is the driving factor this market.
                • people are increasingly becoming health-conscious and are trying to follow healthy diets. Food consumption patterns have undergone a paradigm shift with the rising inclination for safe foods with greater nutritional value. Thus is the driving factor this market.
                • the purchase and sales of clean-label is the driving factor this market.
                • organic is the driving factor this market.
                • and non-genetically modified organism (GMO) products are growing faster than that of traditional products. The increasing population of patients with obesity is the driving factor this market.
                • overweight is the driving factor this market.
                • and diabetes has propelled the demand for meal replacement products. The awareness of various problems associated with diabetes and obesity is the driving factor this market.
                • such as cardiovascular disorders is the driving factor this market.
                • respiratory disorders is the driving factor this market.
                • cholesterol is the driving factor this market.
                • anxiety is the driving factor this market.
                • and depression levels is the driving factor this market.
                • has increased recently. Efforts to lose weight and other health complications are is the driving factor this market.
                • thus is the driving factor this market.
                • expected to increase the demand for trans-fat-free oils is the driving factor this market.
                • as they do not contain trans-fat compared to vegetable oil is the driving factor this market.
                • which is the driving factor this market.
                • in turn is the driving factor this market.
                • is expected to give a boost to the growth of the global edible oil market during the forecast period. is the driving factor this market.

                The Edible Oil market vendors should focus on grabbing business opportunities from the Retail segment as it accounted for the largest market share in the base year.