Electronic Waste Recycling Market Analysis, Size, and Forecast 2025-2029: North America (US and Canada), Europe (France, Germany, and UK), Middle East and Africa (UAE), APAC (China, India, and Japan), South America (Brazil), and Rest of World (ROW)

Electronic Waste Recycling Market Analysis, Size, and Forecast 2025-2029:
North America (US and Canada), Europe (France, Germany, and UK), Middle East and Africa (UAE), APAC (China, India, and Japan), South America (Brazil), and Rest of World (ROW)

Published: Jul 2025 227 Pages SKU: IRTNTR76167

Market Overview at a Glance

$32.74 B
Market Opportunity
21.6%
CAGR
16.7
YoY growth 2024-2025(%)

Electronic Waste Recycling Market Size 2025-2029

The electronic waste recycling market size is forecast to increase by USD 32.74 billion at a CAGR of 21.6% between 2024 and 2029.

  • The market is driven by stringent government regulations mandating proper e-waste management. These regulations aim to mitigate the environmental and health risks associated with the improper disposal of electronic waste. Furthermore, the increasing number of mergers and acquisitions among market companies signifies a consolidating industry, with companies seeking to expand their market presence and enhance their capabilities. However, a significant challenge facing the market is the lack of awareness about proper methods of e-waste segregation. Battery recycling and CRT recycling are essential sub-segments, given the hazardous nature of these materials.
  • Companies in this market must navigate these challenges by investing in public awareness campaigns and developing innovative solutions for e-waste segregation and recycling to capitalize on the growing demand for sustainable waste management practices. This obstacle hampers the effective collection and recycling of e-waste, limiting the potential for value recovery and sustainable disposal solutions.

What will be the Size of the Electronic Waste Recycling Market during the forecast period?

Electronic Waste Recycling Market Size

 Explore in-depth regional segment analysis with market size data - historical 2019-2023 and forecasts 2025-2029 - in the full report.  
Request Free Sample

The electronic waste (e-waste) recycling market is characterized by continuous innovation in recycling processes, ensuring the safe dismantling of e-waste while adhering to occupational safety standards. Metal refining and material separation technologies, such as pre-treatment processes and plastic granulation, play a crucial role in the efficient extraction of precious metals. National e-waste policies and sustainability reporting are driving the industry towards greater environmental stewardship, with post-treatment processes and energy recovery becoming increasingly important. Quality assurance and recycling certifications are essential for maintaining industry best practices and stakeholder engagement.

Data analytics and waste characterization facilitate policy analysis and recycling economics, while environmental remediation and recycling facility optimization ensure regulatory compliance. Public awareness campaigns and waste classification efforts contribute to the overall success of the market, with a focus on circular economy principles and circular business models.

How is this Electronic Waste Recycling Industry segmented?

The electronic waste recycling industry research report provides comprehensive data (region-wise segment analysis), with forecasts and estimates in "USD million" for the period 2025-2029, as well as historical data from 2019-2023 for the following segments.

  • Material
    • Metals and chemicals
    • Plastic
    • Glass
  • Source
    • Household appliances
    • Entertainment and consumer electronics
    • IT and telecom
    • Medical equipment
    • Others
  • Method
    • Mechanical recycling
    • Pyrolysis
    • Others
  • Geography
    • North America
      • US
      • Canada
    • Europe
      • France
      • Germany
      • UK
    • Middle East and Africa
      • UAE
    • APAC
      • China
      • India
      • Japan
    • South America
      • Brazil
    • Rest of World (ROW)

By Material Insights

The Metals and chemicals segment is estimated to witness significant growth during the forecast period. The market is driven by various entities and trends. The metals and chemicals segment, a significant component, focuses on recovering valuable metals like gold, silver, and copper, as well as safely disposing of hazardous materials. This segment's dominance is due to the economic incentive of extracting and reusing precious metals, essential for electronic manufacturing given the limited natural resources. Regulations mandate proper disposal and recycling of toxic substances to mitigate environmental and health risks. IoT technology integration in recycling processes enhances efficiency and accuracy, while AI and big data analytics facilitate material identification and sorting. Producer responsibility schemes promote take-back programs, ensuring compliance with waste management regulations.

Sustainable practices, such as plastics recycling and circular economy principles, reduce the carbon footprint and promote resource recovery. Recycling technologies, including sorting and shredding, treatment, and processing equipment, enable the recovery of various components, such as CRT glass, batteries, and precious metals. Quality control measures, including manual sorting and automated sorting, ensure the highest standards. Reverse logistics and material flow analysis optimize the supply chain, ensuring efficient e-waste collection and transportation. Data sanitization and security are crucial in the recycling process to protect consumer privacy. Life cycle assessment and environmental impact assessment ensure the sustainability and eco-friendliness of recycling processes.

Regulatory compliance and e-waste tracking systems maintain transparency and accountability. E-waste collection centers play a vital role in the recycling process, ensuring the efficient and responsible disposal of electronic waste. Material identification and recovery technologies enable the recycling of various components, including PCBs and components. The recycling industry's economic viability is crucial for its growth, with recycling rates continuing to increase as technology advances and consumer awareness grows. Waste reduction strategies and hazardous waste management practices ensure the industry's long-term sustainability.

Electronic Waste Recycling Market Size

 Download Free Sample Report

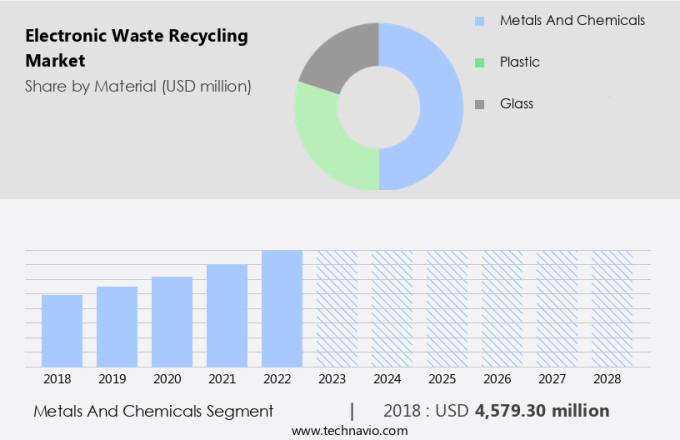
The Metals and chemicals segment was valued at USD 5.12 billion in 2019 and showed a gradual increase during the forecast period.

The Electronic Waste Recycling Market is undergoing a significant shift driven by innovations in AI in recycling and IoT in recycling. These technologies enhance the efficiency and accuracy of sorting, dismantling, and processing e-waste, enabling smarter material recovery. A key focus area is PCB recycling, which extracts valuable metals like gold and copper from discarded electronics, addressing both environmental and economic concerns. Another critical driver is Extended Producer Responsibility (EPR), which mandates manufacturers to take accountability for the end-of-life management of their products.

The Electronic Waste Recycling Market is becoming increasingly sophisticated as demand grows for sustainable solutions. Key operations include ewaste dismantling, circuit board separation, and precious metal extraction, which recover valuable materials while minimizing environmental harm. Advanced recycling facility design enables streamlined workflows and improved process control, ensuring consistent output and operational efficiency. Compliance with environmental standards and health and safety regulations is critical, protecting both ecosystems and workers. Effective employee training supports safe handling of hazardous components and maximizes recovery rates. According to recent global ewaste statistics, the world generated over 50 million metric tons of e-waste annually, with only a fraction properly recycled.

Regional Analysis

Europe is estimated to contribute 41% to the growth of the global market during the forecast period. Technavio's analysts have elaborately explained the regional trends and drivers that shape the market during the forecast period.

Electronic Waste Recycling Market Share by Geography

View Free PDF Sample

In the dynamic market, key players include Germany, the UK, and France, driven by their significant generation of e-waste due to high consumer electronics, appliance, and medical equipment usage. Regulations such as the EU WEEE Directive ensure safe and responsible e-waste management, mandating collection, recycling, and recovery procedures. Strict laws prohibit the export of hazardous e-waste to non-OECD countries. Recycling infrastructure integrates metals recycling, IoT, AI, and treatment technologies, adhering to compliance standards and material identification for economic viability. Supply chain management, e-waste collection, and sorting systems facilitate material recovery, waste reduction strategies, and regulatory compliance.

Recycling plants employ processing equipment for precious metal recovery, data security, and consumer awareness. Circular economy principles drive battery recycling, plastics recycling, and component recovery through sustainable practices and reverse logistics. Material flow analysis and e-waste audits employ automated sorting and e-waste segregation for hazardous waste management and recycling rates tracking. E-waste encompasses electronic equipment, PCBs, and CRTs, with recycling technologies addressing their unique challenges. Regulatory compliance, carbon footprint reduction, and waste reduction strategies are crucial for market growth.

Market Dynamics

Our researchers analyzed the data with 2024 as the base year, along with the key drivers, trends, and challenges. A holistic analysis of drivers will help companies refine their marketing strategies to gain a competitive advantage.

What are the Electronic Waste Recycling market drivers leading to the rise in the adoption of Industry?

  • Strict government regulations mandate effective e-waste management, serving as the primary market driver. E-waste management regulations play a crucial role in ensuring the sustainable disposal and recycling of electronic waste. Governments worldwide have established guidelines to prevent the harmful effects of e-waste on the environment and human health. For instance, the Indian Ministry of Environment, Forest, and Climate Change (MOEFCC) has outlined procedures for e-waste management. The e-waste lifecycle encompasses several stages, including prevention, minimization, reuse, recycling, recovery, and co-processing or safe disposal. All entities handling e-waste, such as collectors, processors, and disposers, must adhere to these regulations and obtain authorization from their respective State Pollution Control Boards within 90 days of publication.
  • Recycling processes involve sorting, shredding, and employing recycling technologies like material recovery and resource recovery. Plastics recycling and CRT recycling are essential components of e-waste recycling. Big data analytics can optimize these processes, making them more efficient and cost-effective. Sustainable practices are essential in e-waste recycling. They minimize the environmental impact and promote a circular economy. Compliance with these regulations and sustainable practices is not only a legal requirement but also a responsible business decision.

What are the Electronic Waste Recycling market trends shaping the Industry?

  • The trend in the market is marked by an escalating number of mergers and acquisitions among companies. This phenomenon is a reflection of the dynamic business landscape and the continuous pursuit of growth and competitiveness. The market is gaining significant traction as businesses embrace the circular economy and strive for waste reduction strategies. Battery recycling is a key focus area, with companies investing in material flow analysis, quality control, and processing equipment for precise recovery of precious metals. Reverse logistics plays a crucial role in the collection and transportation of e-waste to certified collection centers. Quality control is paramount in this industry, with manual sorting and data security measures ensuring the safe handling of sensitive consumer data.
  • These strategies enable companies to expand their operations, strengthen product offerings, and cater to diverse end-users. For instance, in a notable instance, Waste Management acquired Stericycle, a medical waste services provider, for USD7.8 billion in 2024. This acquisition broadened Waste Management's service offerings and allowed entry into new markets, underscoring the strategic importance of mergers and acquisitions in the waste management sector. Overall, the market is poised for growth, driven by a commitment to sustainability, innovation, and a growing consumer awareness of the importance of responsible e-waste disposal. Market dynamics are shaped by various growth strategies, including acquisitions, partnerships, and collaborations. Carbon footprint reduction is another priority, with companies implementing efficient processing techniques and optimizing supply chains.

How does Electronic Waste Recycling market face challenges during its growth?

  • The absence of knowledge regarding appropriate e-waste sorting techniques poses a significant challenge to the expansion of the industry. Electronic waste (e-waste) recycling is a critical issue that requires proper assessment and management due to its potential environmental and health risks. The improper disposal of e-waste through methods such as open-air burning and acid baths can lead to significant health hazards for workers. These practices can expose them to toxic substances like lead, mercury, cadmium, and arsenic, which can result in irreversible health effects, including cancer, neurological damage, and developmental issues in children. Moreover, inappropriate waste collection and unscientific treatment of e-waste can lead to toxic materials leaching into groundwater, threatening the environment and human health. Ethical concerns, such as the dumping of e-waste in developing countries, further complicate the issue.
  • To mitigate these risks, it's essential to implement effective e-waste management strategies. These include e-waste audits, environmental impact assessments, and proper segregation of e-waste through automated sorting processes. Proper hazardous waste management practices and recycling rates are also crucial to minimize the environmental impact. Effective e-waste tracking systems and component recovery techniques can maximize the value of recycled materials while minimizing the risks. Logistics and transportation play a significant role in ensuring the safe and efficient collection and transportation of e-waste to recycling facilities. By adopting these practices, businesses and individuals can contribute to a more sustainable and responsible approach to electronic waste recycling.

Exclusive Customer Landscape

The electronic waste recycling market forecasting report includes the adoption lifecycle of the market, covering from the innovator's stage to the laggard's stage. It focuses on adoption rates in different regions based on penetration. Furthermore, the electronic waste recycling market report also includes key purchase criteria and drivers of price sensitivity to help companies evaluate and develop their market growth analysis strategies.

Electronic Waste Recycling Market Share by Geography

 Customer Landscape

Key Companies & Market Insights

Companies are implementing various strategies, such as strategic alliances, electronic waste recycling market forecast, partnerships, mergers and acquisitions, geographical expansion, and product/service launches, to enhance their presence in the industry.

ALBA Group Plc and Co. KG - The company specializes in the sustainable recycling of electronic waste, processing discarded electrical and electronic scrap through eco-friendly methods to extract valuable resources, including copper and precious metals.

The industry research and growth report includes detailed analyses of the competitive landscape of the market and information about key companies, including:

  • ALBA Group Plc and Co. KG
  • Aurubis AG
  • Boliden Group
  • CIMELIA RESOURCE RECOVERY PTE LTD.
  • E Parisaraa Pvt. Ltd.
  • Egyptian Electronics Recycling Co.
  • Electrocycling GmbH
  • Electronic Recyclers International Inc.
  • Global Ewaste Solutions
  • Good Point Recycling
  • Kuusakoski Oy
  • MBA Polymers Inc.
  • Sembcorp Industries Ltd.
  • Sims Ltd.
  • Stena Metall Group
  • TES Singapore Pte Ltd.
  • Tetronics
  • Umicore SA
  • Veolia Environnement SA
  • Waste Management Inc.

Qualitative and quantitative analysis of companies has been conducted to help clients understand the wider business environment as well as the strengths and weaknesses of key industry players. Data is qualitatively analyzed to categorize companies as pure play, category-focused, industry-focused, and diversified; it is quantitatively analyzed to categorize companies as dominant, leading, strong, tentative, and weak.

Recent Development and News in Electronic Waste Recycling Market

  • In January 2024, global technology giant Apple announced a significant expansion of its recycling program, committing to collect and recycle 10 million metric tons of rare earth elements from discarded electronics by 2030 (Apple Press Info). This initiative underscores Apple's commitment to reducing its carbon footprint and contributing to the circular economy.
  • In March 2024, leading recycling companies, Shred-It and Sims Limited, formed a strategic partnership to enhance their electronic waste recycling capabilities (BusinessWire). The collaboration aimed to improve the collection, processing, and disposal of e-waste, addressing the growing concern over the environmental impact of discarded electronics.
  • In May 2024, the European Union passed the Waste Electrical and Electronic Equipment (WEEE) Directive 3 update, which mandated a 65% collection rate for e-waste by 2026 (EU Official Journal). This regulatory push encouraged companies to invest in advanced recycling technologies and expand their recycling capacities to meet the new targets.
  • In April 2025, tech giants Google and Microsoft joined forces to invest USD150 million in Redwood Materials, a startup focused on recycling lithium-ion batteries from discarded electronics (Bloomberg). This strategic investment aimed to support the development of cost-effective and sustainable recycling technologies, addressing the growing demand for battery recycling and reducing the environmental impact of e-waste.

Research Analyst Overview

The market continues to evolve, driven by the constant advancement of technology and the increasing importance of circular economy principles. Metals recycling plays a significant role in this sector, with IoT technology facilitating more efficient and effective recycling processes. Producer responsibility and regulatory compliance are key factors shaping the market, as companies strive to meet compliance standards and reduce their carbon footprint. E-waste collection and material identification are crucial aspects of the recycling process, with sorting systems and manual sorting techniques employed to ensure the proper separation of valuable materials. Reverse logistics and material flow analysis are essential components of an efficient recycling infrastructure, enabling the optimization of supply chain management and resource recovery.

Processing equipment, such as shredders and sorting machines, are continually evolving to improve material recovery rates and reduce waste. Precious metal recovery and data security are major concerns, with advanced treatment technologies and data sanitization methods being developed to address these challenges. Battery recycling is a growing subsector of the market, with increasing focus on sustainable practices and waste reduction strategies. Regulatory compliance and life cycle assessment are essential considerations in this area, as is the implementation of take-back programs and component recovery. The recycling industry is also adopting big data analytics and automation to enhance sorting and segregation processes, improve material identification, and streamline logistics and transportation.

However, hazardous waste management remains a significant challenge, with ongoing research and development efforts focused on developing more effective and sustainable recycling processes for CRTs, PCBs, and other hazardous materials. The market is a dynamic and evolving sector, with ongoing activities and unfolding patterns shaping its future. Circular economy principles, battery recycling, quality control, manual sorting, reverse logistics, material flow analysis, collection centers, carbon footprint, waste reduction strategies, processing equipment, precious metal recovery, data security, consumer awareness, environmental impact assessment, and regulatory compliance are all integral components of this complex and ever-changing landscape.

Dive into Technavio's robust research methodology, blending expert interviews, extensive data synthesis, and validated models for unparalleled Electronic Waste Recycling Market insights. See full methodology.

Market Scope

Report Coverage

Details

Page number

227

Base year

2024

Historic period

2019-2023

Forecast period

2025-2029

Growth momentum & CAGR

Accelerate at a CAGR of 21.6%

Market growth 2025-2029

USD 32.74 billion

Market structure

Fragmented

YoY growth 2024-2025(%)

16.7

Key countries

China, US, Japan, UK, Canada, France, India, Brazil, Germany, and UAE

Competitive landscape

Leading Companies, Market Positioning of Companies, Competitive Strategies, and Industry Risks

Request Free Sample

What are the Key Data Covered in this Electronic Waste Recycling Market Research and Growth Report?

  • CAGR of the Electronic Waste Recycling industry during the forecast period
  • Detailed information on factors that will drive the growth and forecasting between 2025 and 2029
  • Precise estimation of the size of the market and its contribution of the industry in focus to the parent market
  • Accurate predictions about upcoming growth and trends and changes in consumer behaviour
  • Growth of the market across Europe, APAC, North America, South America, and Middle East and Africa
  • Thorough analysis of the market's competitive landscape and detailed information about companies
  • Comprehensive analysis of factors that will challenge the electronic waste recycling market growth of industry companies

We can help! Our analysts can customize this electronic waste recycling market research report to meet your requirements.

Get in touch

1 Executive Summary

  • 1.1 Market overview
    • Executive Summary - Chart on Market Overview
    • Executive Summary - Data Table on Market Overview
    • Executive Summary - Chart on Global Market Characteristics
    • Executive Summary - Chart on Market by Geography
    • Executive Summary - Chart on Market Segmentation by Material
    • Executive Summary - Chart on Market Segmentation by Source
    • Executive Summary - Chart on Market Segmentation by Method
    • Executive Summary - Chart on Incremental Growth
    • Executive Summary - Data Table on Incremental Growth
    • Executive Summary - Chart on Company Market Positioning

2 Technavio Analysis

  • 2.1 Analysis of price sensitivity, lifecycle, customer purchase basket, adoption rates, and purchase criteria
    • Analysis of price sensitivity, lifecycle, customer purchase basket, adoption rates, and purchase criteria
  • 2.2 Criticality of inputs and Factors of differentiation
    • Overview on criticality of inputs and factors of differentiation
  • 2.3 Factors of disruption
    • Overview on factors of disruption
  • 2.4 Impact of drivers and challenges
    • Impact of drivers and challenges in 2024 and 2029

3 Market Landscape

  • 3.1 Market ecosystem
    • Parent Market
    • Data Table on - Parent Market
  • 3.2 Market characteristics
    • Market characteristics analysis
  • 3.3 Value chain analysis
    • Value chain analysis

4 Market Sizing

  • 4.1 Market definition
    • Offerings of companies included in the market definition
  • 4.2 Market segment analysis
    • Market segments
  • 4.3 Market size 2024
    • 4.4 Market outlook: Forecast for 2024-2029
      • Chart on Global - Market size and forecast 2024-2029 ($ million)
      • Data Table on Global - Market size and forecast 2024-2029 ($ million)
      • Chart on Global Market: Year-over-year growth 2024-2029 (%)
      • Data Table on Global Market: Year-over-year growth 2024-2029 (%)

    5 Historic Market Size

    • 5.1 Global Electronic Waste Recycling Market 2019 - 2023
      • Historic Market Size - Data Table on Global Electronic Waste Recycling Market 2019 - 2023 ($ million)
    • 5.2 Material segment analysis 2019 - 2023
      • Historic Market Size - Material Segment 2019 - 2023 ($ million)
    • 5.3 Source segment analysis 2019 - 2023
      • Historic Market Size - Source Segment 2019 - 2023 ($ million)
    • 5.4 Method segment analysis 2019 - 2023
      • Historic Market Size - Method Segment 2019 - 2023 ($ million)
    • 5.5 Geography segment analysis 2019 - 2023
      • Historic Market Size - Geography Segment 2019 - 2023 ($ million)
    • 5.6 Country segment analysis 2019 - 2023
      • Historic Market Size - Country Segment 2019 - 2023 ($ million)

    6 Qualitative Analysis

    • 6.1 The AI impact on Global Electronic Waste Recycling Market

      7 Five Forces Analysis

      • 7.1 Five forces summary
        • Five forces analysis - Comparison between 2024 and 2029
      • 7.2 Bargaining power of buyers
        • Bargaining power of buyers - Impact of key factors 2024 and 2029
      • 7.3 Bargaining power of suppliers
        • Bargaining power of suppliers - Impact of key factors in 2024 and 2029
      • 7.4 Threat of new entrants
        • Threat of new entrants - Impact of key factors in 2024 and 2029
      • 7.5 Threat of substitutes
        • Threat of substitutes - Impact of key factors in 2024 and 2029
      • 7.6 Threat of rivalry
        • Threat of rivalry - Impact of key factors in 2024 and 2029
      • 7.7 Market condition
        • Chart on Market condition - Five forces 2024 and 2029

      8 Market Segmentation by Material

      • 8.1 Market segments
        • Chart on Material - Market share 2024-2029 (%)
        • Data Table on Material - Market share 2024-2029 (%)
      • 8.2 Comparison by Material
        • Chart on Comparison by Material
        • Data Table on Comparison by Material
      • 8.3 Metals and chemicals - Market size and forecast 2024-2029
        • Chart on Metals and chemicals - Market size and forecast 2024-2029 ($ million)
        • Data Table on Metals and chemicals - Market size and forecast 2024-2029 ($ million)
        • Chart on Metals and chemicals - Year-over-year growth 2024-2029 (%)
        • Data Table on Metals and chemicals - Year-over-year growth 2024-2029 (%)
      • 8.4 Plastic - Market size and forecast 2024-2029
        • Chart on Plastic - Market size and forecast 2024-2029 ($ million)
        • Data Table on Plastic - Market size and forecast 2024-2029 ($ million)
        • Chart on Plastic - Year-over-year growth 2024-2029 (%)
        • Data Table on Plastic - Year-over-year growth 2024-2029 (%)
      • 8.5 Glass - Market size and forecast 2024-2029
        • Chart on Glass - Market size and forecast 2024-2029 ($ million)
        • Data Table on Glass - Market size and forecast 2024-2029 ($ million)
        • Chart on Glass - Year-over-year growth 2024-2029 (%)
        • Data Table on Glass - Year-over-year growth 2024-2029 (%)
      • 8.6 Market opportunity by Material
        • Market opportunity by Material ($ million)
        • Data Table on Market opportunity by Material ($ million)

      9 Market Segmentation by Source

      • 9.1 Market segments
        • Chart on Source - Market share 2024-2029 (%)
        • Data Table on Source - Market share 2024-2029 (%)
      • 9.2 Comparison by Source
        • Chart on Comparison by Source
        • Data Table on Comparison by Source
      • 9.3 Household appliances - Market size and forecast 2024-2029
        • Chart on Household appliances - Market size and forecast 2024-2029 ($ million)
        • Data Table on Household appliances - Market size and forecast 2024-2029 ($ million)
        • Chart on Household appliances - Year-over-year growth 2024-2029 (%)
        • Data Table on Household appliances - Year-over-year growth 2024-2029 (%)
      • 9.4 Entertainment and consumer electronics - Market size and forecast 2024-2029
        • Chart on Entertainment and consumer electronics - Market size and forecast 2024-2029 ($ million)
        • Data Table on Entertainment and consumer electronics - Market size and forecast 2024-2029 ($ million)
        • Chart on Entertainment and consumer electronics - Year-over-year growth 2024-2029 (%)
        • Data Table on Entertainment and consumer electronics - Year-over-year growth 2024-2029 (%)
      • 9.5 IT and telecom - Market size and forecast 2024-2029
        • Chart on IT and telecom - Market size and forecast 2024-2029 ($ million)
        • Data Table on IT and telecom - Market size and forecast 2024-2029 ($ million)
        • Chart on IT and telecom - Year-over-year growth 2024-2029 (%)
        • Data Table on IT and telecom - Year-over-year growth 2024-2029 (%)
      • 9.6 Medical equipment - Market size and forecast 2024-2029
        • Chart on Medical equipment - Market size and forecast 2024-2029 ($ million)
        • Data Table on Medical equipment - Market size and forecast 2024-2029 ($ million)
        • Chart on Medical equipment - Year-over-year growth 2024-2029 (%)
        • Data Table on Medical equipment - Year-over-year growth 2024-2029 (%)
      • 9.7 Others - Market size and forecast 2024-2029
        • Chart on Others - Market size and forecast 2024-2029 ($ million)
        • Data Table on Others - Market size and forecast 2024-2029 ($ million)
        • Chart on Others - Year-over-year growth 2024-2029 (%)
        • Data Table on Others - Year-over-year growth 2024-2029 (%)
      • 9.8 Market opportunity by Source
        • Market opportunity by Source ($ million)
        • Data Table on Market opportunity by Source ($ million)

      10 Market Segmentation by Method

      • 10.1 Market segments
        • Chart on Method - Market share 2024-2029 (%)
        • Data Table on Method - Market share 2024-2029 (%)
      • 10.2 Comparison by Method
        • Chart on Comparison by Method
        • Data Table on Comparison by Method
      • 10.3 Mechanical recycling - Market size and forecast 2024-2029
        • Chart on Mechanical recycling - Market size and forecast 2024-2029 ($ million)
        • Data Table on Mechanical recycling - Market size and forecast 2024-2029 ($ million)
        • Chart on Mechanical recycling - Year-over-year growth 2024-2029 (%)
        • Data Table on Mechanical recycling - Year-over-year growth 2024-2029 (%)
      • 10.4 Pyrolysis - Market size and forecast 2024-2029
        • Chart on Pyrolysis - Market size and forecast 2024-2029 ($ million)
        • Data Table on Pyrolysis - Market size and forecast 2024-2029 ($ million)
        • Chart on Pyrolysis - Year-over-year growth 2024-2029 (%)
        • Data Table on Pyrolysis - Year-over-year growth 2024-2029 (%)
      • 10.5 Others - Market size and forecast 2024-2029
        • Chart on Others - Market size and forecast 2024-2029 ($ million)
        • Data Table on Others - Market size and forecast 2024-2029 ($ million)
        • Chart on Others - Year-over-year growth 2024-2029 (%)
        • Data Table on Others - Year-over-year growth 2024-2029 (%)
      • 10.6 Market opportunity by Method
        • Market opportunity by Method ($ million)
        • Data Table on Market opportunity by Method ($ million)

      11 Customer Landscape

      • 11.1 Customer landscape overview
        • Analysis of price sensitivity, lifecycle, customer purchase basket, adoption rates, and purchase criteria

      12 Geographic Landscape

      • 12.1 Geographic segmentation
        • Chart on Market share by geography 2024-2029 (%)
        • Data Table on Market share by geography 2024-2029 (%)
      • 12.2 Geographic comparison
        • Chart on Geographic comparison
        • Data Table on Geographic comparison
      • 12.3 Europe - Market size and forecast 2024-2029
        • Chart on Europe - Market size and forecast 2024-2029 ($ million)
        • Data Table on Europe - Market size and forecast 2024-2029 ($ million)
        • Chart on Europe - Year-over-year growth 2024-2029 (%)
        • Data Table on Europe - Year-over-year growth 2024-2029 (%)
      • 12.4 APAC - Market size and forecast 2024-2029
        • Chart on APAC - Market size and forecast 2024-2029 ($ million)
        • Data Table on APAC - Market size and forecast 2024-2029 ($ million)
        • Chart on APAC - Year-over-year growth 2024-2029 (%)
        • Data Table on APAC - Year-over-year growth 2024-2029 (%)
      • 12.5 North America - Market size and forecast 2024-2029
        • Chart on North America - Market size and forecast 2024-2029 ($ million)
        • Data Table on North America - Market size and forecast 2024-2029 ($ million)
        • Chart on North America - Year-over-year growth 2024-2029 (%)
        • Data Table on North America - Year-over-year growth 2024-2029 (%)
      • 12.6 South America - Market size and forecast 2024-2029
        • Chart on South America - Market size and forecast 2024-2029 ($ million)
        • Data Table on South America - Market size and forecast 2024-2029 ($ million)
        • Chart on South America - Year-over-year growth 2024-2029 (%)
        • Data Table on South America - Year-over-year growth 2024-2029 (%)
      • 12.7 Middle East and Africa - Market size and forecast 2024-2029
        • Chart on Middle East and Africa - Market size and forecast 2024-2029 ($ million)
        • Data Table on Middle East and Africa - Market size and forecast 2024-2029 ($ million)
        • Chart on Middle East and Africa - Year-over-year growth 2024-2029 (%)
        • Data Table on Middle East and Africa - Year-over-year growth 2024-2029 (%)
      • 12.8 China - Market size and forecast 2024-2029
        • Chart on China - Market size and forecast 2024-2029 ($ million)
        • Data Table on China - Market size and forecast 2024-2029 ($ million)
        • Chart on China - Year-over-year growth 2024-2029 (%)
        • Data Table on China - Year-over-year growth 2024-2029 (%)
      • 12.9 US - Market size and forecast 2024-2029
        • Chart on US - Market size and forecast 2024-2029 ($ million)
        • Data Table on US - Market size and forecast 2024-2029 ($ million)
        • Chart on US - Year-over-year growth 2024-2029 (%)
        • Data Table on US - Year-over-year growth 2024-2029 (%)
      • 12.10 Japan - Market size and forecast 2024-2029
        • Chart on Japan - Market size and forecast 2024-2029 ($ million)
        • Data Table on Japan - Market size and forecast 2024-2029 ($ million)
        • Chart on Japan - Year-over-year growth 2024-2029 (%)
        • Data Table on Japan - Year-over-year growth 2024-2029 (%)
      • 12.11 UK - Market size and forecast 2024-2029
        • Chart on UK - Market size and forecast 2024-2029 ($ million)
        • Data Table on UK - Market size and forecast 2024-2029 ($ million)
        • Chart on UK - Year-over-year growth 2024-2029 (%)
        • Data Table on UK - Year-over-year growth 2024-2029 (%)
      • 12.12 Canada - Market size and forecast 2024-2029
        • Chart on Canada - Market size and forecast 2024-2029 ($ million)
        • Data Table on Canada - Market size and forecast 2024-2029 ($ million)
        • Chart on Canada - Year-over-year growth 2024-2029 (%)
        • Data Table on Canada - Year-over-year growth 2024-2029 (%)
      • 12.13 France - Market size and forecast 2024-2029
        • Chart on France - Market size and forecast 2024-2029 ($ million)
        • Data Table on France - Market size and forecast 2024-2029 ($ million)
        • Chart on France - Year-over-year growth 2024-2029 (%)
        • Data Table on France - Year-over-year growth 2024-2029 (%)
      • 12.14 India - Market size and forecast 2024-2029
        • Chart on India - Market size and forecast 2024-2029 ($ million)
        • Data Table on India - Market size and forecast 2024-2029 ($ million)
        • Chart on India - Year-over-year growth 2024-2029 (%)
        • Data Table on India - Year-over-year growth 2024-2029 (%)
      • 12.15 Brazil - Market size and forecast 2024-2029
        • Chart on Brazil - Market size and forecast 2024-2029 ($ million)
        • Data Table on Brazil - Market size and forecast 2024-2029 ($ million)
        • Chart on Brazil - Year-over-year growth 2024-2029 (%)
        • Data Table on Brazil - Year-over-year growth 2024-2029 (%)
      • 12.16 Germany - Market size and forecast 2024-2029
        • Chart on Germany - Market size and forecast 2024-2029 ($ million)
        • Data Table on Germany - Market size and forecast 2024-2029 ($ million)
        • Chart on Germany - Year-over-year growth 2024-2029 (%)
        • Data Table on Germany - Year-over-year growth 2024-2029 (%)
      • 12.17 UAE - Market size and forecast 2024-2029
        • Chart on UAE - Market size and forecast 2024-2029 ($ million)
        • Data Table on UAE - Market size and forecast 2024-2029 ($ million)
        • Chart on UAE - Year-over-year growth 2024-2029 (%)
        • Data Table on UAE - Year-over-year growth 2024-2029 (%)
      • 12.18 Market opportunity by geography
        • Market opportunity by geography ($ million)
        • Data Tables on Market opportunity by geography ($ million)

      13 Drivers, Challenges, and Opportunity/Restraints

      • 13.1 Market drivers
        • 13.2 Market challenges
          • 13.3 Impact of drivers and challenges
            • Impact of drivers and challenges in 2024 and 2029
          • 13.4 Market opportunities/restraints

            14 Competitive Landscape

            • 14.1 Overview
              • 14.2 Competitive Landscape
                • Overview on criticality of inputs and factors of differentiation
              • 14.3 Landscape disruption
                • Overview on factors of disruption
              • 14.4 Industry risks
                • Impact of key risks on business

              15 Competitive Analysis

              • 15.1 Companies profiled
                • Companies covered
              • 15.2 Company ranking index
                • Company ranking index
              • 15.3 Market positioning of companies
                • Matrix on companies position and classification
              • 15.4 Aurubis AG
                • Aurubis AG - Overview
                • Aurubis AG - Business segments
                • Aurubis AG - Key news
                • Aurubis AG - Key offerings
                • Aurubis AG - Segment focus
                • SWOT
              • 15.5 Boliden Group
                • Boliden Group - Overview
                • Boliden Group - Product / Service
                • Boliden Group - Key offerings
                • SWOT
              • 15.6 CIMELIA RESOURCE RECOVERY PTE LTD.
                • CIMELIA RESOURCE RECOVERY PTE LTD. - Overview
                • CIMELIA RESOURCE RECOVERY PTE LTD. - Product / Service
                • CIMELIA RESOURCE RECOVERY PTE LTD. - Key offerings
                • SWOT
              • 15.7 E Parisaraa Pvt. Ltd.
                • E Parisaraa Pvt. Ltd. - Overview
                • E Parisaraa Pvt. Ltd. - Product / Service
                • E Parisaraa Pvt. Ltd. - Key offerings
                • SWOT
              • 15.8 Egyptian Electronics Recycling Co.
                • Egyptian Electronics Recycling Co. - Overview
                • Egyptian Electronics Recycling Co. - Product / Service
                • Egyptian Electronics Recycling Co. - Key offerings
                • SWOT
              • 15.9 Electronic Recyclers International Inc.
                • Electronic Recyclers International Inc. - Overview
                • Electronic Recyclers International Inc. - Product / Service
                • Electronic Recyclers International Inc. - Key offerings
                • SWOT
              • 15.10 Global Ewaste Solutions
                • Global Ewaste Solutions - Overview
                • Global Ewaste Solutions - Product / Service
                • Global Ewaste Solutions - Key offerings
                • SWOT
              • 15.11 Kuusakoski Oy
                • Kuusakoski Oy - Overview
                • Kuusakoski Oy - Business segments
                • Kuusakoski Oy - Key offerings
                • Kuusakoski Oy - Segment focus
                • SWOT
              • 15.12 MBA Polymers Inc.
                • MBA Polymers Inc. - Overview
                • MBA Polymers Inc. - Product / Service
                • MBA Polymers Inc. - Key news
                • MBA Polymers Inc. - Key offerings
                • SWOT
              • 15.13 Sembcorp Industries Ltd.
                • Sembcorp Industries Ltd. - Overview
                • Sembcorp Industries Ltd. - Product / Service
                • Sembcorp Industries Ltd. - Key offerings
                • SWOT
              • 15.14 Sims Ltd.
                • Sims Ltd. - Overview
                • Sims Ltd. - Business segments
                • Sims Ltd. - Key news
                • Sims Ltd. - Key offerings
                • Sims Ltd. - Segment focus
                • SWOT
              • 15.15 Stena Metall Group
                • Stena Metall Group - Overview
                • Stena Metall Group - Product / Service
                • Stena Metall Group - Key offerings
                • SWOT
              • 15.16 Tetronics
                • Tetronics - Overview
                • Tetronics - Product / Service
                • Tetronics - Key offerings
                • SWOT
              • 15.17 Umicore SA
                • Umicore SA - Overview
                • Umicore SA - Business segments
                • Umicore SA - Key news
                • Umicore SA - Key offerings
                • Umicore SA - Segment focus
                • SWOT
              • 15.18 Waste Management Inc.
                • Waste Management Inc. - Overview
                • Waste Management Inc. - Business segments
                • Waste Management Inc. - Key offerings
                • Waste Management Inc. - Segment focus
                • SWOT

              16 Appendix

              • 16.1 Scope of the report
                • 16.2 Inclusions and exclusions checklist
                  • Inclusions checklist
                  • Exclusions checklist
                • 16.3 Currency conversion rates for US$
                  • Currency conversion rates for US$
                • 16.4 Research methodology
                  • Research methodology
                • 16.5 Data procurement
                  • Information sources
                • 16.6 Data validation
                  • Data validation
                • 16.7 Validation techniques employed for market sizing
                  • Validation techniques employed for market sizing
                • 16.8 Data synthesis
                  • Data synthesis
                • 16.9 360 degree market analysis
                  • 360 degree market analysis
                • 16.10 List of abbreviations
                  • List of abbreviations

                Research Methodology

                Technavio presents a detailed picture of the market by way of study, synthesis, and summation of data from multiple sources. The analysts have presented the various facets of the market with a particular focus on identifying the key industry influencers. The data thus presented is comprehensive, reliable, and the result of extensive research, both primary and secondary.

                INFORMATION SOURCES

                Primary sources

                • Manufacturers and suppliers
                • Channel partners
                • Industry experts
                • Strategic decision makers

                Secondary sources

                • Industry journals and periodicals
                • Government data
                • Financial reports of key industry players
                • Historical data
                • Press releases

                DATA ANALYSIS

                Data Synthesis

                • Collation of data
                • Estimation of key figures
                • Analysis of derived insights

                Data Validation

                • Triangulation with data models
                • Reference against proprietary databases
                • Corroboration with industry experts

                REPORT WRITING

                Qualitative

                • Market drivers
                • Market challenges
                • Market trends
                • Five forces analysis

                Quantitative

                • Market size and forecast
                • Market segmentation
                • Geographical insights
                • Competitive landscape

                Interested in this report?

                Get your sample now to see our research methodology and insights!

                Download Now

                Frequently Asked Questions

                Electronic Waste Recycling market growth will increase by $ 32735.3 mn during 2025-2029.

                The Electronic Waste Recycling market is expected to grow at a CAGR of 21.6% during 2025-2029.

                Electronic Waste Recycling market is segmented by Material( Metals and chemicals, Plastic, Glass) Source( Household appliances, Entertainment and consumer electronics, IT and telecom, Medical equipment, Others) Method( Mechanical recycling, Pyrolysis, Others, Bioleaching, Middle East and Africa)

                ALBA Group Plc and Co. KG, Aurubis AG, Boliden Group, CIMELIA RESOURCE RECOVERY PTE LTD., E Parisaraa Pvt. Ltd., Egyptian Electronics Recycling Co., Electrocycling GmbH, Electronic Recyclers International Inc., Global Ewaste Solutions, Good Point Recycling, Kuusakoski Oy, MBA Polymers Inc., Sembcorp Industries Ltd., Sims Ltd., Stena Metall Group, TES Singapore Pte Ltd., Tetronics, Umicore SA, Veolia Environnement SA, Waste Management Inc. are a few of the key vendors in the Electronic Waste Recycling market.

                Europe will register the highest growth rate of 41% among the other regions. Therefore, the Electronic Waste Recycling market in Europe is expected to garner significant business opportunities for the vendors during the forecast period.

                China, US, Japan, UK, Canada, France, India, Brazil, Germany, UAE

                • Stringent government regulations for e-waste managementGovernment agencies around the world have framed regulations to monitor and manage e-waste effectively and spread awareness about the same. For instance is the driving factor this market.
                • the Ministry of Environment is the driving factor this market.
                • Forest is the driving factor this market.
                • and Climate Change of India (MOEFCC) notified the procedure for the management of e-waste. E-waste should be managed through a series of steps that include prevention is the driving factor this market.
                • minimization is the driving factor this market.
                • reuse is the driving factor this market.
                • recycling is the driving factor this market.
                • recovery is the driving factor this market.
                • and activities such as co-processing and safe disposal. Additionally is the driving factor this market.
                • every occupant of a facility involved in the collection is the driving factor this market.
                • co-processing is the driving factor this market.
                • disposal is the driving factor this market.
                • generation is the driving factor this market.
                • handling is the driving factor this market.
                • offering for sale is the driving factor this market.
                • packaging is the driving factor this market.
                • pre-processing is the driving factor this market.
                • processing is the driving factor this market.
                • recovery is the driving factor this market.
                • recycling is the driving factor this market.
                • storage is the driving factor this market.
                • transportation is the driving factor this market.
                • treatment is the driving factor this market.
                • use is the driving factor this market.
                • utilization is the driving factor this market.
                • and transfer of e-waste needs to apply to the respective State Pollution Control Board to obtain authorization within 90 days from the date of publication of the rules. In Europe is the driving factor this market.
                • the EU WEEE directive designates safe and responsible collection is the driving factor this market.
                • recycling is the driving factor this market.
                • and recovery procedures for all types of e-waste. Similarly is the driving factor this market.
                • EU and international law forbids the export of hazardous e-waste to countries that are not members of the OECD. Hence is the driving factor this market.
                • such regulations pertaining to the efficient management of e-waste are likely to boost the growth of the global electronic waste recycling market during the forecast period. is the driving factor this market.

                The Electronic Waste Recycling market vendors should focus on grabbing business opportunities from the Metals and chemicals segment as it accounted for the largest market share in the base year.