E-bike Drive Unit Market Analysis, Size, and Forecast 2026-2030: APAC (China, Japan, and India), Europe (Germany, UK, and France), North America (US, Canada, and Mexico), Middle East and Africa (Saudi Arabia, UAE, and South Africa), South America (Brazil and Argentina), and Rest of World (ROW)

E-bike Drive Unit Market Analysis, Size, and Forecast 2026-2030:
APAC (China, Japan, and India), Europe (Germany, UK, and France), North America (US, Canada, and Mexico), Middle East and Africa (Saudi Arabia, UAE, and South Africa), South America (Brazil and Argentina), and Rest of World (ROW)

Published: Mar 2026 292 Pages SKU: IRTNTR43152

Market Overview at a Glance

$10.78 B
Market Opportunity
15%
CAGR 2025 - 2030
76%
APAC Growth
$5.03 B
Hub motor segment 2024

E-bike Drive Unit Market Size 2026-2030

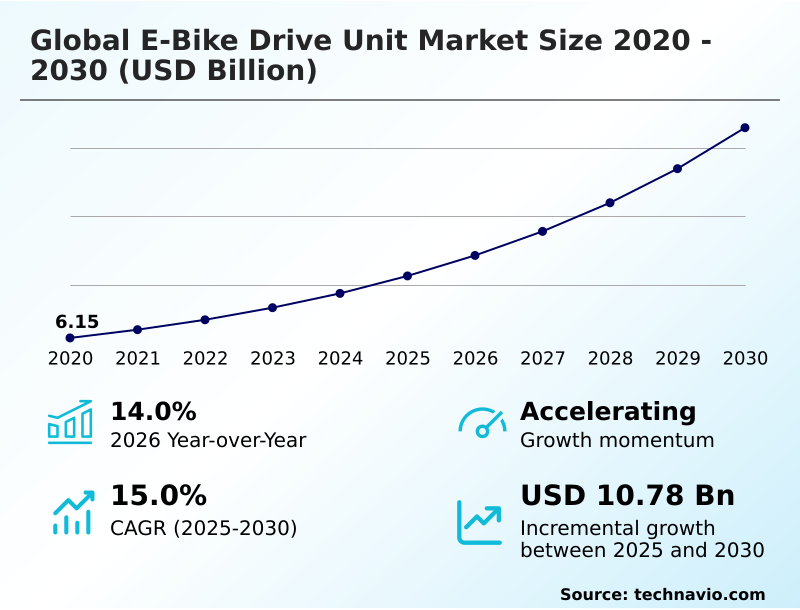
The e-bike drive unit market size is valued to increase by USD 10.78 billion, at a CAGR of 15% from 2025 to 2030. Increasing adoption of e-bikes for urban mobility and leisure activities will drive the e-bike drive unit market.

Major Market Trends & Insights

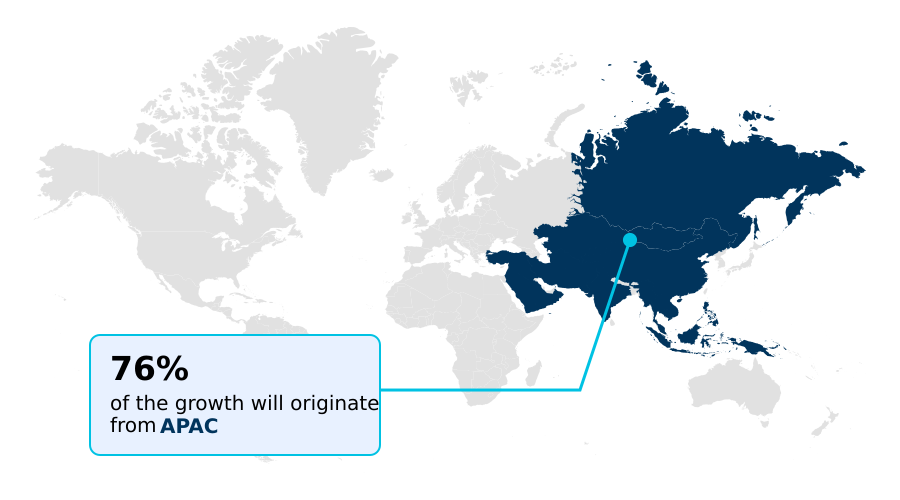
  • APAC dominated the market and accounted for a 76% growth during the forecast period.
  • By Type - Hub motor segment was valued at USD 5.03 billion in 2024
  • By Capacity - Up to 250 watt segment accounted for the largest market revenue share in 2024

Market Size & Forecast

  • Market Opportunities: USD 15.29 billion
  • Market Future Opportunities: USD 10.78 billion
  • CAGR from 2025 to 2030 : 15%

Market Summary

  • The e-bike drive unit market is undergoing significant transformation, driven by a confluence of technological innovation and shifting consumer preferences. At its core, the demand for more efficient and powerful electromechanical propulsion systems is expanding beyond simple commuting. The market is now highly segmented, with specialized solutions for high-performance e-MTB, heavy-duty cargo e-bikes, and lightweight urban mobility platforms.
  • This diversification is fueling advancements in power density, motor control software, and overall drive unit efficiency. A key business scenario involves logistics companies adopting e-cargo fleets; to optimize operations, they require drive units with robust thermal management and predictive maintenance capabilities enabled by smart connectivity.
  • This shift from a component-based sale to a system-level solution, featuring over-the-air firmware updates and advanced diagnostics, is redefining competitive dynamics. However, this progress is tempered by the complexities of the global semiconductor supply chain and the fluctuating costs of rare earth magnets, which are essential for high-performance brushless DC motor designs.
  • Navigating these supply chain risks while meeting demands for greater system integration and miniaturization is the central challenge for manufacturers.

What will be the Size of the E-bike Drive Unit Market during the forecast period?

Get Key Insights on Market Forecast (PDF) Request Free Sample

How is the E-bike Drive Unit Market Segmented?

The e-bike drive unit industry research report provides comprehensive data (region-wise segment analysis), with forecasts and estimates in "USD million" for the period 2026-2030, as well as historical data from 2020-2024 for the following segments.

  • Type
    • Hub motor
    • Mid-drive motor
  • Capacity
    • Up to 250 watt
    • Between 250-550 watt
    • Above 550 watt
  • Application
    • Urban
    • Trekking
    • Cargo
  • Geography
    • APAC
      • China
      • Japan
      • India
    • Europe
      • Germany
      • UK
      • France
    • North America
      • US
      • Canada
      • Mexico
    • Middle East and Africa
      • Saudi Arabia
      • UAE
      • South Africa
    • South America
      • Brazil
      • Argentina
    • Rest of World (ROW)

By Type Insights

The hub motor segment is estimated to witness significant growth during the forecast period.

The hub motor segment represents a foundational category, characterized by a self-contained drive unit integrated into a wheel hub.

This electromechanical propulsion design simplifies the e-bike architecture, making it a popular choice for urban mobility and last-mile logistics, where its cost-effectiveness and low-maintenance drive unit profile are advantageous.

While typically utilizing a cadence sensor for power delivery, this configuration is a key enabler for the entry-level market, accounting for over 50% of unit sales in high-volume regions.

However, its design can impact the performance of drivetrain components and overall handling compared to other systems. This segment's relevance is sustained by its reliability in high-volume, utility-focused applications that value simplicity and a robust drive unit supply chain.

Request Free Sample

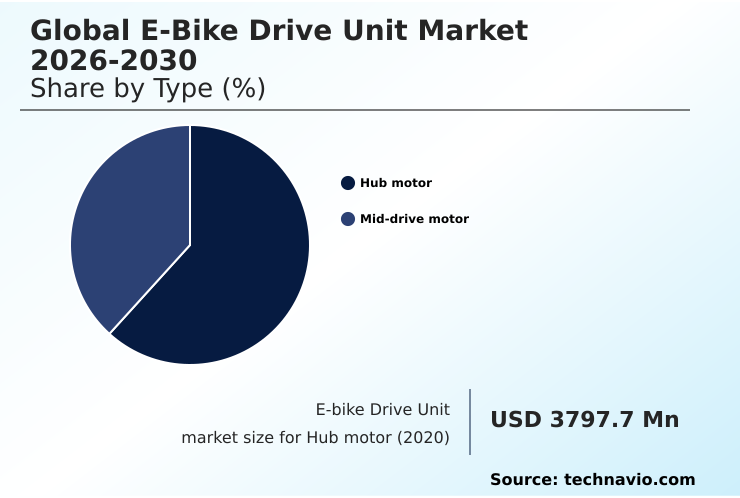
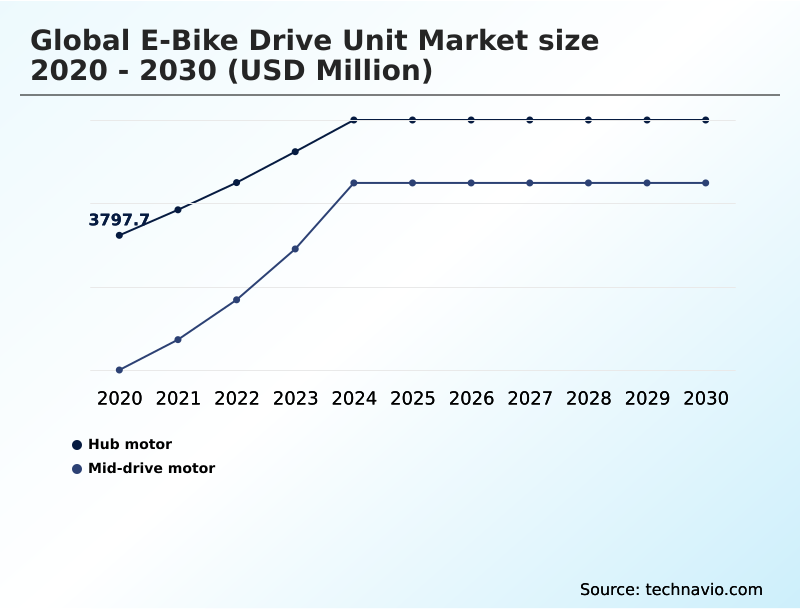
The Hub motor segment was valued at USD 5.03 billion in 2024 and showed a gradual increase during the forecast period.

Request Free Sample

Regional Analysis

APAC is estimated to contribute 76% to the growth of the global market during the forecast period.Technavio’s analysts have elaborately explained the regional trends and drivers that shape the market during the forecast period.

See How E-bike Drive Unit Market Demand is Rising in APAC Request Free Sample

The market's geographic landscape is led by APAC, which commands 76% of the incremental growth, driven by its vast manufacturing ecosystem and strong domestic demand for urban mobility solutions.

This region's focus on high-volume hub motor production contrasts with Europe, where a stringent pedelec regulatory framework and a mature cycling culture favor sophisticated mid-drive motor systems, particularly in Germany and the Netherlands.

North America is experiencing rapid expansion, with its market growth accelerating at 15.5%, fueled by the recreational e-MTB segment's demand for high-torque drive unit technology and e-bike firmware customization.

The development of specialized drive units for trekking and robust commercial e-bike drive unit models is a key growth vector across all developed regions, highlighting a global trend toward product diversification and advanced e-bike power management.

Market Dynamics

Our researchers analyzed the data with 2025 as the base year, along with the key drivers, trends, and challenges. A holistic analysis of drivers will help companies refine their marketing strategies to gain a competitive advantage.

  • Understanding how an e-bike mid-drive motor work is crucial for appreciating its dominance in performance segments, as it leverages the bike's gearing for superior efficiency. The benefits of a torque sensor in e-bikes, which provide a more natural and responsive feel, are a key differentiator.
  • For commercial applications, the focus is on the e-bike drive unit for heavy cargo, which requires robust engineering. In contrast, the sport segment is seeing a rise in the lightweight e-road bike drive system. Across the board, manufacturers face challenges in e-bike motor manufacturing, including sourcing materials and managing costs.
  • A key area of innovation is integrating ABS with e-bike drive units for enhanced safety. Boardroom decisions are increasingly focused on optimizing e-bike motor for thermal performance, as this directly impacts durability and user satisfaction, with advanced cooling systems reducing failure rates by over 15% in high-stress applications.
  • The ability for customizing e-bike motor assistance levels through software is now a standard expectation. The impact of rare earth metals on e-bike motors remains a significant supply chain concern, alongside troubleshooting common e-bike motor problems for after-sales support. The future of e-bike connectivity and software points toward more integrated and intelligent systems.
  • Developing a dedicated e-bike drive unit for long-distance touring requires a focus on efficiency and reliability. All players must navigate the complex regulatory standards for e-bike motor power. Key trends include advancements in e-bike motor miniaturization and improving e-bike hub motor maintenance and repair processes.
  • The role of software in modern e-bike systems cannot be overstated, especially for the e-bike drive unit for shared mobility fleets. Stakeholders continually ask how to improve e-bike motor efficiency and mitigate the impact of drive unit weight on handling, while comparing high-torque vs high-speed motors for different applications.

What are the key market drivers leading to the rise in the adoption of E-bike Drive Unit Industry?

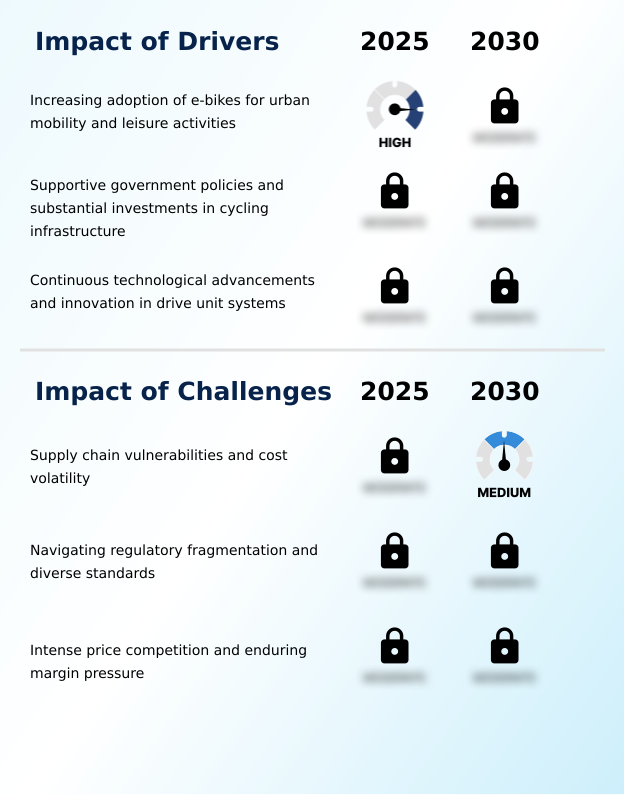
  • The increasing adoption of e-bikes for urban mobility and leisure activities is a primary driver fueling market growth and innovation in drive unit technology.

  • The market is propelled by the increasing adoption of e-bikes for urban mobility and last-mile logistics, creating sustained demand for a variety of electric bicycle motor types.
  • Government incentives have successfully increased adoption by up to 30% in certain metropolitan areas, directly fueling the need for reliable e-bike motor controller technology.
  • Continuous innovation in drive unit efficiency allows manufacturers to deliver 20% more range from the same battery capacity. This addresses key consumer concerns and expands the viability of e-bikes.
  • The development of specialized e-cargo bike powertrain systems and solutions for off-road e-bike motor applications is opening new commercial and recreational segments, underscoring the versatility of the underlying e-bike propulsion technology.

What are the market trends shaping the E-bike Drive Unit Industry?

  • A prevailing market trend is the concerted push toward greater system integration and miniaturization. This evolution aims to enhance both aesthetic appeal and the handling characteristics of modern e-bikes.

  • A primary market trend is the push toward advanced system integration and miniaturization, where the e-bike drive system is engineered to be lighter and more compact. This focus on creating a lightweight drive system has led to new gearbox designs that reduce physical footprint by over 15% without sacrificing power output.
  • The goal is to create a compact drive unit that improves the bicycle's handling and aesthetic appeal. This evolution is driven by consumer demand for high-performance e-bike drive solutions that feel more like traditional bicycles.
  • The integration of smart e-bike systems with connected e-bike features allows for a high degree of e-bike firmware customization and remote e-bike diagnostics, enhancing the user experience and simplifying maintenance.

What challenges does the E-bike Drive Unit Industry face during its growth?

  • Supply chain vulnerabilities and the cost volatility of critical raw materials represent a key challenge impacting production stability and profit margins across the industry.

  • A formidable challenge is the volatility of the global semiconductor supply chain and the sourcing of rare earth magnets, which can increase production costs by up to 10% during periods of disruption. This makes managing drive unit supply chain logistics a critical operational focus.
  • Navigating fragmented e-bike regulatory compliance, which varies significantly between regions, complicates product development and adds considerable testing overhead. Intense price competition, especially for hub motor systems, exerts downward pressure on margins, while the increasing wear on drivetrain components from powerful mid-drive motors elevates long-term service concerns.
  • The need for effective drive unit cooling systems to prevent overheating in high-torque drive unit applications further adds to design complexity and cost, impacting overall e-bike motor durability.

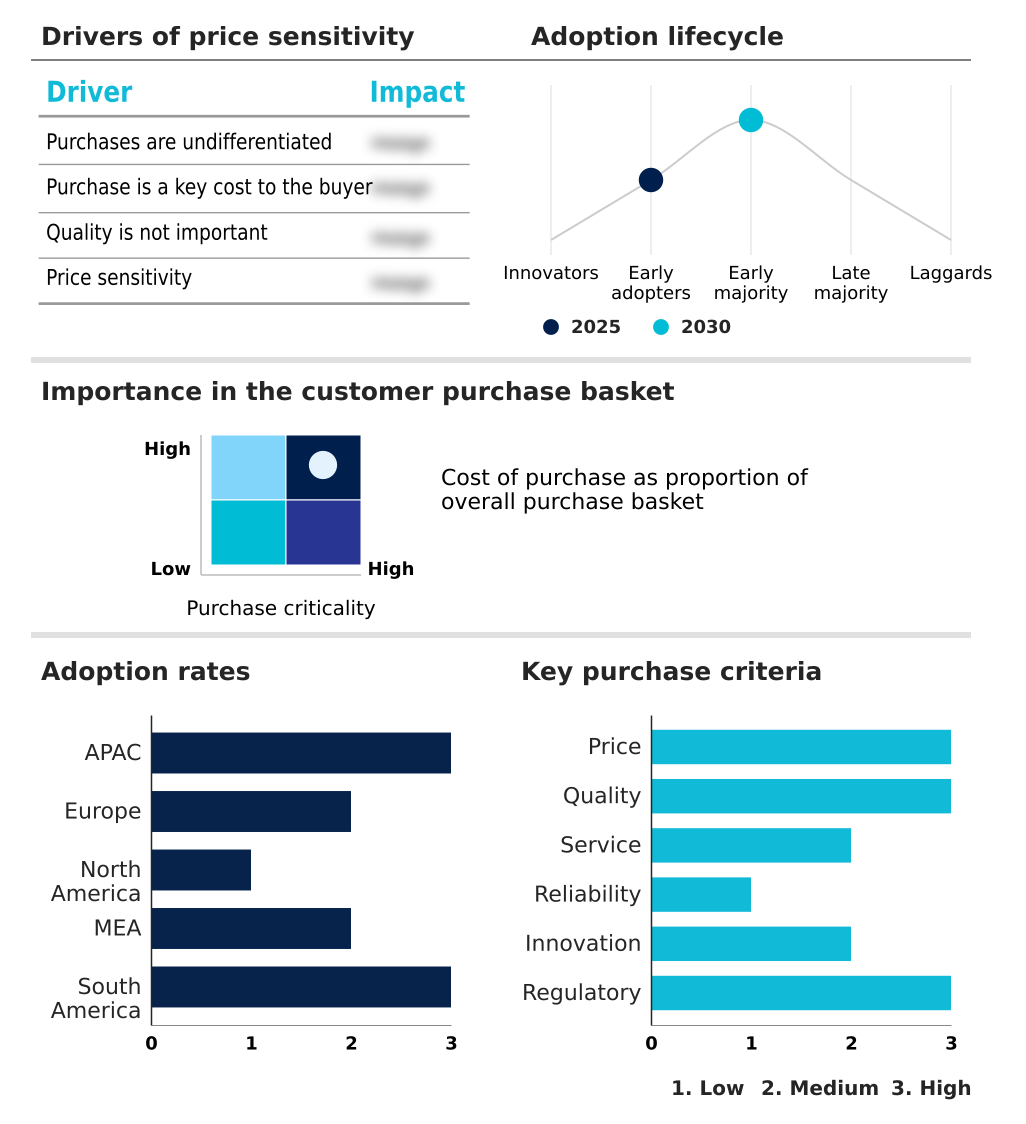
Exclusive Technavio Analysis on Customer Landscape

The e-bike drive unit market forecasting report includes the adoption lifecycle of the market, covering from the innovator’s stage to the laggard’s stage. It focuses on adoption rates in different regions based on penetration. Furthermore, the e-bike drive unit market report also includes key purchase criteria and drivers of price sensitivity to help companies evaluate and develop their market growth analysis strategies.

Customer Landscape of E-bike Drive Unit Industry

Competitive Landscape

Companies are implementing various strategies, such as strategic alliances, e-bike drive unit market forecast, partnerships, mergers and acquisitions, geographical expansion, and product/service launches, to enhance their presence in the industry.

Aikema Electric Suzhou Co. - The market's key offerings include a broad range of e-bike propulsion technology, from high-torque mid-drive units and integrated hub systems to complete, connected e-bike systems with advanced diagnostics.

The industry research and growth report includes detailed analyses of the competitive landscape of the market and information about key companies, including:

  • Aikema Electric Suzhou Co.
  • Alber GmbH
  • Bafang Electric Suzhou Co.
  • Brose SE and Co. KG
  • FAZUA GmbH
  • Giant Bicycle Inc.
  • Hyena Inc.
  • MAHLE GmbH
  • Maxon Motor AG
  • Motinova Technology
  • Panasonic Holdings Corp.
  • Polini Motori Spa
  • Robert Bosch GmbH
  • Shimano Inc.
  • Specialized Bicycle Components
  • Suzhou Wanjia Electric Co. Ltd.
  • TQ Systems GmbH
  • Valeo SA
  • Yamaha Motor Co. Ltd.
  • ZF Friedrichshafen AG

Qualitative and quantitative analysis of companies has been conducted to help clients understand the wider business environment as well as the strengths and weaknesses of key industry players. Data is qualitatively analyzed to categorize companies as pure play, category-focused, industry-focused, and diversified; it is quantitatively analyzed to categorize companies as dominant, leading, strong, tentative, and weak.

Recent Development and News in E-bike drive unit market

  • In March, 2025, Yamaha Motor Co. Ltd. finalized its acquisition of the e-bike drive unit business from Brose Fahrzeugteile GmbH, a strategic move to broaden its product portfolio and manufacturing presence in the European market.
  • In April, 2025, SEG Automotive and Octagon initiated a strategic partnership to co-develop an advanced lightweight mid-drive motor system, targeting the premium e-bike segment with a focus on high performance and integration.
  • In February, 2025, Panasonic Holdings Corp. announced a USD 100 million investment to expand its e-bike battery production capacity in Japan, signaling a strong commitment to reinforcing its position within the e-bike component ecosystem.
  • In April, 2025, the German Federal Ministry for Digital and Transport introduced the Urban Logistics Electrification Mandate, requiring a 50% transition of commercial last-mile delivery fleets in major cities to electric vehicles, specifically highlighting electric cargo bikes.

Dive into Technavio’s robust research methodology, blending expert interviews, extensive data synthesis, and validated models for unparalleled E-bike Drive Unit Market insights. See full methodology.

Market Scope
Page number 292
Base year 2025
Historic period 2020-2024
Forecast period 2026-2030
Growth momentum & CAGR Accelerate at a CAGR of 15%
Market growth 2026-2030 USD 10777.4 million
Market structure Fragmented
YoY growth 2025-2026(%) 14.0%
Key countries China, Japan, India, South Korea, Indonesia, Thailand, Germany, UK, France, Italy, Spain, The Netherlands, US, Canada, Mexico, Saudi Arabia, UAE, South Africa, Turkey, Israel, Brazil, Argentina and Chile
Competitive landscape Leading Companies, Market Positioning of Companies, Competitive Strategies, and Industry Risks

Request Free Sample

Research Analyst Overview

  • The e-bike drive unit market's evolution is defined by the intense engineering focus on optimizing the core e-bike drive system. Competition between the hub motor and mid-drive motor is segmenting the market, with the latter dominating high-performance applications like e-MTB and cargo e-bikes due to superior power density and integration.
  • The incorporation of advanced torque sensor and cadence sensor technologies is pivotal for delivering refined electromechanical propulsion. This pursuit of performance is balanced against significant manufacturing challenges, including the volatile semiconductor supply chain and dependency on rare earth magnets for brushless DC motor production. For boardroom strategy, navigating fragmented anti-tampering measures and pedelec regulations requires a diversified R&D budget.
  • Innovations in motor control software and over-the-air firmware updates are creating new value, enabling features like walk assist mode and enhanced smart connectivity. The development of a lightweight drive system through miniaturization and new gearbox design has reduced system weight by up to 20%, directly improving vehicle dynamics.
  • This requires advanced thermal management to maintain power output without compromising the longevity of drivetrain components. The industry is moving towards complete system integration, where the electronic controller and drive unit efficiency are paramount for urban mobility, last-mile logistics, and high-power S-Pedelecs, with a focus on creating compact, high-torque, and low-maintenance drive unit solutions that may incorporate regenerative braking.

What are the Key Data Covered in this E-bike Drive Unit Market Research and Growth Report?

  • What is the expected growth of the E-bike Drive Unit Market between 2026 and 2030?

    • USD 10.78 billion, at a CAGR of 15%

  • What segmentation does the market report cover?

    • The report is segmented by Type (Hub motor, and Mid-drive motor), Capacity (Up to 250 watt, Between 250-550 watt, and Above 550 watt), Application (Urban, Trekking, and Cargo) and Geography (APAC, Europe, North America, Middle East and Africa, South America)

  • Which regions are analyzed in the report?

    • APAC, Europe, North America, Middle East and Africa and South America

  • What are the key growth drivers and market challenges?

    • Increasing adoption of e-bikes for urban mobility and leisure activities, Supply chain vulnerabilities and cost volatility

  • Who are the major players in the E-bike Drive Unit Market?

    • Aikema Electric Suzhou Co., Alber GmbH, Bafang Electric Suzhou Co., Brose SE and Co. KG, FAZUA GmbH, Giant Bicycle Inc., Hyena Inc., MAHLE GmbH, Maxon Motor AG, Motinova Technology, Panasonic Holdings Corp., Polini Motori Spa, Robert Bosch GmbH, Shimano Inc., Specialized Bicycle Components, Suzhou Wanjia Electric Co. Ltd., TQ Systems GmbH, Valeo SA, Yamaha Motor Co. Ltd. and ZF Friedrichshafen AG

Market Research Insights

  • Market dynamics are shaped by the push for advanced e-bike propulsion technology, where the performance gap between mid-drive vs hub motor systems defines segment strategies. The integration of connected e-bike features has led to a 20% reduction in service calls for fleet operators through remote e-bike diagnostics.
  • Furthermore, the development of high-performance e-bike drive systems for specialized applications like e-cargo bike powertrain has improved commercial delivery efficiency by over 15%. This focus on specialization is compelling manufacturers to refine e-bike system components and enhance overall drive unit reliability.
  • The advancement in pedal-assist system technology, particularly torque-sensing assist, provides a more intuitive ride, increasing user adoption rates by nearly 10% in premium segments compared to basic cadence-sensing assist.

We can help! Our analysts can customize this e-bike drive unit market research report to meet your requirements.

Get in touch

1. Executive Summary

1.1 Market overview

Executive Summary - Chart on Market Overview
Executive Summary - Data Table on Market Overview
Executive Summary - Chart on Global Market Characteristics
Executive Summary - Chart on Market by Geography
Executive Summary - Chart on Market Segmentation by Type
Executive Summary - Chart on Market Segmentation by Capacity
Executive Summary - Chart on Market Segmentation by Application
Executive Summary - Chart on Incremental Growth
Executive Summary - Data Table on Incremental Growth
Executive Summary - Chart on Company Market Positioning

2. Technavio Analysis

2.1 Analysis of price sensitivity, lifecycle, customer purchase basket, adoption rates, and purchase criteria

2.2 Criticality of inputs and Factors of differentiation

Chart on Overview on criticality of inputs and factors of differentiation

2.3 Factors of disruption

Chart on Overview on factors of disruption

2.4 Impact of drivers and challenges

Chart on Impact of drivers and challenges in 2025 and 2030

3. Market Landscape

3.1 Market ecosystem

Chart on Parent Market
Data Table on - Parent Market

3.2 Market characteristics

Chart on Market characteristics analysis

3.3 Value chain analysis

Chart on Value chain analysis

4. Market Sizing

4.1 Market definition

Data Table on Offerings of companies included in the market definition

4.2 Market segment analysis

Market segments

4.3 Market size 2025

4.4 Market outlook: Forecast for 2025-2030

Chart on Global - Market size and forecast 2025-2030 ($ million)
Data Table on Global - Market size and forecast 2025-2030 ($ million)
Chart on Global Market: Year-over-year growth 2025-2030 (%)
Data Table on Global Market: Year-over-year growth 2025-2030 (%)

5. Historic Market Size

5.1 Global E-Bike Drive Unit Market 2020 - 2024

Historic Market Size - Data Table on Global E-Bike Drive Unit Market 2020 - 2024 ($ million)

5.2 Type segment analysis 2020 - 2024

Historic Market Size - Type Segment 2020 - 2024 ($ million)

5.3 Capacity segment analysis 2020 - 2024

Historic Market Size - Capacity Segment 2020 - 2024 ($ million)

5.4 Application segment analysis 2020 - 2024

Historic Market Size - Application Segment 2020 - 2024 ($ million)

5.5 Geography segment analysis 2020 - 2024

Historic Market Size - Geography Segment 2020 - 2024 ($ million)

5.6 Country segment analysis 2020 - 2024

Historic Market Size - Country Segment 2020 - 2024 ($ million)

6. Qualitative Analysis

6.1 Impact of AI on global e-bike drive unit market

6.2 Impact of geopolitical conflicts on global e-bike drive unit market

7. Five Forces Analysis

7.1 Five forces summary

Five forces analysis - Comparison between 2025 and 2030

7.2 Bargaining power of buyers

Bargaining power of buyers - Impact of key factors 2025 and 2030

7.3 Bargaining power of suppliers

Bargaining power of suppliers - Impact of key factors in 2025 and 2030

7.4 Threat of new entrants

Threat of new entrants - Impact of key factors in 2025 and 2030

7.5 Threat of substitutes

Threat of substitutes - Impact of key factors in 2025 and 2030

7.6 Threat of rivalry

Threat of rivalry - Impact of key factors in 2025 and 2030

7.7 Market condition

Chart on Market condition - Five forces 2025 and 2030

8. Market Segmentation by Type

8.1 Market segments

Chart on Type - Market share 2025-2030 (%)
Data Table on Type - Market share 2025-2030 (%)

8.2 Comparison by Type

Chart on Comparison by Type
Data Table on Comparison by Type

8.3 Hub motor - Market size and forecast 2025-2030

Chart on Hub motor - Market size and forecast 2025-2030 ($ million)
Data Table on Hub motor - Market size and forecast 2025-2030 ($ million)
Chart on Hub motor - Year-over-year growth 2025-2030 (%)
Data Table on Hub motor - Year-over-year growth 2025-2030 (%)

8.4 Mid-drive motor - Market size and forecast 2025-2030

Chart on Mid-drive motor - Market size and forecast 2025-2030 ($ million)
Data Table on Mid-drive motor - Market size and forecast 2025-2030 ($ million)
Chart on Mid-drive motor - Year-over-year growth 2025-2030 (%)
Data Table on Mid-drive motor - Year-over-year growth 2025-2030 (%)

8.5 Market opportunity by Type

Market opportunity by Type ($ million)
Data Table on Market opportunity by Type ($ million)

9. Market Segmentation by Capacity

9.1 Market segments

Chart on Capacity - Market share 2025-2030 (%)
Data Table on Capacity - Market share 2025-2030 (%)

9.2 Comparison by Capacity

Chart on Comparison by Capacity
Data Table on Comparison by Capacity

9.3 Up to 250 watt - Market size and forecast 2025-2030

Chart on Up to 250 watt - Market size and forecast 2025-2030 ($ million)
Data Table on Up to 250 watt - Market size and forecast 2025-2030 ($ million)
Chart on Up to 250 watt - Year-over-year growth 2025-2030 (%)
Data Table on Up to 250 watt - Year-over-year growth 2025-2030 (%)

9.4 Between 250-550 watt - Market size and forecast 2025-2030

Chart on Between 250-550 watt - Market size and forecast 2025-2030 ($ million)
Data Table on Between 250-550 watt - Market size and forecast 2025-2030 ($ million)
Chart on Between 250-550 watt - Year-over-year growth 2025-2030 (%)
Data Table on Between 250-550 watt - Year-over-year growth 2025-2030 (%)

9.5 Above 550 watt - Market size and forecast 2025-2030

Chart on Above 550 watt - Market size and forecast 2025-2030 ($ million)
Data Table on Above 550 watt - Market size and forecast 2025-2030 ($ million)
Chart on Above 550 watt - Year-over-year growth 2025-2030 (%)
Data Table on Above 550 watt - Year-over-year growth 2025-2030 (%)

9.6 Market opportunity by Capacity

Market opportunity by Capacity ($ million)
Data Table on Market opportunity by Capacity ($ million)

10. Market Segmentation by Application

10.1 Market segments

Chart on Application - Market share 2025-2030 (%)
Data Table on Application - Market share 2025-2030 (%)

10.2 Comparison by Application

Chart on Comparison by Application
Data Table on Comparison by Application

10.3 Urban - Market size and forecast 2025-2030

Chart on Urban - Market size and forecast 2025-2030 ($ million)
Data Table on Urban - Market size and forecast 2025-2030 ($ million)
Chart on Urban - Year-over-year growth 2025-2030 (%)
Data Table on Urban - Year-over-year growth 2025-2030 (%)

10.4 Trekking - Market size and forecast 2025-2030

Chart on Trekking - Market size and forecast 2025-2030 ($ million)
Data Table on Trekking - Market size and forecast 2025-2030 ($ million)
Chart on Trekking - Year-over-year growth 2025-2030 (%)
Data Table on Trekking - Year-over-year growth 2025-2030 (%)

10.5 Cargo - Market size and forecast 2025-2030

Chart on Cargo - Market size and forecast 2025-2030 ($ million)
Data Table on Cargo - Market size and forecast 2025-2030 ($ million)
Chart on Cargo - Year-over-year growth 2025-2030 (%)
Data Table on Cargo - Year-over-year growth 2025-2030 (%)

10.6 Market opportunity by Application

Market opportunity by Application ($ million)
Data Table on Market opportunity by Application ($ million)

11. Customer Landscape

11.1 Customer landscape overview

Analysis of price sensitivity, lifecycle, customer purchase basket, adoption rates, and purchase criteria

12. Geographic Landscape

12.1 Geographic segmentation

Chart on Market share by geography 2025-2030 (%)
Data Table on Market share by geography 2025-2030 (%)

12.2 Geographic comparison

Chart on Geographic comparison
Data Table on Geographic comparison

12.3 APAC - Market size and forecast 2025-2030

Chart on APAC - Market size and forecast 2025-2030 ($ million)
Data Table on APAC - Market size and forecast 2025-2030 ($ million)
Chart on APAC - Year-over-year growth 2025-2030 (%)
Data Table on APAC - Year-over-year growth 2025-2030 (%)
Chart on Regional Comparison - APAC
Data Table on Regional Comparison - APAC

12.3.1 China - Market size and forecast 2025-2030

Chart on China - Market size and forecast 2025-2030 ($ million)
Data Table on China - Market size and forecast 2025-2030 ($ million)
Chart on China - Year-over-year growth 2025-2030 (%)
Data Table on China - Year-over-year growth 2025-2030 (%)

12.3.2 Japan - Market size and forecast 2025-2030

Chart on Japan - Market size and forecast 2025-2030 ($ million)
Data Table on Japan - Market size and forecast 2025-2030 ($ million)
Chart on Japan - Year-over-year growth 2025-2030 (%)
Data Table on Japan - Year-over-year growth 2025-2030 (%)

12.3.3 India - Market size and forecast 2025-2030

Chart on India - Market size and forecast 2025-2030 ($ million)
Data Table on India - Market size and forecast 2025-2030 ($ million)
Chart on India - Year-over-year growth 2025-2030 (%)
Data Table on India - Year-over-year growth 2025-2030 (%)

12.3.4 South Korea - Market size and forecast 2025-2030

Chart on South Korea - Market size and forecast 2025-2030 ($ million)
Data Table on South Korea - Market size and forecast 2025-2030 ($ million)
Chart on South Korea - Year-over-year growth 2025-2030 (%)
Data Table on South Korea - Year-over-year growth 2025-2030 (%)

12.3.5 Indonesia - Market size and forecast 2025-2030

Chart on Indonesia - Market size and forecast 2025-2030 ($ million)
Data Table on Indonesia - Market size and forecast 2025-2030 ($ million)
Chart on Indonesia - Year-over-year growth 2025-2030 (%)
Data Table on Indonesia - Year-over-year growth 2025-2030 (%)

12.3.6 Thailand - Market size and forecast 2025-2030

Chart on Thailand - Market size and forecast 2025-2030 ($ million)
Data Table on Thailand - Market size and forecast 2025-2030 ($ million)
Chart on Thailand - Year-over-year growth 2025-2030 (%)
Data Table on Thailand - Year-over-year growth 2025-2030 (%)

12.4 Europe - Market size and forecast 2025-2030

Chart on Europe - Market size and forecast 2025-2030 ($ million)
Data Table on Europe - Market size and forecast 2025-2030 ($ million)
Chart on Europe - Year-over-year growth 2025-2030 (%)
Data Table on Europe - Year-over-year growth 2025-2030 (%)
Chart on Regional Comparison - Europe
Data Table on Regional Comparison - Europe

12.4.1 Germany - Market size and forecast 2025-2030

Chart on Germany - Market size and forecast 2025-2030 ($ million)
Data Table on Germany - Market size and forecast 2025-2030 ($ million)
Chart on Germany - Year-over-year growth 2025-2030 (%)
Data Table on Germany - Year-over-year growth 2025-2030 (%)

12.4.2 UK - Market size and forecast 2025-2030

Chart on UK - Market size and forecast 2025-2030 ($ million)
Data Table on UK - Market size and forecast 2025-2030 ($ million)
Chart on UK - Year-over-year growth 2025-2030 (%)
Data Table on UK - Year-over-year growth 2025-2030 (%)

12.4.3 France - Market size and forecast 2025-2030

Chart on France - Market size and forecast 2025-2030 ($ million)
Data Table on France - Market size and forecast 2025-2030 ($ million)
Chart on France - Year-over-year growth 2025-2030 (%)
Data Table on France - Year-over-year growth 2025-2030 (%)

12.4.4 Italy - Market size and forecast 2025-2030

Chart on Italy - Market size and forecast 2025-2030 ($ million)
Data Table on Italy - Market size and forecast 2025-2030 ($ million)
Chart on Italy - Year-over-year growth 2025-2030 (%)
Data Table on Italy - Year-over-year growth 2025-2030 (%)

12.4.5 Spain - Market size and forecast 2025-2030

Chart on Spain - Market size and forecast 2025-2030 ($ million)
Data Table on Spain - Market size and forecast 2025-2030 ($ million)
Chart on Spain - Year-over-year growth 2025-2030 (%)
Data Table on Spain - Year-over-year growth 2025-2030 (%)

12.4.6 The Netherlands - Market size and forecast 2025-2030

Chart on The Netherlands - Market size and forecast 2025-2030 ($ million)
Data Table on The Netherlands - Market size and forecast 2025-2030 ($ million)
Chart on The Netherlands - Year-over-year growth 2025-2030 (%)
Data Table on The Netherlands - Year-over-year growth 2025-2030 (%)

12.5 North America - Market size and forecast 2025-2030

Chart on North America - Market size and forecast 2025-2030 ($ million)
Data Table on North America - Market size and forecast 2025-2030 ($ million)
Chart on North America - Year-over-year growth 2025-2030 (%)
Data Table on North America - Year-over-year growth 2025-2030 (%)
Chart on Regional Comparison - North America
Data Table on Regional Comparison - North America

12.5.1 US - Market size and forecast 2025-2030

Chart on US - Market size and forecast 2025-2030 ($ million)
Data Table on US - Market size and forecast 2025-2030 ($ million)
Chart on US - Year-over-year growth 2025-2030 (%)
Data Table on US - Year-over-year growth 2025-2030 (%)

12.5.2 Canada - Market size and forecast 2025-2030

Chart on Canada - Market size and forecast 2025-2030 ($ million)
Data Table on Canada - Market size and forecast 2025-2030 ($ million)
Chart on Canada - Year-over-year growth 2025-2030 (%)
Data Table on Canada - Year-over-year growth 2025-2030 (%)

12.5.3 Mexico - Market size and forecast 2025-2030

Chart on Mexico - Market size and forecast 2025-2030 ($ million)
Data Table on Mexico - Market size and forecast 2025-2030 ($ million)
Chart on Mexico - Year-over-year growth 2025-2030 (%)
Data Table on Mexico - Year-over-year growth 2025-2030 (%)

12.6 Middle East and Africa - Market size and forecast 2025-2030

Chart on Middle East and Africa - Market size and forecast 2025-2030 ($ million)
Data Table on Middle East and Africa - Market size and forecast 2025-2030 ($ million)
Chart on Middle East and Africa - Year-over-year growth 2025-2030 (%)
Data Table on Middle East and Africa - Year-over-year growth 2025-2030 (%)
Chart on Regional Comparison - Middle East and Africa
Data Table on Regional Comparison - Middle East and Africa

12.6.1 Saudi Arabia - Market size and forecast 2025-2030

Chart on Saudi Arabia - Market size and forecast 2025-2030 ($ million)
Data Table on Saudi Arabia - Market size and forecast 2025-2030 ($ million)
Chart on Saudi Arabia - Year-over-year growth 2025-2030 (%)
Data Table on Saudi Arabia - Year-over-year growth 2025-2030 (%)

12.6.2 UAE - Market size and forecast 2025-2030

Chart on UAE - Market size and forecast 2025-2030 ($ million)
Data Table on UAE - Market size and forecast 2025-2030 ($ million)
Chart on UAE - Year-over-year growth 2025-2030 (%)
Data Table on UAE - Year-over-year growth 2025-2030 (%)

12.6.3 South Africa - Market size and forecast 2025-2030

Chart on South Africa - Market size and forecast 2025-2030 ($ million)
Data Table on South Africa - Market size and forecast 2025-2030 ($ million)
Chart on South Africa - Year-over-year growth 2025-2030 (%)
Data Table on South Africa - Year-over-year growth 2025-2030 (%)

12.6.4 Turkey - Market size and forecast 2025-2030

Chart on Turkey - Market size and forecast 2025-2030 ($ million)
Data Table on Turkey - Market size and forecast 2025-2030 ($ million)
Chart on Turkey - Year-over-year growth 2025-2030 (%)
Data Table on Turkey - Year-over-year growth 2025-2030 (%)

12.6.5 Israel - Market size and forecast 2025-2030

Chart on Israel - Market size and forecast 2025-2030 ($ million)
Data Table on Israel - Market size and forecast 2025-2030 ($ million)
Chart on Israel - Year-over-year growth 2025-2030 (%)
Data Table on Israel - Year-over-year growth 2025-2030 (%)

12.7 South America - Market size and forecast 2025-2030

Chart on South America - Market size and forecast 2025-2030 ($ million)
Data Table on South America - Market size and forecast 2025-2030 ($ million)
Chart on South America - Year-over-year growth 2025-2030 (%)
Data Table on South America - Year-over-year growth 2025-2030 (%)
Chart on Regional Comparison - South America
Data Table on Regional Comparison - South America

12.7.1 Brazil - Market size and forecast 2025-2030

Chart on Brazil - Market size and forecast 2025-2030 ($ million)
Data Table on Brazil - Market size and forecast 2025-2030 ($ million)
Chart on Brazil - Year-over-year growth 2025-2030 (%)
Data Table on Brazil - Year-over-year growth 2025-2030 (%)

12.7.2 Argentina - Market size and forecast 2025-2030

Chart on Argentina - Market size and forecast 2025-2030 ($ million)
Data Table on Argentina - Market size and forecast 2025-2030 ($ million)
Chart on Argentina - Year-over-year growth 2025-2030 (%)
Data Table on Argentina - Year-over-year growth 2025-2030 (%)

12.7.3 Chile - Market size and forecast 2025-2030

Chart on Chile - Market size and forecast 2025-2030 ($ million)
Data Table on Chile - Market size and forecast 2025-2030 ($ million)
Chart on Chile - Year-over-year growth 2025-2030 (%)
Data Table on Chile - Year-over-year growth 2025-2030 (%)

12.8 Market opportunity by geography

Market opportunity by geography ($ million)
Data Tables on Market opportunity by geography ($ million)

13. Drivers, Challenges, and Opportunity

13.1 Market drivers

Increasing adoption of e-bikes for urban mobility and leisure activities
Supportive government policies and substantial investments in cycling infrastructure
Continuous technological advancements and innovation in drive unit systems

13.2 Market challenges

Supply chain vulnerabilities and cost volatility
Navigating regulatory fragmentation and diverse standards
Intense price competition and enduring margin pressure

13.3 Impact of drivers and challenges

Impact of drivers and challenges in 2025 and 2030

13.4 Market opportunities

System integration and miniaturization for enhanced aesthetics and performance
Advancement of connectivity and smart system ecosystems
Product diversification and specialization for niche market segments

14. Competitive Landscape

14.1 Overview

14.2

Overview on criticality of inputs and factors of differentiation

14.3 Landscape disruption

Overview on factors of disruption

14.4 Industry risks

Impact of key risks on business

15. Competitive Analysis

15.1 Companies profiled

Companies covered

15.2 Company ranking index

15.3 Market positioning of companies

Matrix on companies position and classification

15.4 Bafang Electric Suzhou Co.

Bafang Electric Suzhou Co. - Overview
Bafang Electric Suzhou Co. - Product / Service
Bafang Electric Suzhou Co. - Key offerings
SWOT

15.5 Brose SE and Co. KG

Brose SE and Co. KG - Overview
Brose SE and Co. KG - Product / Service
Brose SE and Co. KG - Key offerings
SWOT

15.6 Giant Bicycle Inc.

Giant Bicycle Inc. - Overview
Giant Bicycle Inc. - Product / Service
Giant Bicycle Inc. - Key offerings
SWOT

15.7 Hyena Inc.

Hyena Inc. - Overview
Hyena Inc. - Product / Service
Hyena Inc. - Key offerings
SWOT

15.8 MAHLE GmbH

MAHLE GmbH - Overview
MAHLE GmbH - Product / Service
MAHLE GmbH - Key offerings
SWOT

15.9 Maxon Motor AG

Maxon Motor AG - Overview
Maxon Motor AG - Product / Service
Maxon Motor AG - Key offerings
SWOT

15.10 Panasonic Holdings Corp.

Panasonic Holdings Corp. - Overview
Panasonic Holdings Corp. - Business segments
Panasonic Holdings Corp. - Key news
Panasonic Holdings Corp. - Key offerings
Panasonic Holdings Corp. - Segment focus
SWOT

15.11 Polini Motori Spa

Polini Motori Spa - Overview
Polini Motori Spa - Product / Service
Polini Motori Spa - Key offerings
SWOT

15.12 Robert Bosch GmbH

Robert Bosch GmbH - Overview
Robert Bosch GmbH - Product / Service
Robert Bosch GmbH - Key news
Robert Bosch GmbH - Key offerings
SWOT

15.13 Shimano Inc.

Shimano Inc. - Overview
Shimano Inc. - Business segments
Shimano Inc. - Key offerings
Shimano Inc. - Segment focus
SWOT

15.14 Specialized Bicycle Components

Specialized Bicycle Components - Overview
Specialized Bicycle Components - Product / Service
Specialized Bicycle Components - Key offerings
SWOT

15.15 TQ Systems GmbH

TQ Systems GmbH - Overview
TQ Systems GmbH - Product / Service
TQ Systems GmbH - Key offerings
SWOT

15.16 Valeo SA

Valeo SA - Overview
Valeo SA - Business segments
Valeo SA - Key offerings
Valeo SA - Segment focus
SWOT

15.17 Yamaha Motor Co. Ltd.

Yamaha Motor Co. Ltd. - Overview
Yamaha Motor Co. Ltd. - Business segments
Yamaha Motor Co. Ltd. - Key offerings
Yamaha Motor Co. Ltd. - Segment focus
SWOT

15.18 ZF Friedrichshafen AG

ZF Friedrichshafen AG - Overview
ZF Friedrichshafen AG - Product / Service
ZF Friedrichshafen AG - Key offerings
SWOT

16. Appendix

16.1 Scope of the report

Market definition
Objectives
Notes and caveats

16.2 Inclusions and exclusions checklist

Inclusions checklist
Exclusions checklist

16.3 Currency conversion rates for US$

16.4 Research methodology

16.5 Data procurement

Information sources

16.6 Data validation

16.7 Validation techniques employed for market sizing

16.8 Data synthesis

16.9 360 degree market analysis

16.10 List of abbreviations

Research Methodology

Technavio presents a detailed picture of the market by way of study, synthesis, and summation of data from multiple sources. The analysts have presented the various facets of the market with a particular focus on identifying the key industry influencers. The data thus presented is comprehensive, reliable, and the result of extensive research, both primary and secondary.

INFORMATION SOURCES

Primary sources

  • Manufacturers and suppliers
  • Channel partners
  • Industry experts
  • Strategic decision makers

Secondary sources

  • Industry journals and periodicals
  • Government data
  • Financial reports of key industry players
  • Historical data
  • Press releases

DATA ANALYSIS

Data Synthesis

  • Collation of data
  • Estimation of key figures
  • Analysis of derived insights

Data Validation

  • Triangulation with data models
  • Reference against proprietary databases
  • Corroboration with industry experts

REPORT WRITING

Qualitative

  • Market drivers
  • Market challenges
  • Market trends
  • Five forces analysis

Quantitative

  • Market size and forecast
  • Market segmentation
  • Geographical insights
  • Competitive landscape

Interested in this report?

Get your sample now to see our research methodology and insights!

Download Now

Frequently Asked Questions

E-bike Drive Unit market growth will increase by USD 10777.4 million during 2026-2030.

The E-bike Drive Unit market is expected to grow at a CAGR of 15% during 2026-2030.

E-bike Drive Unit market is segmented by Type (Hub motor, Mid-drive motor) Capacity (Up to 250 watt, Between 250-550 watt, Above 550 watt) Application (Urban, Trekking, Cargo)

Aikema Electric Suzhou Co., Alber GmbH, Bafang Electric Suzhou Co., Brose SE and Co. KG, FAZUA GmbH, Giant Bicycle Inc., Hyena Inc., MAHLE GmbH, Maxon Motor AG, Motinova Technology, Panasonic Holdings Corp., Polini Motori Spa, Robert Bosch GmbH, Shimano Inc., Specialized Bicycle Components, Suzhou Wanjia Electric Co. Ltd., TQ Systems GmbH, Valeo SA, Yamaha Motor Co. Ltd., ZF Friedrichshafen AG are a few of the key vendors in the E-bike Drive Unit market.

APAC will register the highest growth rate of 76% among the other regions. Therefore, the E-bike Drive Unit market in APAC is expected to garner significant business opportunities for the vendors during the forecast period.

China, Japan, India, South Korea, Indonesia, Thailand, Germany, UK, France, Italy, Spain, The Netherlands, US, Canada, Mexico, Saudi Arabia, UAE, South Africa, Turkey, Israel, Brazil, Argentina, Chile

  • Increasing adoption of e-bikes for urban mobility and leisure activities is the driving factor this market.

The E-bike Drive Unit market vendors should focus on grabbing business opportunities from the Type segment as it accounted for the largest market share in the base year.
RIA - Research AI Assistant
Ask RIA