Digital Educational Publishing Market Analysis, Size, and Forecast 2026-2030: North America (US, Canada, and Mexico), Europe (Germany, UK, and France), APAC (China, India, and Japan), South America (Brazil, Argentina, and Colombia), Middle East and Africa (Saudi Arabia, South Africa, and UAE), and Rest of World (ROW)

Digital Educational Publishing Market Analysis, Size, and Forecast 2026-2030:
North America (US, Canada, and Mexico), Europe (Germany, UK, and France), APAC (China, India, and Japan), South America (Brazil, Argentina, and Colombia), Middle East and Africa (Saudi Arabia, South Africa, and UAE), and Rest of World (ROW)

Published: Dec 2025 294 Pages SKU: IRTNTR44485

Market Overview at a Glance

$44.84 B
Market Opportunity
26.3%
CAGR 2025 - 2030
45.7%
North America Growth
$8.90 B
Digital textbooks segment 2024

Digital Educational Publishing Market Size 2026-2030

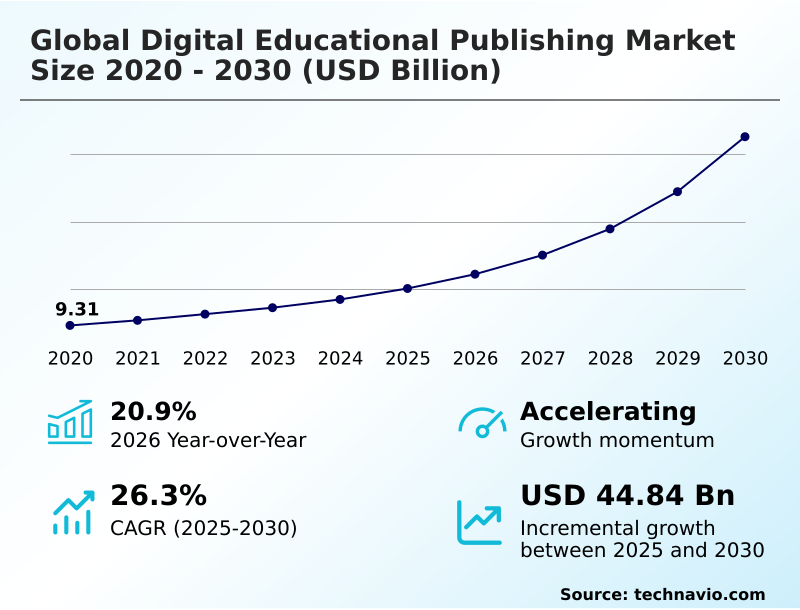
The digital educational publishing market size is valued to increase by USD 44.84 billion, at a CAGR of 26.3% from 2025 to 2030. Innovative marketing strategies by digital education content publishers will drive the digital educational publishing market.

Major Market Trends & Insights

  • North America dominated the market and accounted for a 45.7% growth during the forecast period.
  • By Product - Digital textbooks segment was valued at USD 8.90 billion in 2024
  • By End-user - K-12 segment accounted for the largest market revenue share in 2024

Market Size & Forecast

  • Market Opportunities: USD 55.74 billion
  • Market Future Opportunities: USD 44.84 billion
  • CAGR from 2025 to 2030 : 26.3%

Market Summary

  • The digital educational publishing market is undergoing a significant transformation, moving beyond simple content digitization to create sophisticated learning ecosystems. This evolution is driven by the demand for affordable, accessible, and personalized educational experiences across K-12, higher education, and corporate training sectors.
  • Key trends include the integration of adaptive learning technology and AI-driven assessments to create personalized learning paths, which enhance student engagement and improve outcomes. For instance, a university can implement a cloud-based learning platform that utilizes a learning analytics dashboard to identify at-risk students, enabling proactive intervention and reducing dropout rates by over 15%.
  • However, the industry faces challenges from the proliferation of open educational resources and concerns over digital rights management and content security. Publishers are responding by innovating their business models, shifting toward e-textbook subscription models and offering value-added services like courseware integration and robust digital assessment tools to remain competitive.
  • This strategic pivot from content provider to learning technology partner is redefining the market landscape.

What will be the Size of the Digital Educational Publishing Market during the forecast period?

Get Key Insights on Market Forecast (PDF) Request Free Sample

How is the Digital Educational Publishing Market Segmented?

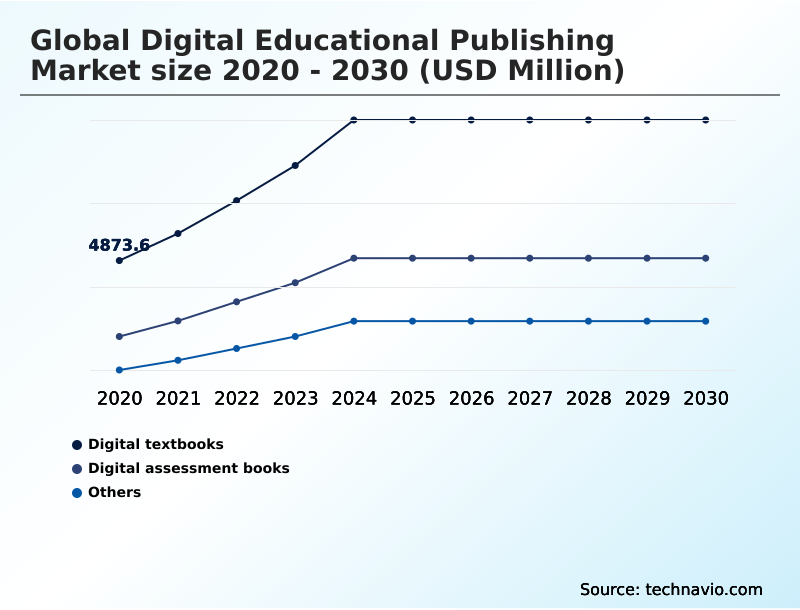
The digital educational publishing industry research report provides comprehensive data (region-wise segment analysis), with forecasts and estimates in "USD million" for the period 2026-2030, as well as historical data from 2020-2024 for the following segments.

  • Product
    • Digital textbooks
    • Digital assessment books
    • Others
  • End-user
    • K-12
    • Higher education
    • Corporate and skill-based
  • Delivery
    • Web-based platforms
    • Mobile applications
    • Learning management systems
  • Geography
    • North America
      • US
      • Canada
      • Mexico
    • Europe
      • Germany
      • UK
      • France
    • APAC
      • China
      • India
      • Japan
    • South America
      • Brazil
      • Argentina
      • Colombia
    • Middle East and Africa
      • Saudi Arabia
      • South Africa
      • UAE
    • Rest of World (ROW)

By Product Insights

The digital textbooks segment is estimated to witness significant growth during the forecast period.

The segment for digital textbooks is evolving beyond static files into dynamic ecosystems. This includes curriculum-based e-textbooks formatted with the EPUB3 format specification and integrated directly into a learning management system.

These platforms often connect with a student information system to streamline rostering and grading. Alongside traditional textbooks, the market offers digital assessment tools and print-on-demand e-textbooks, providing flexibility for diverse learning needs.

In higher education courseware, inclusive access programs are becoming standard, reducing student costs by up to 60% compared to traditional print.

This shift is supported by robust digital classroom infrastructure and secure digital content distribution, which enables features like offline content accessibility while protecting intellectual property through various e-textbook subscription models.

Request Free Sample

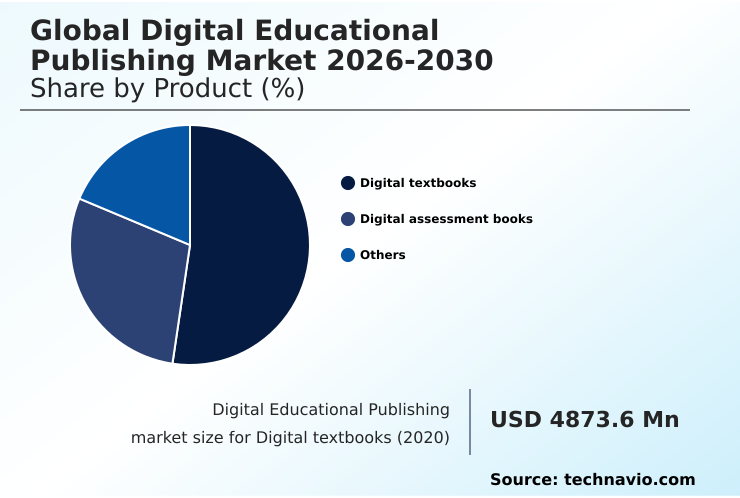
The Digital textbooks segment was valued at USD 8.90 billion in 2024 and showed a gradual increase during the forecast period.

Request Free Sample

Regional Analysis

North America is estimated to contribute 45.7% to the growth of the global market during the forecast period.Technavio’s analysts have elaborately explained the regional trends and drivers that shape the market during the forecast period.

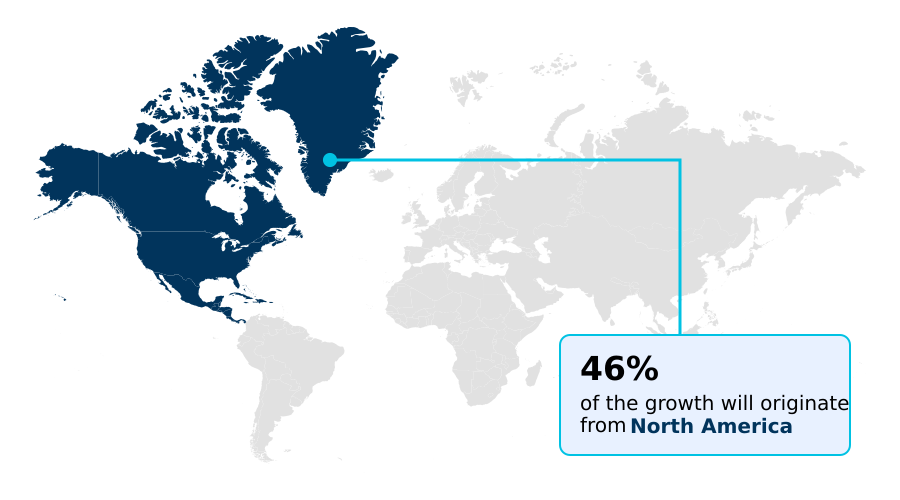
See How Digital Educational Publishing Market Demand is Rising in North America Request Free Sample

The geographic landscape is diverse, with North America leading market development and accounting for approximately 45.7% of the incremental growth. This region benefits from mature digital infrastructure and high adoption rates of virtual learning environments and interactive whiteboard software.

In contrast, the APAC region is the fastest-growing market, driven by government initiatives and the proliferation of mobile-first learning. The widespread use of massive open online courses (MOOCs) in APAC has democratized access to education.

Publishers are localizing offerings, using sophisticated educational content authoring tools to create skill-based training platforms and professional development modules that cater to regional needs.

This includes developing high-quality language learning software and STEM education content, often supported by social learning features and digital badging and credentials to validate skills within a modern learning experience platform.

Market Dynamics

Our researchers analyzed the data with 2025 as the base year, along with the key drivers, trends, and challenges. A holistic analysis of drivers will help companies refine their marketing strategies to gain a competitive advantage.

  • Strategic decision-making in the digital educational publishing market landscape analysis is becoming increasingly complex. Stakeholders must evaluate the efficacy of AI assessment in higher education and the corporate e-learning platform ROI. The OER impact on publishing models continues to challenge traditional revenue streams, forcing companies to innovate.
  • This is seen in the development of gamified language learning apps and blended learning for vocational training. Key technical considerations include secure e-book distribution methods and ensuring digital textbook accessibility compliance. Operationally, the debate between a cloud LMS versus on-premise solutions continues, with cloud adoption showing a 40% lower upfront cost in many institutional deployments.
  • The future of the digital publishing market depends on successful LMS integration for digital textbooks and leveraging a digital publishing API for content integration. As the digital educational market segmentation trends toward personalization, creating solutions for adaptive learning for K-12 math and personalized corporate compliance training becomes critical.
  • Understanding digital publishing by end-user segments, analyzing student engagement analytics, and projecting mobile learning app development costs are vital. The rise of virtual reality labs for science and the analysis of inclusive access model cost-benefit further shape investment priorities in this evolving field.

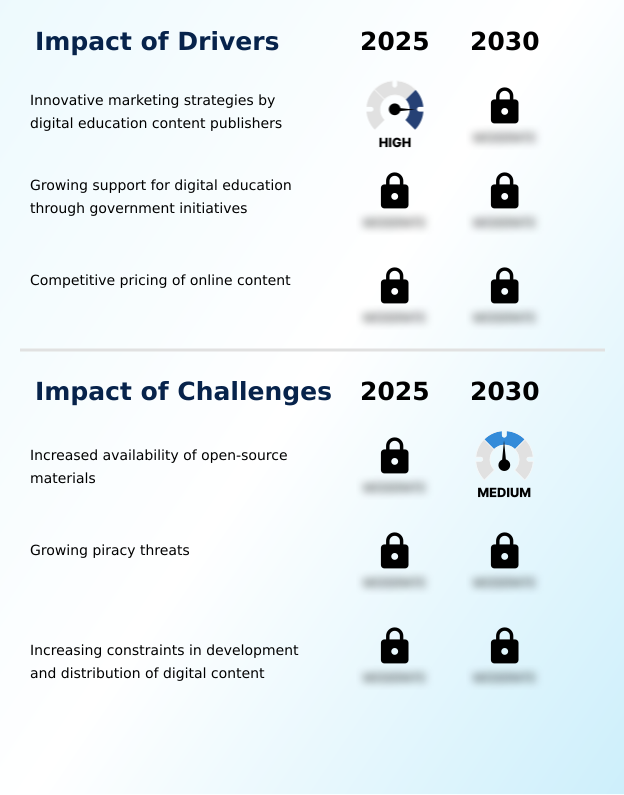
What are the key market drivers leading to the rise in the adoption of Digital Educational Publishing Industry?

  • Innovative marketing strategies from digital education content publishers, including the introduction of cost-effective subscription models, are a key driver stimulating market expansion.

  • Key drivers are centered on accessibility, flexibility, and collaboration. The proliferation of mobile learning applications and cross-platform educational apps supports BYOD educational policy, making learning accessible anywhere.
  • This is underpinned by robust cloud-based learning platform architectures that utilize a content delivery network for efficient global distribution, reducing content load times by an average of 50%.
  • The adoption of blended learning models, which merge digital and in-person instruction, is accelerating. The flipped classroom methodology, supported by curated content from learning object repositories and collaborative learning platforms, improves in-class interaction.
  • Furthermore, the financial and pedagogical appeal of open educational resources is compelling institutions to re-evaluate their content strategies.
  • Seamless courseware integration, facilitated by single sign-on for education and sophisticated content curation platforms, simplifies the user experience, driving an 18% increase in platform adoption within the first year of implementation in many districts.

What are the market trends shaping the Digital Educational Publishing Industry?

  • The growing influence of data analytics in digital education is a significant market trend, enabling the development of personalized learning paths and data-driven instructional strategies.

  • Market trends are coalescing around hyper-personalization and engagement. The use of adaptive learning technology to create personalized learning paths is now a standard expectation, moving beyond static content. This is augmented by the widespread adoption of gamification in education, which has been shown to increase student engagement metrics by up to 40% in some applications.
  • Data-driven instruction, powered by a comprehensive learning analytics dashboard, allows educators to utilize AI-driven assessments for real-time feedback. This enables a shift towards micro-learning modules that cater to shorter attention spans. As a result, interactive student engagement is enhanced through adaptive assessment engines and gamified assessment techniques.
  • The market is also seeing improved interoperability through educational API integration, allowing for tools like digital portfolio tools to be seamlessly incorporated into larger platforms, with user activity tracking improving content recommendations by 25%.

What challenges does the Digital Educational Publishing Industry face during its growth?

  • The increased availability and adoption of high-quality, open-source educational materials and MOOCs pose a significant challenge to the traditional revenue models of digital publishers.

  • The primary challenges involve balancing accessibility with security and maintaining content integrity. Implementing robust digital rights management is crucial to combat piracy, a problem that erodes revenue and devalues intellectual property. As institutions adopt online proctoring technology for remote exams, concerns about student privacy and data security intensify, creating a complex compliance landscape for online proctoring services.
  • The integration of augmented reality in education and virtual reality in education introduces new complexities, requiring significant investment in virtual lab simulations and SCORM compliant content. Ensuring seamless learning tools interoperability between different vendor platforms remains a persistent technical hurdle. Moreover, the rise of unverified information necessitates effective user-generated content moderation.
  • A failure to secure digital content distribution can lead to breaches affecting over 90% of a user base, while also navigating the complexities of competency-based education and providing tools for parent-teacher communication.

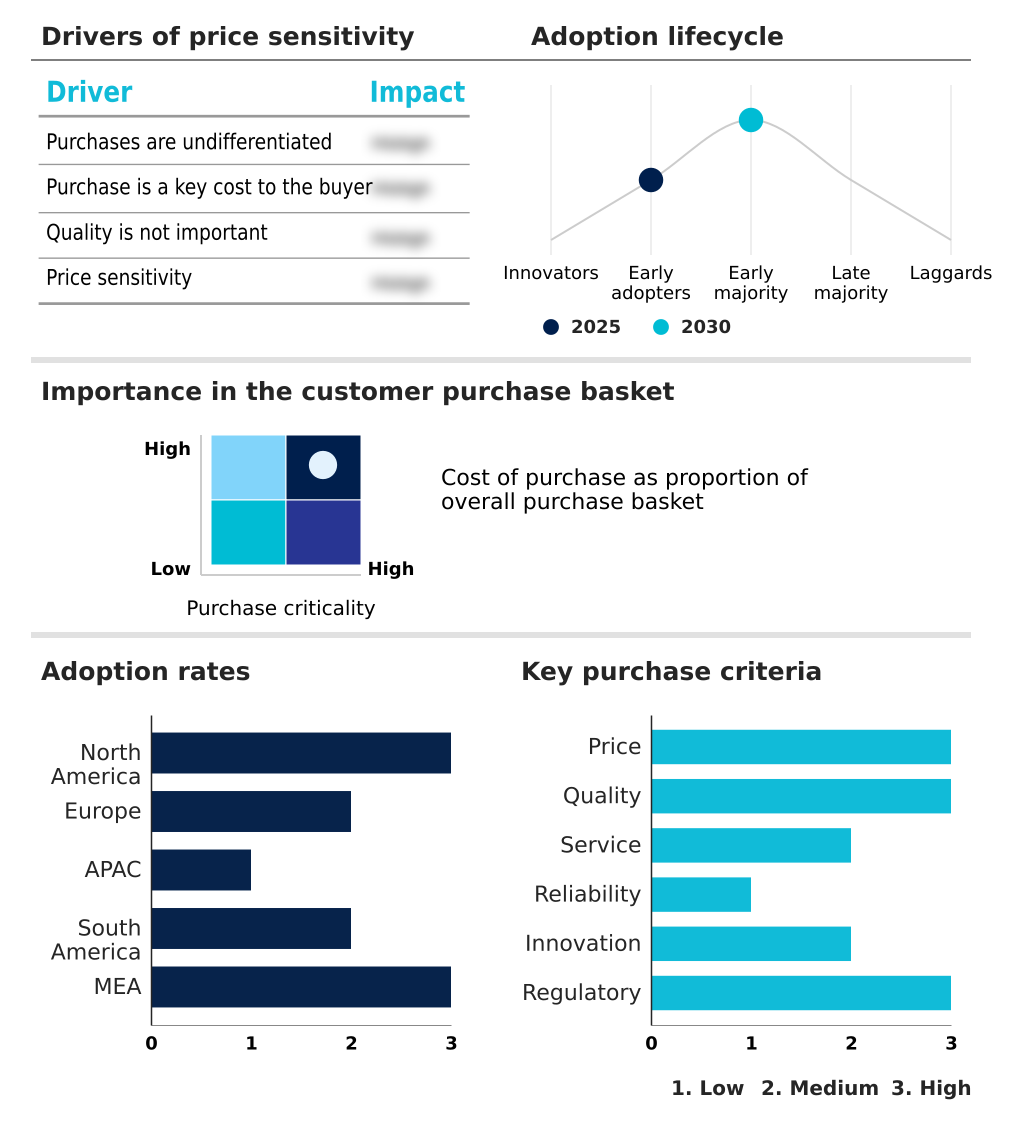
Exclusive Technavio Analysis on Customer Landscape

The digital educational publishing market forecasting report includes the adoption lifecycle of the market, covering from the innovator’s stage to the laggard’s stage. It focuses on adoption rates in different regions based on penetration. Furthermore, the digital educational publishing market report also includes key purchase criteria and drivers of price sensitivity to help companies evaluate and develop their market growth analysis strategies.

Customer Landscape of Digital Educational Publishing Industry

Competitive Landscape

Companies are implementing various strategies, such as strategic alliances, digital educational publishing market forecast, partnerships, mergers and acquisitions, geographical expansion, and product/service launches, to enhance their presence in the industry.

Adobe Inc. - Key offerings center on an integrated digital publishing platform, enabling the creation, management, and secure distribution of educational content for a diverse range of learning environments.

The industry research and growth report includes detailed analyses of the competitive landscape of the market and information about key companies, including:

  • Adobe Inc.
  • Bertelsmann SE and Co. KGaA
  • Coursera Inc.
  • Flatworld Solutions Inc.
  • Georg von Holtzbrinck GmbH
  • Houghton Mifflin Harcourt Co.
  • John Wiley and Sons Inc.
  • McGraw Hill LLC
  • NIIT Ltd.
  • Oxford University Press
  • Pearson Plc
  • RELX Plc
  • Roper Technologies Inc.
  • Scholastic Corp.
  • upGrad Education Pvt. Ltd.
  • Vibal Group Inc.
  • VitalSource Technologies LLC
  • Vivendi SE

Qualitative and quantitative analysis of companies has been conducted to help clients understand the wider business environment as well as the strengths and weaknesses of key industry players. Data is qualitatively analyzed to categorize companies as pure play, category-focused, industry-focused, and diversified; it is quantitatively analyzed to categorize companies as dominant, leading, strong, tentative, and weak.

Recent Development and News in Digital educational publishing market

  • In August 2024, Pearson announced the expansion of its generative AI study tools to a wider array of its higher education eTextbooks and MyLab and Mastering titles, aiming to provide more interactive and personalized student support.
  • In February 2025, McGraw Hill formed a strategic partnership with a generative AI company to develop and launch a new suite of adaptive learning tools tailored for engineering curriculums in North American universities.
  • In March 2025, Pearson VUE launched its Pearson Skilling Partner Program and Skilling Suite, providing an end-to-end solution for commercial training and testing centers focused on vocational education and upskilling.
  • In May 2025, Wiley announced the integration of industry-recognized certification pathways directly into its digital courseware for business and technology, allowing students to earn professional credentials alongside academic degrees.

Dive into Technavio’s robust research methodology, blending expert interviews, extensive data synthesis, and validated models for unparalleled Digital Educational Publishing Market insights. See full methodology.

Market Scope
Page number 294
Base year 2025
Historic period 2020-2024
Forecast period 2026-2030
Growth momentum & CAGR Accelerate at a CAGR of 26.3%
Market growth 2026-2030 USD 44836.2 million
Market structure Fragmented
YoY growth 2025-2026(%) 20.9%
Key countries US, Canada, Mexico, Germany, UK, France, Italy, Spain, The Netherlands, China, India, Japan, South Korea, Australia, Indonesia, Brazil, Argentina, Colombia, Saudi Arabia, South Africa, UAE, Egypt and Turkey
Competitive landscape Leading Companies, Market Positioning of Companies, Competitive Strategies, and Industry Risks

Request Free Sample

Research Analyst Overview

  • The digital educational publishing market is defined by a decisive pivot toward integrated, data-driven learning ecosystems. Boardroom decisions now center on platform strategy rather than individual content assets, weighing investments in proprietary adaptive learning technology against leveraging open educational resources.
  • The deployment of a sophisticated learning analytics dashboard is no longer optional; it is a core component for demonstrating value through measurable student engagement metrics. This involves deep courseware integration with the existing learning management system and student information system.
  • Publishers are building out cloud-based learning platform capabilities, incorporating everything from AI-driven assessments and micro-learning modules to support for BYOD educational policy and inclusive access programs. Success hinges on mastering content delivery network optimization and educational content authoring to support blended learning models and competency-based education.
  • The adoption of such integrated platforms has been shown to reduce administrative content management time by over 30%, allowing institutions to reallocate resources toward pedagogical innovation and personalized learning paths.

What are the Key Data Covered in this Digital Educational Publishing Market Research and Growth Report?

  • What is the expected growth of the Digital Educational Publishing Market between 2026 and 2030?

    • USD 44.84 billion, at a CAGR of 26.3%

  • What segmentation does the market report cover?

    • The report is segmented by Product (Digital textbooks, Digital assessment books, and Others), End-user (K-12, Higher education, and Corporate and skill-based), Delivery (Web-based platforms, Mobile applications, and Learning management systems) and Geography (North America, Europe, APAC, South America, Middle East and Africa)

  • Which regions are analyzed in the report?

    • North America, Europe, APAC, South America and Middle East and Africa

  • What are the key growth drivers and market challenges?

    • Innovative marketing strategies by digital education content publishers, Increased availability of open-source materials

  • Who are the major players in the Digital Educational Publishing Market?

    • Adobe Inc., Bertelsmann SE and Co. KGaA, Coursera Inc., Flatworld Solutions Inc., Georg von Holtzbrinck GmbH, Houghton Mifflin Harcourt Co., John Wiley and Sons Inc., McGraw Hill LLC, NIIT Ltd., Oxford University Press, Pearson Plc, RELX Plc, Roper Technologies Inc., Scholastic Corp., upGrad Education Pvt. Ltd., Vibal Group Inc., VitalSource Technologies LLC and Vivendi SE

Market Research Insights

  • Market dynamics are increasingly shaped by the push for interactive student engagement and improved learning outcomes. The adoption of collaborative learning platforms has been shown to improve project completion rates by over 30% in higher education courseware.
  • Furthermore, the shift to data-driven instruction, powered by advanced student performance tracking, enables educators to tailor K-12 digital curriculum in real-time, boosting test score improvements by an average of 15%. This focus on measurable results drives investment in skill-based training platforms and cross-platform educational apps.
  • The demand for secure digital content distribution and offline content accessibility remains critical, especially as institutions formalize their digital classroom infrastructure and content curation platforms to manage diverse resources effectively.

We can help! Our analysts can customize this digital educational publishing market research report to meet your requirements.

Get in touch

1. Executive Summary

1.1 Market overview

Executive Summary - Chart on Market Overview
Executive Summary - Data Table on Market Overview
Executive Summary - Chart on Global Market Characteristics
Executive Summary - Chart on Market by Geography
Executive Summary - Chart on Market Segmentation by Product
Executive Summary - Chart on Market Segmentation by End-user
Executive Summary - Chart on Market Segmentation by Delivery
Executive Summary - Chart on Incremental Growth
Executive Summary - Data Table on Incremental Growth
Executive Summary - Chart on Company Market Positioning

2. Technavio Analysis

2.1 Analysis of price sensitivity, lifecycle, customer purchase basket, adoption rates, and purchase criteria

2.2 Criticality of inputs and Factors of differentiation

Chart on Overview on criticality of inputs and factors of differentiation

2.3 Factors of disruption

Chart on Overview on factors of disruption

2.4 Impact of drivers and challenges

Chart on Impact of drivers and challenges in 2025 and 2030

3. Market Landscape

3.1 Market ecosystem

Chart on Parent Market
Data Table on - Parent Market

3.2 Market characteristics

Chart on Market characteristics analysis

3.3 Value chain analysis

Chart on Value chain analysis

4. Market Sizing

4.1 Market definition

Data Table on Offerings of companies included in the market definition

4.2 Market segment analysis

Market segments

4.3 Market size 2025

4.4 Market outlook: Forecast for 2025-2030

Chart on Global - Market size and forecast 2025-2030 ($ million)
Data Table on Global - Market size and forecast 2025-2030 ($ million)
Chart on Global Market: Year-over-year growth 2025-2030 (%)
Data Table on Global Market: Year-over-year growth 2025-2030 (%)

5. Historic Market Size

5.1 Global Digital Educational Publishing Market 2020 - 2024

Historic Market Size - Data Table on Global Digital Educational Publishing Market 2020 - 2024 ($ million)

5.2 Product segment analysis 2020 - 2024

Historic Market Size - Product Segment 2020 - 2024 ($ million)

5.3 End-user segment analysis 2020 - 2024

Historic Market Size - End-user Segment 2020 - 2024 ($ million)

5.4 Delivery segment analysis 2020 - 2024

Historic Market Size - Delivery Segment 2020 - 2024 ($ million)

5.5 Geography segment analysis 2020 - 2024

Historic Market Size - Geography Segment 2020 - 2024 ($ million)

5.6 Country segment analysis 2020 - 2024

Historic Market Size - Country Segment 2020 - 2024 ($ million)

6. Qualitative Analysis

6.1 The AI impact on Global Digital Educational Publishing Market

7. Five Forces Analysis

7.1 Five forces summary

Five forces analysis - Comparison between 2025 and 2030

7.2 Bargaining power of buyers

Bargaining power of buyers - Impact of key factors 2025 and 2030

7.3 Bargaining power of suppliers

Bargaining power of suppliers - Impact of key factors in 2025 and 2030

7.4 Threat of new entrants

Threat of new entrants - Impact of key factors in 2025 and 2030

7.5 Threat of substitutes

Threat of substitutes - Impact of key factors in 2025 and 2030

7.6 Threat of rivalry

Threat of rivalry - Impact of key factors in 2025 and 2030

7.7 Market condition

Chart on Market condition - Five forces 2025 and 2030

8. Market Segmentation by Product

8.1 Market segments

Chart on Product - Market share 2025-2030 (%)
Data Table on Product - Market share 2025-2030 (%)

8.2 Comparison by Product

Chart on Comparison by Product
Data Table on Comparison by Product

8.3 Digital textbooks - Market size and forecast 2025-2030

Chart on Digital textbooks - Market size and forecast 2025-2030 ($ million)
Data Table on Digital textbooks - Market size and forecast 2025-2030 ($ million)
Chart on Digital textbooks - Year-over-year growth 2025-2030 (%)
Data Table on Digital textbooks - Year-over-year growth 2025-2030 (%)

8.4 Digital assessment books - Market size and forecast 2025-2030

Chart on Digital assessment books - Market size and forecast 2025-2030 ($ million)
Data Table on Digital assessment books - Market size and forecast 2025-2030 ($ million)
Chart on Digital assessment books - Year-over-year growth 2025-2030 (%)
Data Table on Digital assessment books - Year-over-year growth 2025-2030 (%)

8.5 Others - Market size and forecast 2025-2030

Chart on Others - Market size and forecast 2025-2030 ($ million)
Data Table on Others - Market size and forecast 2025-2030 ($ million)
Chart on Others - Year-over-year growth 2025-2030 (%)
Data Table on Others - Year-over-year growth 2025-2030 (%)

8.6 Market opportunity by Product

Market opportunity by Product ($ million)
Data Table on Market opportunity by Product ($ million)

9. Market Segmentation by End-user

9.1 Market segments

Chart on End-user - Market share 2025-2030 (%)
Data Table on End-user - Market share 2025-2030 (%)

9.2 Comparison by End-user

Chart on Comparison by End-user
Data Table on Comparison by End-user

9.3 K-12 - Market size and forecast 2025-2030

Chart on K-12 - Market size and forecast 2025-2030 ($ million)
Data Table on K-12 - Market size and forecast 2025-2030 ($ million)
Chart on K-12 - Year-over-year growth 2025-2030 (%)
Data Table on K-12 - Year-over-year growth 2025-2030 (%)

9.4 Higher education - Market size and forecast 2025-2030

Chart on Higher education - Market size and forecast 2025-2030 ($ million)
Data Table on Higher education - Market size and forecast 2025-2030 ($ million)
Chart on Higher education - Year-over-year growth 2025-2030 (%)
Data Table on Higher education - Year-over-year growth 2025-2030 (%)

9.5 Corporate and skill-based - Market size and forecast 2025-2030

Chart on Corporate and skill-based - Market size and forecast 2025-2030 ($ million)
Data Table on Corporate and skill-based - Market size and forecast 2025-2030 ($ million)
Chart on Corporate and skill-based - Year-over-year growth 2025-2030 (%)
Data Table on Corporate and skill-based - Year-over-year growth 2025-2030 (%)

9.6 Market opportunity by End-user

Market opportunity by End-user ($ million)
Data Table on Market opportunity by End-user ($ million)

10. Market Segmentation by Delivery

10.1 Market segments

Chart on Delivery - Market share 2025-2030 (%)
Data Table on Delivery - Market share 2025-2030 (%)

10.2 Comparison by Delivery

Chart on Comparison by Delivery
Data Table on Comparison by Delivery

10.3 Web-based platforms - Market size and forecast 2025-2030

Chart on Web-based platforms - Market size and forecast 2025-2030 ($ million)
Data Table on Web-based platforms - Market size and forecast 2025-2030 ($ million)
Chart on Web-based platforms - Year-over-year growth 2025-2030 (%)
Data Table on Web-based platforms - Year-over-year growth 2025-2030 (%)

10.4 Mobile applications - Market size and forecast 2025-2030

Chart on Mobile applications - Market size and forecast 2025-2030 ($ million)
Data Table on Mobile applications - Market size and forecast 2025-2030 ($ million)
Chart on Mobile applications - Year-over-year growth 2025-2030 (%)
Data Table on Mobile applications - Year-over-year growth 2025-2030 (%)

10.5 Learning management systems - Market size and forecast 2025-2030

Chart on Learning management systems - Market size and forecast 2025-2030 ($ million)
Data Table on Learning management systems - Market size and forecast 2025-2030 ($ million)
Chart on Learning management systems - Year-over-year growth 2025-2030 (%)
Data Table on Learning management systems - Year-over-year growth 2025-2030 (%)

10.6 Market opportunity by Delivery

Market opportunity by Delivery ($ million)
Data Table on Market opportunity by Delivery ($ million)

11. Customer Landscape

11.1 Customer landscape overview

Analysis of price sensitivity, lifecycle, customer purchase basket, adoption rates, and purchase criteria

12. Geographic Landscape

12.1 Geographic segmentation

Chart on Market share by geography 2025-2030 (%)
Data Table on Market share by geography 2025-2030 (%)

12.2 Geographic comparison

Chart on Geographic comparison
Data Table on Geographic comparison

12.3 North America - Market size and forecast 2025-2030

Chart on North America - Market size and forecast 2025-2030 ($ million)
Data Table on North America - Market size and forecast 2025-2030 ($ million)
Chart on North America - Year-over-year growth 2025-2030 (%)
Data Table on North America - Year-over-year growth 2025-2030 (%)
Chart on Regional Comparison - North America
Data Table on Regional Comparison - North America

12.3.1 US - Market size and forecast 2025-2030

Chart on US - Market size and forecast 2025-2030 ($ million)
Data Table on US - Market size and forecast 2025-2030 ($ million)
Chart on US - Year-over-year growth 2025-2030 (%)
Data Table on US - Year-over-year growth 2025-2030 (%)

12.3.2 Canada - Market size and forecast 2025-2030

Chart on Canada - Market size and forecast 2025-2030 ($ million)
Data Table on Canada - Market size and forecast 2025-2030 ($ million)
Chart on Canada - Year-over-year growth 2025-2030 (%)
Data Table on Canada - Year-over-year growth 2025-2030 (%)

12.3.3 Mexico - Market size and forecast 2025-2030

Chart on Mexico - Market size and forecast 2025-2030 ($ million)
Data Table on Mexico - Market size and forecast 2025-2030 ($ million)
Chart on Mexico - Year-over-year growth 2025-2030 (%)
Data Table on Mexico - Year-over-year growth 2025-2030 (%)

12.4 Europe - Market size and forecast 2025-2030

Chart on Europe - Market size and forecast 2025-2030 ($ million)
Data Table on Europe - Market size and forecast 2025-2030 ($ million)
Chart on Europe - Year-over-year growth 2025-2030 (%)
Data Table on Europe - Year-over-year growth 2025-2030 (%)
Chart on Regional Comparison - Europe
Data Table on Regional Comparison - Europe

12.4.1 Germany - Market size and forecast 2025-2030

Chart on Germany - Market size and forecast 2025-2030 ($ million)
Data Table on Germany - Market size and forecast 2025-2030 ($ million)
Chart on Germany - Year-over-year growth 2025-2030 (%)
Data Table on Germany - Year-over-year growth 2025-2030 (%)

12.4.2 UK - Market size and forecast 2025-2030

Chart on UK - Market size and forecast 2025-2030 ($ million)
Data Table on UK - Market size and forecast 2025-2030 ($ million)
Chart on UK - Year-over-year growth 2025-2030 (%)
Data Table on UK - Year-over-year growth 2025-2030 (%)

12.4.3 France - Market size and forecast 2025-2030

Chart on France - Market size and forecast 2025-2030 ($ million)
Data Table on France - Market size and forecast 2025-2030 ($ million)
Chart on France - Year-over-year growth 2025-2030 (%)
Data Table on France - Year-over-year growth 2025-2030 (%)

12.4.4 Italy - Market size and forecast 2025-2030

Chart on Italy - Market size and forecast 2025-2030 ($ million)
Data Table on Italy - Market size and forecast 2025-2030 ($ million)
Chart on Italy - Year-over-year growth 2025-2030 (%)
Data Table on Italy - Year-over-year growth 2025-2030 (%)

12.4.5 Spain - Market size and forecast 2025-2030

Chart on Spain - Market size and forecast 2025-2030 ($ million)
Data Table on Spain - Market size and forecast 2025-2030 ($ million)
Chart on Spain - Year-over-year growth 2025-2030 (%)
Data Table on Spain - Year-over-year growth 2025-2030 (%)

12.4.6 The Netherlands - Market size and forecast 2025-2030

Chart on The Netherlands - Market size and forecast 2025-2030 ($ million)
Data Table on The Netherlands - Market size and forecast 2025-2030 ($ million)
Chart on The Netherlands - Year-over-year growth 2025-2030 (%)
Data Table on The Netherlands - Year-over-year growth 2025-2030 (%)

12.5 APAC - Market size and forecast 2025-2030

Chart on APAC - Market size and forecast 2025-2030 ($ million)
Data Table on APAC - Market size and forecast 2025-2030 ($ million)
Chart on APAC - Year-over-year growth 2025-2030 (%)
Data Table on APAC - Year-over-year growth 2025-2030 (%)
Chart on Regional Comparison - APAC
Data Table on Regional Comparison - APAC

12.5.1 China - Market size and forecast 2025-2030

Chart on China - Market size and forecast 2025-2030 ($ million)
Data Table on China - Market size and forecast 2025-2030 ($ million)
Chart on China - Year-over-year growth 2025-2030 (%)
Data Table on China - Year-over-year growth 2025-2030 (%)

12.5.2 India - Market size and forecast 2025-2030

Chart on India - Market size and forecast 2025-2030 ($ million)
Data Table on India - Market size and forecast 2025-2030 ($ million)
Chart on India - Year-over-year growth 2025-2030 (%)
Data Table on India - Year-over-year growth 2025-2030 (%)

12.5.3 Japan - Market size and forecast 2025-2030

Chart on Japan - Market size and forecast 2025-2030 ($ million)
Data Table on Japan - Market size and forecast 2025-2030 ($ million)
Chart on Japan - Year-over-year growth 2025-2030 (%)
Data Table on Japan - Year-over-year growth 2025-2030 (%)

12.5.4 South Korea - Market size and forecast 2025-2030

Chart on South Korea - Market size and forecast 2025-2030 ($ million)
Data Table on South Korea - Market size and forecast 2025-2030 ($ million)
Chart on South Korea - Year-over-year growth 2025-2030 (%)
Data Table on South Korea - Year-over-year growth 2025-2030 (%)

12.5.5 Australia - Market size and forecast 2025-2030

Chart on Australia - Market size and forecast 2025-2030 ($ million)
Data Table on Australia - Market size and forecast 2025-2030 ($ million)
Chart on Australia - Year-over-year growth 2025-2030 (%)
Data Table on Australia - Year-over-year growth 2025-2030 (%)

12.5.6 Indonesia - Market size and forecast 2025-2030

Chart on Indonesia - Market size and forecast 2025-2030 ($ million)
Data Table on Indonesia - Market size and forecast 2025-2030 ($ million)
Chart on Indonesia - Year-over-year growth 2025-2030 (%)
Data Table on Indonesia - Year-over-year growth 2025-2030 (%)

12.6 South America - Market size and forecast 2025-2030

Chart on South America - Market size and forecast 2025-2030 ($ million)
Data Table on South America - Market size and forecast 2025-2030 ($ million)
Chart on South America - Year-over-year growth 2025-2030 (%)
Data Table on South America - Year-over-year growth 2025-2030 (%)
Chart on Regional Comparison - South America
Data Table on Regional Comparison - South America

12.6.1 Brazil - Market size and forecast 2025-2030

Chart on Brazil - Market size and forecast 2025-2030 ($ million)
Data Table on Brazil - Market size and forecast 2025-2030 ($ million)
Chart on Brazil - Year-over-year growth 2025-2030 (%)
Data Table on Brazil - Year-over-year growth 2025-2030 (%)

12.6.2 Argentina - Market size and forecast 2025-2030

Chart on Argentina - Market size and forecast 2025-2030 ($ million)
Data Table on Argentina - Market size and forecast 2025-2030 ($ million)
Chart on Argentina - Year-over-year growth 2025-2030 (%)
Data Table on Argentina - Year-over-year growth 2025-2030 (%)

12.6.3 Colombia - Market size and forecast 2025-2030

Chart on Colombia - Market size and forecast 2025-2030 ($ million)
Data Table on Colombia - Market size and forecast 2025-2030 ($ million)
Chart on Colombia - Year-over-year growth 2025-2030 (%)
Data Table on Colombia - Year-over-year growth 2025-2030 (%)

12.7 Middle East and Africa - Market size and forecast 2025-2030

Chart on Middle East and Africa - Market size and forecast 2025-2030 ($ million)
Data Table on Middle East and Africa - Market size and forecast 2025-2030 ($ million)
Chart on Middle East and Africa - Year-over-year growth 2025-2030 (%)
Data Table on Middle East and Africa - Year-over-year growth 2025-2030 (%)
Chart on Regional Comparison - Middle East and Africa
Data Table on Regional Comparison - Middle East and Africa

12.7.1 Saudi Arabia - Market size and forecast 2025-2030

Chart on Saudi Arabia - Market size and forecast 2025-2030 ($ million)
Data Table on Saudi Arabia - Market size and forecast 2025-2030 ($ million)
Chart on Saudi Arabia - Year-over-year growth 2025-2030 (%)
Data Table on Saudi Arabia - Year-over-year growth 2025-2030 (%)

12.7.2 South Africa - Market size and forecast 2025-2030

Chart on South Africa - Market size and forecast 2025-2030 ($ million)
Data Table on South Africa - Market size and forecast 2025-2030 ($ million)
Chart on South Africa - Year-over-year growth 2025-2030 (%)
Data Table on South Africa - Year-over-year growth 2025-2030 (%)

12.7.3 UAE - Market size and forecast 2025-2030

Chart on UAE - Market size and forecast 2025-2030 ($ million)
Data Table on UAE - Market size and forecast 2025-2030 ($ million)
Chart on UAE - Year-over-year growth 2025-2030 (%)
Data Table on UAE - Year-over-year growth 2025-2030 (%)

12.7.4 Egypt - Market size and forecast 2025-2030

Chart on Egypt - Market size and forecast 2025-2030 ($ million)
Data Table on Egypt - Market size and forecast 2025-2030 ($ million)
Chart on Egypt - Year-over-year growth 2025-2030 (%)
Data Table on Egypt - Year-over-year growth 2025-2030 (%)

12.7.5 Turkey - Market size and forecast 2025-2030

Chart on Turkey - Market size and forecast 2025-2030 ($ million)
Data Table on Turkey - Market size and forecast 2025-2030 ($ million)
Chart on Turkey - Year-over-year growth 2025-2030 (%)
Data Table on Turkey - Year-over-year growth 2025-2030 (%)

12.8 Market opportunity by geography

Market opportunity by geography ($ million)
Data Tables on Market opportunity by geography ($ million)

13. Drivers, Challenges, and Opportunity

13.1 Market drivers

Innovative marketing strategies by digital education content publishers
Growing support for digital education through government initiatives
Competitive pricing of online content

13.2 Market challenges

Increased availability of open-source materials
Growing piracy threats
Increasing constraints in development and distribution of digital content

13.3 Impact of drivers and challenges

Impact of drivers and challenges in 2025 and 2030

13.4 Market opportunities

Growing influence of data analytics in digital education
Growing shift toward content customization
Rising prominence of digital educational publishing in non-english-speaking countries

14. Competitive Landscape

14.1 Overview

14.2

Overview on criticality of inputs and factors of differentiation

14.3 Landscape disruption

Overview on factors of disruption

14.4 Industry risks

Impact of key risks on business

15. Competitive Analysis

15.1 Companies profiled

Companies covered

15.2 Company ranking index

15.3 Market positioning of companies

Matrix on companies position and classification

15.4 Adobe Inc.

Adobe Inc. - Overview
Adobe Inc. - Business segments
Adobe Inc. - Key news
Adobe Inc. - Key offerings
Adobe Inc. - Segment focus
SWOT

15.5 Bertelsmann SE and Co. KGaA

Bertelsmann SE and Co. KGaA - Overview
Bertelsmann SE and Co. KGaA - Business segments
Bertelsmann SE and Co. KGaA - Key offerings
Bertelsmann SE and Co. KGaA - Segment focus
SWOT

15.6 Coursera Inc.

Coursera Inc. - Overview
Coursera Inc. - Business segments
Coursera Inc. - Key news
Coursera Inc. - Key offerings
Coursera Inc. - Segment focus
SWOT

15.7 Flatworld Solutions Inc.

Flatworld Solutions Inc. - Overview
Flatworld Solutions Inc. - Product / Service
Flatworld Solutions Inc. - Key offerings
SWOT

15.8 Georg von Holtzbrinck GmbH

Georg von Holtzbrinck GmbH - Overview
Georg von Holtzbrinck GmbH - Product / Service
Georg von Holtzbrinck GmbH - Key offerings
SWOT

15.9 Houghton Mifflin Harcourt Co.

Houghton Mifflin Harcourt Co. - Overview
Houghton Mifflin Harcourt Co. - Product / Service
Houghton Mifflin Harcourt Co. - Key news
Houghton Mifflin Harcourt Co. - Key offerings
SWOT

15.10 John Wiley and Sons Inc.

John Wiley and Sons Inc. - Overview
John Wiley and Sons Inc. - Business segments
John Wiley and Sons Inc. - Key offerings
John Wiley and Sons Inc. - Segment focus
SWOT

15.11 McGraw Hill LLC

McGraw Hill LLC - Overview
McGraw Hill LLC - Product / Service
McGraw Hill LLC - Key news
McGraw Hill LLC - Key offerings
SWOT

15.12 Oxford University Press

Oxford University Press - Overview
Oxford University Press - Product / Service
Oxford University Press - Key offerings
SWOT

15.13 Pearson Plc

Pearson Plc - Overview
Pearson Plc - Business segments
Pearson Plc - Key news
Pearson Plc - Key offerings
Pearson Plc - Segment focus
SWOT

15.14 RELX Plc

RELX Plc - Overview
RELX Plc - Business segments
RELX Plc - Key offerings
RELX Plc - Segment focus
SWOT

15.15 Scholastic Corp.

Scholastic Corp. - Overview
Scholastic Corp. - Business segments
Scholastic Corp. - Key offerings
Scholastic Corp. - Segment focus
SWOT

15.16 upGrad Education Pvt. Ltd.

upGrad Education Pvt. Ltd. - Overview
upGrad Education Pvt. Ltd. - Product / Service
upGrad Education Pvt. Ltd. - Key offerings
SWOT

15.17 Vibal Group Inc.

Vibal Group Inc. - Overview
Vibal Group Inc. - Product / Service
Vibal Group Inc. - Key offerings
SWOT

15.18 Vivendi SE

Vivendi SE - Overview
Vivendi SE - Business segments
Vivendi SE - Key offerings
Vivendi SE - Segment focus
SWOT

16. Appendix

16.1 Scope of the report

Market definition
Objectives
Notes and caveats

16.2 Inclusions and exclusions checklist

Inclusions checklist
Exclusions checklist

16.3 Currency conversion rates for US$

16.4 Research methodology

16.5 Data procurement

Information sources

16.6 Data validation

16.7 Validation techniques employed for market sizing

16.8 Data synthesis

16.9 360 degree market analysis

16.10 List of abbreviations

Research Methodology

Technavio presents a detailed picture of the market by way of study, synthesis, and summation of data from multiple sources. The analysts have presented the various facets of the market with a particular focus on identifying the key industry influencers. The data thus presented is comprehensive, reliable, and the result of extensive research, both primary and secondary.

INFORMATION SOURCES

Primary sources

  • Manufacturers and suppliers
  • Channel partners
  • Industry experts
  • Strategic decision makers

Secondary sources

  • Industry journals and periodicals
  • Government data
  • Financial reports of key industry players
  • Historical data
  • Press releases

DATA ANALYSIS

Data Synthesis

  • Collation of data
  • Estimation of key figures
  • Analysis of derived insights

Data Validation

  • Triangulation with data models
  • Reference against proprietary databases
  • Corroboration with industry experts

REPORT WRITING

Qualitative

  • Market drivers
  • Market challenges
  • Market trends
  • Five forces analysis

Quantitative

  • Market size and forecast
  • Market segmentation
  • Geographical insights
  • Competitive landscape

Interested in this report?

Get your sample now to see our research methodology and insights!

Download Now

Frequently Asked Questions

Digital Educational Publishing market growth will increase by USD 44836.2 million during 2026-2030.

The Digital Educational Publishing market is expected to grow at a CAGR of 26.3% during 2026-2030.

Digital Educational Publishing market is segmented by Product (Digital textbooks, Digital assessment books, Others) End-user (K-12, Higher education, Corporate and skill-based) Delivery (Web-based platforms, Mobile applications, Learning management systems)

Adobe Inc., Bertelsmann SE and Co. KGaA, Coursera Inc., Flatworld Solutions Inc., Georg von Holtzbrinck GmbH, Houghton Mifflin Harcourt Co., John Wiley and Sons Inc., McGraw Hill LLC, NIIT Ltd., Oxford University Press, Pearson Plc, RELX Plc, Roper Technologies Inc., Scholastic Corp., upGrad Education Pvt. Ltd., Vibal Group Inc., VitalSource Technologies LLC, Vivendi SE are a few of the key vendors in the Digital Educational Publishing market.

North America will register the highest growth rate of 45.7% among the other regions. Therefore, the Digital Educational Publishing market in North America is expected to garner significant business opportunities for the vendors during the forecast period.

US, Canada, Mexico, Germany, UK, France, Italy, Spain, The Netherlands, China, India, Japan, South Korea, Australia, Indonesia, Brazil, Argentina, Colombia, Saudi Arabia, South Africa, UAE, Egypt, Turkey

  • Innovative marketing strategies by digital education content publishers is the driving factor this market.

The Digital Educational Publishing market vendors should focus on grabbing business opportunities from the Product segment as it accounted for the largest market share in the base year.