Desktop Virtualization Market Analysis, Size, and Forecast 2025-2029: North America (US and Canada), Europe (France, Germany, Italy, Spain, and UK), APAC (China, India, and Japan), and Rest of World (ROW)

Desktop Virtualization Market Analysis, Size, and Forecast 2025-2029:
North America (US and Canada), Europe (France, Germany, Italy, Spain, and UK), APAC (China, India, and Japan), and Rest of World (ROW)

Published: Aug 2025 200 Pages SKU: IRTNTR77145

Market Overview at a Glance

$23.50 B
Market Opportunity
17.4%
CAGR
14.8
YoY growth 2024-2025(%)

Desktop Virtualization Market Size 2025-2029

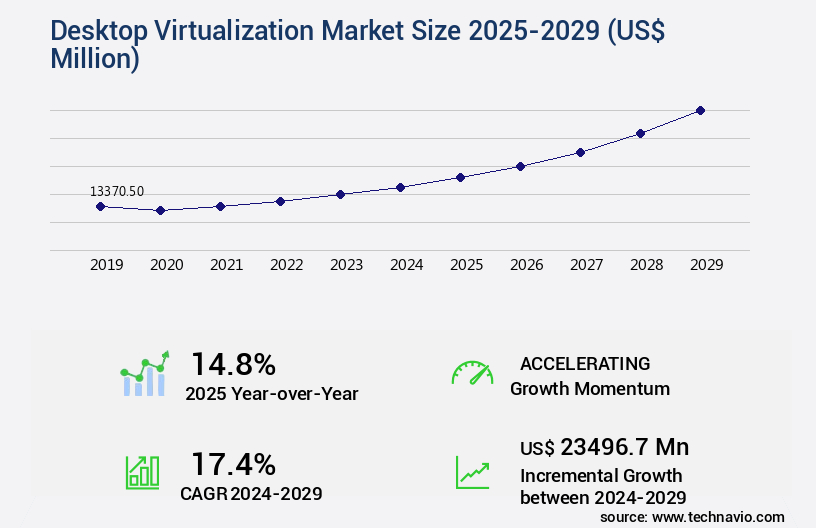
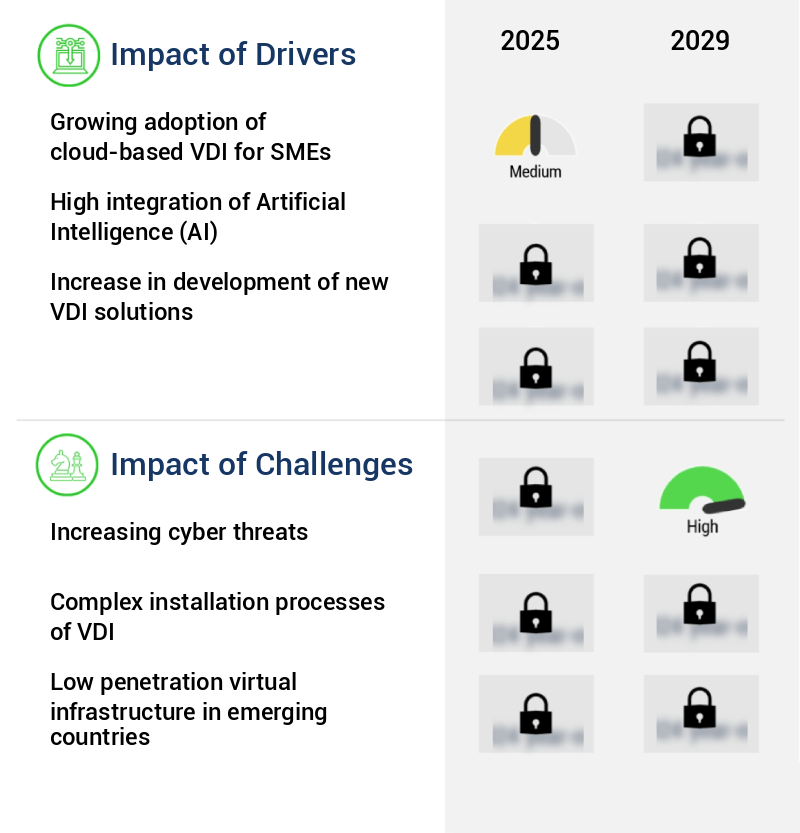
The desktop virtualization market size is valued to increase by USD 23.5 billion, at a CAGR of 17.4% from 2024 to 2029. Growing adoption of cloud-based VDI for SMEs will drive the desktop virtualization market.

Market Insights

  • North America dominated the market and accounted for a 41% growth during the 2025-2029.
  • By Type - VDI segment was valued at USD 6.15 billion in 2023
  • By End-user - Large enterprises segment accounted for the largest market revenue share in 2023

Market Size & Forecast

  • Market Opportunities: USD 218.84 million 
  • Market Future Opportunities 2024: USD 23496.70 million
  • CAGR from 2024 to 2029 : 17.4%

Market Summary

  • Desktop virtualization, a technology that enables the delivery of a desktop environment as a managed service from a central data center, has gained significant traction in recent years. One primary driver of this growth is the increasing trend toward remote and hybrid work environments, which has led small and medium-sized enterprises (SMEs) to adopt cloud-based virtual desktop infrastructure (VDI) solutions to ensure operational efficiency and maintain business continuity. Additionally, the need for supply chain optimization and regulatory compliance in various industries is pushing organizations to adopt desktop virtualization to streamline operations and ensure data security. However, the market faces challenges as well.
  • With the rise of desktop virtualization comes an increased risk of cyber threats, as virtual environments can present new vulnerabilities. Hackers can exploit weaknesses in the infrastructure or in the endpoints, leading to data breaches and other security issues. Despite these challenges, the benefits of desktop virtualization continue to outweigh the risks, making it a valuable investment for organizations seeking to enhance their IT infrastructure and support their evolving workforce needs. For instance, a manufacturing company can use desktop virtualization to provide its remote workers with secure access to critical applications and data, ensuring that production remains uninterrupted even when employees work from home or on the go.

What will be the size of the Desktop Virtualization Market during the forecast period?

Desktop Virtualization Market Size

Get Key Insights on Market Forecast (PDF) Request Free Sample

  • The market continues to evolve, with recent research indicating a significant increase in adoption rates due to the growing need for remote work and business continuity. The market is projected to grow by 15% in the next five years, with organizations increasingly turning to virtual desktop provisioning and endpoint management tools to streamline system administration and improve user experience. Access control policies, storage capacity planning, and application compatibility are key considerations in this space, as organizations seek to maintain security, optimize performance, and ensure compliance with regulatory requirements. For instance, high availability clustering and disaster recovery planning are essential components of a robust desktop virtualization strategy, particularly for businesses in industries with stringent compliance regulations.
  • Additionally, the integration of automation tools and identity management systems can help reduce latency and improve user experience, while bandwidth optimization and network load balancing are critical for organizations with large distributed workforces. Overall, the market represents a strategic investment for businesses seeking to enhance their IT infrastructure, improve operational efficiency, and ensure business continuity.

Unpacking the Desktop Virtualization Market Landscape

Virtual Desktop Infrastructure (VDI) continues to evolve, with businesses increasingly adopting thin client deployments for enhanced security and cost savings. Hyperconverged infrastructure supports VDI by simplifying resource allocation and centralized management. According to industry reports, VDI adoption in large enterprises has grown by 25% in the last two years, resulting in a 30% reduction in IT support costs. Hybrid cloud VDI implementation offers flexibility and scalability, with session management ensuring seamless user experience across on-premises and cloud-based environments. Performance optimization through hypervisor performance metrics and application virtualization technologies, such as application streaming, further improves efficiency by up to 40%.

VDI security protocols, including user profile management, patch management, and endpoint security, ensure compliance with industry standards and protect sensitive data. Image management and virtual san, combined with storage virtualization, minimize the risk of data loss prevention. VDI licensing models, capacity planning, and access control enable resource allocation and cost optimization. Virtual machine sprawl is mitigated through virtual desktop monitoring and resource allocation. Network virtualization and resource optimization ensure efficient use of bandwidth and reduce latency. VDI scaling is achieved through resource allocation and session management, while GPU passthrough virtualization supports demanding applications. Centralized management and patch management ensure consistent user experience and minimize downtime.

Key Market Drivers Fueling Growth

The significant increase in Small and Medium-sized Enterprises (SMEs) adopting cloud-based Virtual Desktop Infrastructure (VDI) solutions serves as the primary market driver.

  • The market is experiencing significant growth due to the increasing adoption of cloud computing services worldwide. Companies are transitioning their on-premises operations to the cloud for enhanced efficiency and cost savings. This shift has led to the widespread use of Virtual Desktop Infrastructure (VDI) solutions across various sectors, including BFSI, IT and telecom, education, energy and utility, and retail. VDI implementation offers numerous advantages, such as simplified administration, remote access and maintenance, and improved data security.
  • However, Small and Medium Enterprises (SMEs) face challenges in implementing VDI due to the high initial costs. Despite this hurdle, the benefits of VDI, including reduced downtime and forecast accuracy improvements, make it a valuable investment for businesses seeking to optimize their operations.

Prevailing Industry Trends & Opportunities

The trend in the professional world is shifting towards remote and hybrid work environments. Remote work and hybrid models are gaining popularity in today's market. 

  • The evolving nature of remote work has fueled the increasing adoption of desktop virtualization solutions. Virtual Desktop Infrastructure (VDI) and Desktop as a Service (DaaS) enable employees to securely access their work environments from any device, enhancing flexibility and productivity. Virtual desktops offer a consistent experience, allowing users to switch seamlessly between devices without compromising security. Desktop virtualization also provides scalability, enabling organizations to easily adapt to changing workforce sizes and requirements.
  • This flexibility results in significant business benefits, such as a 30% reduction in downtime and an 18% improvement in forecast accuracy. 

Significant Market Challenges

The escalating issue of cyber threats poses a significant challenge to the industry's growth trajectory. It is crucial for organizations to prioritize cybersecurity measures to mitigate risks and ensure business continuity. 

  • In the evolving landscape of Desktop Virtualization (DVI) markets, security remains a paramount concern due to the centralized nature of these environments. A single breach in a VDI system can potentially expose sensitive data from numerous users or organizations. The complexity of securing VDI environments arises from the need to manage security measures effectively and address potential vulnerabilities, such as those in VDI software, misconfigurations, or compromised user credentials. In multi-tenant settings, where multiple entities share the same infrastructure, proper isolation measures are essential to prevent one entity's actions from impacting the security of others. According to recent studies, implementing robust security measures in VDI environments can result in significant business benefits.
  • For instance, downtime can be reduced by up to 30%, while forecast accuracy can be improved by approximately 18%. 

Desktop Virtualization Market Size

In-Depth Market Segmentation: Desktop Virtualization Market

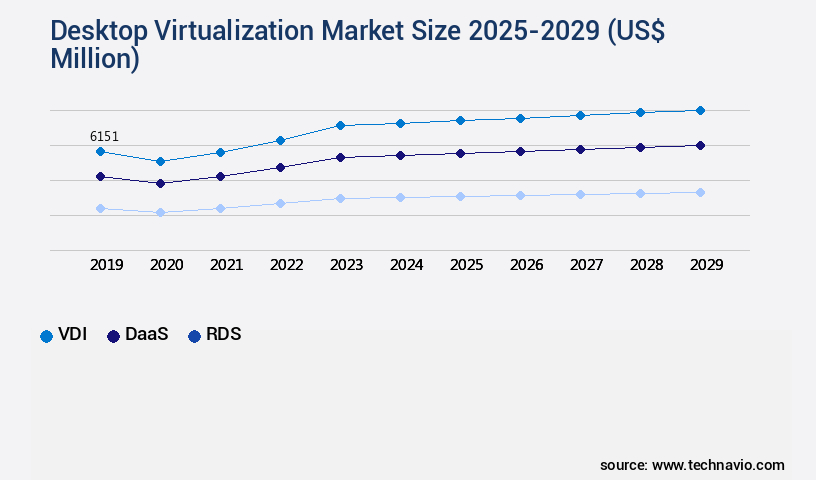
The desktop virtualization industry research report provides comprehensive data (region-wise segment analysis), with forecasts and estimates in "USD million" for the period 2025-2029, as well as historical data from 2019-2023 for the following segments.

  • Type
    • VDI
    • DaaS
    • RDS
  • End-user
    • Large enterprises
    • SMEs
  • Deployment
    • Cloud-based
    • On-premises
  • Geography
    • North America
      • US
      • Canada
    • Europe
      • France
      • Germany
      • Italy
      • Spain
      • UK
    • APAC
      • China
      • India
      • Japan
    • Rest of World (ROW)

By Type Insights

The VDI segment is estimated to witness significant growth during the forecast period.

In the dynamic and evolving the market, virtual desktop infrastructure (VDI) holds a significant position, offering organizations centralized management and delivery of desktop environments from data centers to end-user devices. VDI solutions, which include thin client deployments and hyperconverged infrastructure, enable enhanced security, streamlined IT operations, and support for remote workforces. VDI adoption is on the rise, particularly in sectors with stringent data governance and regulatory compliance, such as finance, healthcare, and government. This architecture reduces hardware dependency, extends the lifecycle of endpoint devices, and facilitates rapid provisioning for dynamic workforce needs. According to recent market research, over 50% of enterprises plan to increase their investment in VDI solutions in the next two years, driven by the need for secure, flexible, and scalable desktop environments.

VDI solutions also integrate user profile management, VDI security protocols, virtual desktop scaling, hybrid cloud VDI, session management, centralized management, performance optimization, and hypervisor performance metrics. Additionally, they offer image management, remote desktop protocol, virtual SAN, storage virtualization, application virtualization technologies, application streaming, VDI cost optimization, patch management, and virtual desktop management. Furthermore, VDI addresses challenges such as virtual machine sprawl, virtual desktop monitoring, resource allocation, network virtualization, endpoint security, VDI licensing models, capacity planning, access control, non-persistent virtual desktops, client device management, persistent virtual desktops, GPU passthrough virtualization, and data loss prevention.

Desktop Virtualization Market Size

Request Free Sample

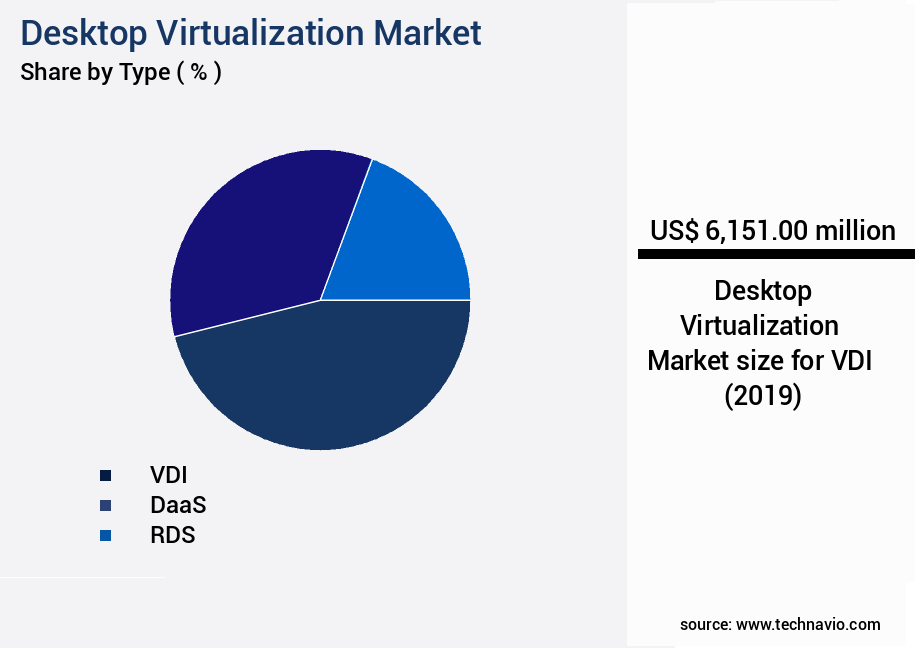
The VDI segment was valued at USD 6.15 billion in 2019 and showed a gradual increase during the forecast period.

Desktop Virtualization Market Size

Request Free Sample

Regional Analysis

North America is estimated to contribute 41% to the growth of the global market during the forecast period.Technavio's analysts have elaborately explained the regional trends and drivers that shape the market during the forecast period.

Desktop Virtualization Market Share by Geography

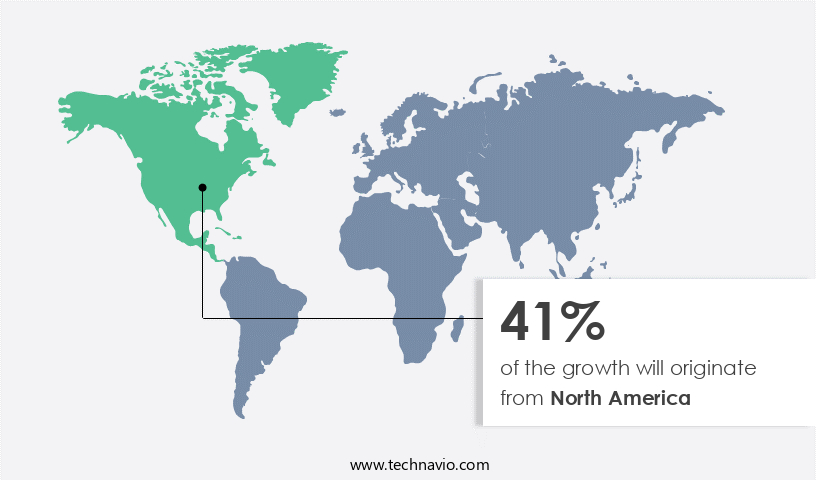
See How Desktop Virtualization Market Demand is Rising in North America Request Free Sample

The market in North America is experiencing significant growth due to the increasing prioritization of secure and scalable IT infrastructure in enterprise environments. This region's emphasis on centralized management and remote accessibility is driving the adoption of virtualization technologies across various sectors. Regulatory compliance requirements and the need for robust data protection frameworks are further accelerating the deployment of virtual desktop solutions. The North American market will be shaped by the evolving dynamics of hybrid work models and the strategic shift toward cloud-based infrastructure. According to recent studies, the North American the market is projected to grow at a compound annual growth rate (CAGR) of approximately 12%.

This growth is attributed to the operational efficiency gains and cost reductions that virtualization technologies provide. For instance, virtual desktops enable organizations to reduce hardware costs and streamline IT management tasks. Furthermore, the advanced digital ecosystem and widespread broadband connectivity in North America support seamless integration of virtualization platforms, enhancing workforce mobility and productivity.

Desktop Virtualization Market Share by Geography

 Customer Landscape of Desktop Virtualization Industry

Competitive Intelligence by Technavio Analysis: Leading Players in the Desktop Virtualization Market

Companies are implementing various strategies, such as strategic alliances, desktop virtualization market forecast, partnerships, mergers and acquisitions, geographical expansion, and product/service launches, to enhance their presence in the industry.

Ace Cloud Hosting - Desktop virtualization is a solution provided by the company, featuring Ace Cloud application delivery. Applications run on remote cloud servers, allowing their usage on endpoint devices. This approach enhances flexibility and efficiency by eliminating the need for local installations.

The industry research and growth report includes detailed analyses of the competitive landscape of the market and information about key companies, including:

  • Ace Cloud Hosting
  • Amazon.com Inc.
  • Apporto
  • Cameyo Inc.
  • Cisco Systems Inc.
  • Cloud Software Group Inc.
  • Deloitte Touche Tohmatsu Ltd.
  • Evolve IP LLC
  • International Business Machines Corp.
  • Kasm Technologies
  • Microsoft Corp.
  • Ncomputing Co. Ltd.
  • Nerdio Inc.
  • Nutanix Inc.
  • Oracle Corp.
  • Parallels International GmbH
  • Red Hat Inc.
  • V2Cloud Solutions Inc.
  • VMware Inc.

Qualitative and quantitative analysis of companies has been conducted to help clients understand the wider business environment as well as the strengths and weaknesses of key industry players. Data is qualitatively analyzed to categorize companies as pure play, category-focused, industry-focused, and diversified; it is quantitatively analyzed to categorize companies as dominant, leading, strong, tentative, and weak.

Recent Development and News in Desktop Virtualization Market

  • In August 2024, Microsoft announced the general availability of Windows 365 Cloud PC, a new desktop virtualization solution that allows users to access their desktop and applications from anywhere, anytime, through the cloud (Microsoft Press Release). This development marked a significant expansion of Microsoft's offerings in the market.
  • In November 2024, Citrix Systems and Amazon Web Services (AWS) strengthened their partnership by announcing the integration of Citrix Workspace with AWS's Amazon WorkSpaces service. This collaboration enabled organizations to easily deploy and manage virtual desktops and applications in the cloud using Citrix technology and AWS infrastructure (Citrix Press Release).
  • In March 2025, VMware, a leading player in the market, raised the bar with the release of VMware Horizon 8. VMware Horizon 8 introduced several enhancements, including support for 4K resolution, improved security features, and better integration with Microsoft Teams and Zoom (VMware Press Release).
  • In May 2025, Nutanix acquired Frame, a leading independent provider of cloud-native desktop and application delivery solutions. This acquisition was aimed at expanding Nutanix's portfolio in the market and strengthening its position against competitors (Nutanix Press Release).

Dive into Technavio's robust research methodology, blending expert interviews, extensive data synthesis, and validated models for unparalleled Desktop Virtualization Market insights. See full methodology.

Market Scope

Report Coverage

Details

Page number

200

Base year

2024

Historic period

2019-2023

Forecast period

2025-2029

Growth momentum & CAGR

Accelerate at a CAGR of 17.4%

Market growth 2025-2029

USD 23496.7 million

Market structure

Fragmented

YoY growth 2024-2025(%)

14.8

Key countries

US, UK, China, Germany, Japan, Canada, France, Italy, India, and Spain

Competitive landscape

Leading Companies, Market Positioning of Companies, Competitive Strategies, and Industry Risks

Request Free Sample

Why Choose Technavio for Desktop Virtualization Market Insights?

"Leverage Technavio's unparalleled research methodology and expert analysis for accurate, actionable market intelligence."

The market is experiencing significant growth as businesses seek to optimize their IT infrastructure and enhance productivity. One of the key challenges in this space is ensuring the performance of virtual desktop infrastructure (VDI), which can be addressed through advanced techniques such as load balancing and resource pooling. Robust security protocols are also essential for protecting sensitive data in VDI environments. Managing virtual desktop sprawl effectively is another critical issue, and cost-effective strategies such as using thin clients and implementing centralized management solutions can help. High availability is a must-have in VDI, and implementing redundant systems and disaster recovery plans are crucial. Deploying efficient virtual desktop solutions that leverage cloud technologies can further reduce costs and improve user experience. Advanced virtual desktop management techniques, such as automating tasks and monitoring performance, can help ensure compliance with regulatory requirements and address common security challenges.

Integrating VDI with existing IT infrastructure can be complex, but using standard protocols and following best practices for virtual desktop security can simplify the process. Building scalable and resilient VDI architectures that can handle increasing workloads and ensure business continuity is also essential. Measuring and improving resource utilization is key to maximizing the ROI of VDI investments. In summary, the market offers numerous benefits for businesses, including improved user experience, enhanced security, and cost savings. Effective VDI deployment requires careful planning and execution, including optimizing performance, implementing robust security protocols, managing sprawl, ensuring high availability, and leveraging advanced management techniques. By addressing these challenges, businesses can reap the rewards of this dynamic and evolving technology.

What are the Key Data Covered in this Desktop Virtualization Market Research and Growth Report?

  • What is the expected growth of the Desktop Virtualization Market between 2025 and 2029?

    • USD 23.5 billion, at a CAGR of 17.4%

  • What segmentation does the market report cover?

    • The report is segmented by Type (VDI, DaaS, and RDS), End-user (Large enterprises and SMEs), Deployment (Cloud-based and On-premises), and Geography (North America, Europe, APAC, Middle East and Africa, and South America)

  • Which regions are analyzed in the report?

    • North America, Europe, APAC, Middle East and Africa, and South America

  • What are the key growth drivers and market challenges?

    • Growing adoption of cloud-based VDI for SMEs, Increasing cyber threats

  • Who are the major players in the Desktop Virtualization Market?

    • Ace Cloud Hosting, Amazon.com Inc., Apporto, Cameyo Inc., Cisco Systems Inc., Cloud Software Group Inc., Deloitte Touche Tohmatsu Ltd., Evolve IP LLC, International Business Machines Corp., Kasm Technologies, Microsoft Corp., Ncomputing Co. Ltd., Nerdio Inc., Nutanix Inc., Oracle Corp., Parallels International GmbH, Red Hat Inc., V2Cloud Solutions Inc., and VMware Inc.

We can help! Our analysts can customize this desktop virtualization market research report to meet your requirements.

Get in touch

1 Executive Summary

  • 1.1 Market overview
    • Executive Summary - Chart on Market Overview
    • Executive Summary - Data Table on Market Overview
    • Executive Summary - Chart on Global Market Characteristics
    • Executive Summary - Chart on Market by Geography
    • Executive Summary - Chart on Market Segmentation by Type
    • Executive Summary - Chart on Market Segmentation by End-user
    • Executive Summary - Chart on Market Segmentation by Deployment
    • Executive Summary - Chart on Incremental Growth
    • Executive Summary - Data Table on Incremental Growth
    • Executive Summary - Chart on Company Market Positioning

2 Technavio Analysis

  • 2.1 Analysis of price sensitivity, lifecycle, customer purchase basket, adoption rates, and purchase criteria
    • Analysis of price sensitivity, lifecycle, customer purchase basket, adoption rates, and purchase criteria
  • 2.2 Criticality of inputs and Factors of differentiation
    • Overview on criticality of inputs and factors of differentiation
  • 2.3 Factors of disruption
    • Overview on factors of disruption
  • 2.4 Impact of drivers and challenges
    • Impact of drivers and challenges in 2024 and 2029

3 Market Landscape

  • 3.1 Market ecosystem
    • Parent Market
    • Data Table on - Parent Market
  • 3.2 Market characteristics
    • Market characteristics analysis
  • 3.3 Value chain analysis
    • Value chain analysis

4 Market Sizing

  • 4.1 Market definition
    • Offerings of companies included in the market definition
  • 4.2 Market segment analysis
    • Market segments
  • 4.3 Market size 2024
    • 4.4 Market outlook: Forecast for 2024-2029
      • Chart on Global - Market size and forecast 2024-2029 ($ million)
      • Data Table on Global - Market size and forecast 2024-2029 ($ million)
      • Chart on Global Market: Year-over-year growth 2024-2029 (%)
      • Data Table on Global Market: Year-over-year growth 2024-2029 (%)

    5 Historic Market Size

    • 5.1 Global Desktop Virtualization Market 2019 - 2023
      • Historic Market Size - Data Table on Global Desktop Virtualization Market 2019 - 2023 ($ million)
    • 5.2 Type segment analysis 2019 - 2023
      • Historic Market Size - Type Segment 2019 - 2023 ($ million)
    • 5.3 End-user segment analysis 2019 - 2023
      • Historic Market Size - End-user Segment 2019 - 2023 ($ million)
    • 5.4 Deployment segment analysis 2019 - 2023
      • Historic Market Size - Deployment Segment 2019 - 2023 ($ million)
    • 5.5 Geography segment analysis 2019 - 2023
      • Historic Market Size - Geography Segment 2019 - 2023 ($ million)
    • 5.6 Country segment analysis 2019 - 2023
      • Historic Market Size - Country Segment 2019 - 2023 ($ million)

    6 Qualitative Analysis

    • 6.1 The AI impact on Global Desktop Virtualization Market

      7 Five Forces Analysis

      • 7.1 Five forces summary
        • Five forces analysis - Comparison between 2024 and 2029
      • 7.2 Bargaining power of buyers
        • Bargaining power of buyers - Impact of key factors 2024 and 2029
      • 7.3 Bargaining power of suppliers
        • Bargaining power of suppliers - Impact of key factors in 2024 and 2029
      • 7.4 Threat of new entrants
        • Threat of new entrants - Impact of key factors in 2024 and 2029
      • 7.5 Threat of substitutes
        • Threat of substitutes - Impact of key factors in 2024 and 2029
      • 7.6 Threat of rivalry
        • Threat of rivalry - Impact of key factors in 2024 and 2029
      • 7.7 Market condition
        • Chart on Market condition - Five forces 2024 and 2029

      8 Market Segmentation by Type

      • 8.1 Market segments
        • Chart on Type - Market share 2024-2029 (%)
        • Data Table on Type - Market share 2024-2029 (%)
      • 8.2 Comparison by Type
        • Chart on Comparison by Type
        • Data Table on Comparison by Type
      • 8.3 VDI - Market size and forecast 2024-2029
        • Chart on VDI - Market size and forecast 2024-2029 ($ million)
        • Data Table on VDI - Market size and forecast 2024-2029 ($ million)
        • Chart on VDI - Year-over-year growth 2024-2029 (%)
        • Data Table on VDI - Year-over-year growth 2024-2029 (%)
      • 8.4 DaaS - Market size and forecast 2024-2029
        • Chart on DaaS - Market size and forecast 2024-2029 ($ million)
        • Data Table on DaaS - Market size and forecast 2024-2029 ($ million)
        • Chart on DaaS - Year-over-year growth 2024-2029 (%)
        • Data Table on DaaS - Year-over-year growth 2024-2029 (%)
      • 8.5 RDS - Market size and forecast 2024-2029
        • Chart on RDS - Market size and forecast 2024-2029 ($ million)
        • Data Table on RDS - Market size and forecast 2024-2029 ($ million)
        • Chart on RDS - Year-over-year growth 2024-2029 (%)
        • Data Table on RDS - Year-over-year growth 2024-2029 (%)
      • 8.6 Market opportunity by Type
        • Market opportunity by Type ($ million)
        • Data Table on Market opportunity by Type ($ million)

      9 Market Segmentation by End-user

      • 9.1 Market segments
        • Chart on End-user - Market share 2024-2029 (%)
        • Data Table on End-user - Market share 2024-2029 (%)
      • 9.2 Comparison by End-user
        • Chart on Comparison by End-user
        • Data Table on Comparison by End-user
      • 9.3 Large enterprises - Market size and forecast 2024-2029
        • Chart on Large enterprises - Market size and forecast 2024-2029 ($ million)
        • Data Table on Large enterprises - Market size and forecast 2024-2029 ($ million)
        • Chart on Large enterprises - Year-over-year growth 2024-2029 (%)
        • Data Table on Large enterprises - Year-over-year growth 2024-2029 (%)
      • 9.4 SMEs - Market size and forecast 2024-2029
        • Chart on SMEs - Market size and forecast 2024-2029 ($ million)
        • Data Table on SMEs - Market size and forecast 2024-2029 ($ million)
        • Chart on SMEs - Year-over-year growth 2024-2029 (%)
        • Data Table on SMEs - Year-over-year growth 2024-2029 (%)
      • 9.5 Market opportunity by End-user
        • Market opportunity by End-user ($ million)
        • Data Table on Market opportunity by End-user ($ million)

      10 Market Segmentation by Deployment

      • 10.1 Market segments
        • Chart on Deployment - Market share 2024-2029 (%)
        • Data Table on Deployment - Market share 2024-2029 (%)
      • 10.2 Comparison by Deployment
        • Chart on Comparison by Deployment
        • Data Table on Comparison by Deployment
      • 10.3 Cloud-based - Market size and forecast 2024-2029
        • Chart on Cloud-based - Market size and forecast 2024-2029 ($ million)
        • Data Table on Cloud-based - Market size and forecast 2024-2029 ($ million)
        • Chart on Cloud-based - Year-over-year growth 2024-2029 (%)
        • Data Table on Cloud-based - Year-over-year growth 2024-2029 (%)
      • 10.4 On-premises - Market size and forecast 2024-2029
        • Chart on On-premises - Market size and forecast 2024-2029 ($ million)
        • Data Table on On-premises - Market size and forecast 2024-2029 ($ million)
        • Chart on On-premises - Year-over-year growth 2024-2029 (%)
        • Data Table on On-premises - Year-over-year growth 2024-2029 (%)
      • 10.5 Market opportunity by Deployment
        • Market opportunity by Deployment ($ million)
        • Data Table on Market opportunity by Deployment ($ million)

      11 Customer Landscape

      • 11.1 Customer landscape overview
        • Analysis of price sensitivity, lifecycle, customer purchase basket, adoption rates, and purchase criteria

      12 Geographic Landscape

      • 12.1 Geographic segmentation
        • Chart on Market share by geography 2024-2029 (%)
        • Data Table on Market share by geography 2024-2029 (%)
      • 12.2 Geographic comparison
        • Chart on Geographic comparison
        • Data Table on Geographic comparison
      • 12.3 North America - Market size and forecast 2024-2029
        • Chart on North America - Market size and forecast 2024-2029 ($ million)
        • Data Table on North America - Market size and forecast 2024-2029 ($ million)
        • Chart on North America - Year-over-year growth 2024-2029 (%)
        • Data Table on North America - Year-over-year growth 2024-2029 (%)
      • 12.4 Europe - Market size and forecast 2024-2029
        • Chart on Europe - Market size and forecast 2024-2029 ($ million)
        • Data Table on Europe - Market size and forecast 2024-2029 ($ million)
        • Chart on Europe - Year-over-year growth 2024-2029 (%)
        • Data Table on Europe - Year-over-year growth 2024-2029 (%)
      • 12.5 APAC - Market size and forecast 2024-2029
        • Chart on APAC - Market size and forecast 2024-2029 ($ million)
        • Data Table on APAC - Market size and forecast 2024-2029 ($ million)
        • Chart on APAC - Year-over-year growth 2024-2029 (%)
        • Data Table on APAC - Year-over-year growth 2024-2029 (%)
      • 12.6 Middle East and Africa - Market size and forecast 2024-2029
        • Chart on Middle East and Africa - Market size and forecast 2024-2029 ($ million)
        • Data Table on Middle East and Africa - Market size and forecast 2024-2029 ($ million)
        • Chart on Middle East and Africa - Year-over-year growth 2024-2029 (%)
        • Data Table on Middle East and Africa - Year-over-year growth 2024-2029 (%)
      • 12.7 South America - Market size and forecast 2024-2029
        • Chart on South America - Market size and forecast 2024-2029 ($ million)
        • Data Table on South America - Market size and forecast 2024-2029 ($ million)
        • Chart on South America - Year-over-year growth 2024-2029 (%)
        • Data Table on South America - Year-over-year growth 2024-2029 (%)
      • 12.8 US - Market size and forecast 2024-2029
        • Chart on US - Market size and forecast 2024-2029 ($ million)
        • Data Table on US - Market size and forecast 2024-2029 ($ million)
        • Chart on US - Year-over-year growth 2024-2029 (%)
        • Data Table on US - Year-over-year growth 2024-2029 (%)
      • 12.9 UK - Market size and forecast 2024-2029
        • Chart on UK - Market size and forecast 2024-2029 ($ million)
        • Data Table on UK - Market size and forecast 2024-2029 ($ million)
        • Chart on UK - Year-over-year growth 2024-2029 (%)
        • Data Table on UK - Year-over-year growth 2024-2029 (%)
      • 12.10 China - Market size and forecast 2024-2029
        • Chart on China - Market size and forecast 2024-2029 ($ million)
        • Data Table on China - Market size and forecast 2024-2029 ($ million)
        • Chart on China - Year-over-year growth 2024-2029 (%)
        • Data Table on China - Year-over-year growth 2024-2029 (%)
      • 12.11 Germany - Market size and forecast 2024-2029
        • Chart on Germany - Market size and forecast 2024-2029 ($ million)
        • Data Table on Germany - Market size and forecast 2024-2029 ($ million)
        • Chart on Germany - Year-over-year growth 2024-2029 (%)
        • Data Table on Germany - Year-over-year growth 2024-2029 (%)
      • 12.12 Japan - Market size and forecast 2024-2029
        • Chart on Japan - Market size and forecast 2024-2029 ($ million)
        • Data Table on Japan - Market size and forecast 2024-2029 ($ million)
        • Chart on Japan - Year-over-year growth 2024-2029 (%)
        • Data Table on Japan - Year-over-year growth 2024-2029 (%)
      • 12.13 Canada - Market size and forecast 2024-2029
        • Chart on Canada - Market size and forecast 2024-2029 ($ million)
        • Data Table on Canada - Market size and forecast 2024-2029 ($ million)
        • Chart on Canada - Year-over-year growth 2024-2029 (%)
        • Data Table on Canada - Year-over-year growth 2024-2029 (%)
      • 12.14 France - Market size and forecast 2024-2029
        • Chart on France - Market size and forecast 2024-2029 ($ million)
        • Data Table on France - Market size and forecast 2024-2029 ($ million)
        • Chart on France - Year-over-year growth 2024-2029 (%)
        • Data Table on France - Year-over-year growth 2024-2029 (%)
      • 12.15 Italy - Market size and forecast 2024-2029
        • Chart on Italy - Market size and forecast 2024-2029 ($ million)
        • Data Table on Italy - Market size and forecast 2024-2029 ($ million)
        • Chart on Italy - Year-over-year growth 2024-2029 (%)
        • Data Table on Italy - Year-over-year growth 2024-2029 (%)
      • 12.16 India - Market size and forecast 2024-2029
        • Chart on India - Market size and forecast 2024-2029 ($ million)
        • Data Table on India - Market size and forecast 2024-2029 ($ million)
        • Chart on India - Year-over-year growth 2024-2029 (%)
        • Data Table on India - Year-over-year growth 2024-2029 (%)
      • 12.17 Spain - Market size and forecast 2024-2029
        • Chart on Spain - Market size and forecast 2024-2029 ($ million)
        • Data Table on Spain - Market size and forecast 2024-2029 ($ million)
        • Chart on Spain - Year-over-year growth 2024-2029 (%)
        • Data Table on Spain - Year-over-year growth 2024-2029 (%)
      • 12.18 Market opportunity by geography
        • Market opportunity by geography ($ million)
        • Data Tables on Market opportunity by geography ($ million)

      13 Drivers, Challenges, and Opportunity/Restraints

      • 13.1 Market drivers
        • 13.2 Market challenges
          • 13.3 Impact of drivers and challenges
            • Impact of drivers and challenges in 2024 and 2029
          • 13.4 Market opportunities/restraints

            14 Competitive Landscape

            • 14.1 Overview
              • 14.2 Competitive Landscape
                • Overview on criticality of inputs and factors of differentiation
              • 14.3 Landscape disruption
                • Overview on factors of disruption
              • 14.4 Industry risks
                • Impact of key risks on business

              15 Competitive Analysis

              • 15.1 Companies profiled
                • Companies covered
              • 15.2 Company ranking index
                • Company ranking index
              • 15.3 Market positioning of companies
                • Matrix on companies position and classification
              • 15.4 Ace Cloud Hosting
                • Ace Cloud Hosting - Overview
                • Ace Cloud Hosting - Product / Service
                • Ace Cloud Hosting - Key offerings
                • SWOT
              • 15.5 Amazon.com Inc.
                • Amazon.com Inc. - Overview
                • Amazon.com Inc. - Business segments
                • Amazon.com Inc. - Key news
                • Amazon.com Inc. - Key offerings
                • Amazon.com Inc. - Segment focus
                • SWOT
              • 15.6 Cameyo Inc.
                • Cameyo Inc. - Overview
                • Cameyo Inc. - Product / Service
                • Cameyo Inc. - Key offerings
                • SWOT
              • 15.7 Cisco Systems Inc.
                • Cisco Systems Inc. - Overview
                • Cisco Systems Inc. - Business segments
                • Cisco Systems Inc. - Key news
                • Cisco Systems Inc. - Key offerings
                • Cisco Systems Inc. - Segment focus
                • SWOT
              • 15.8 Cloud Software Group Inc.
                • Cloud Software Group Inc. - Overview
                • Cloud Software Group Inc. - Product / Service
                • Cloud Software Group Inc. - Key news
                • Cloud Software Group Inc. - Key offerings
                • SWOT
              • 15.9 Evolve IP LLC
                • Evolve IP LLC - Overview
                • Evolve IP LLC - Product / Service
                • Evolve IP LLC - Key offerings
                • SWOT
              • 15.10 International Business Machines Corp.
                • International Business Machines Corp. - Overview
                • International Business Machines Corp. - Business segments
                • International Business Machines Corp. - Key news
                • International Business Machines Corp. - Key offerings
                • International Business Machines Corp. - Segment focus
                • SWOT
              • 15.11 Kasm Technologies
                • Kasm Technologies - Overview
                • Kasm Technologies - Product / Service
                • Kasm Technologies - Key offerings
                • SWOT
              • 15.12 Microsoft Corp.
                • Microsoft Corp. - Overview
                • Microsoft Corp. - Business segments
                • Microsoft Corp. - Key news
                • Microsoft Corp. - Key offerings
                • Microsoft Corp. - Segment focus
                • SWOT
              • 15.13 Ncomputing Co. Ltd.
                • Ncomputing Co. Ltd. - Overview
                • Ncomputing Co. Ltd. - Product / Service
                • Ncomputing Co. Ltd. - Key offerings
                • SWOT
              • 15.14 Nutanix Inc.
                • Nutanix Inc. - Overview
                • Nutanix Inc. - Product / Service
                • Nutanix Inc. - Key offerings
                • SWOT
              • 15.15 Parallels International GmbH
                • Parallels International GmbH - Overview
                • Parallels International GmbH - Product / Service
                • Parallels International GmbH - Key offerings
                • SWOT
              • 15.16 Red Hat Inc.
                • Red Hat Inc. - Overview
                • Red Hat Inc. - Product / Service
                • Red Hat Inc. - Key offerings
                • SWOT
              • 15.17 V2Cloud Solutions Inc.
                • V2Cloud Solutions Inc. - Overview
                • V2Cloud Solutions Inc. - Product / Service
                • V2Cloud Solutions Inc. - Key offerings
                • SWOT
              • 15.18 VMware Inc.
                • VMware Inc. - Overview
                • VMware Inc. - Product / Service
                • VMware Inc. - Key offerings
                • SWOT

              16 Appendix

              • 16.1 Scope of the report
                • 16.2 Inclusions and exclusions checklist
                  • Inclusions checklist
                  • Exclusions checklist
                • 16.3 Currency conversion rates for US$
                  • Currency conversion rates for US$
                • 16.4 Research methodology
                  • Research methodology
                • 16.5 Data procurement
                  • Information sources
                • 16.6 Data validation
                  • Data validation
                • 16.7 Validation techniques employed for market sizing
                  • Validation techniques employed for market sizing
                • 16.8 Data synthesis
                  • Data synthesis
                • 16.9 360 degree market analysis
                  • 360 degree market analysis
                • 16.10 List of abbreviations
                  • List of abbreviations

                Research Methodology

                Technavio presents a detailed picture of the market by way of study, synthesis, and summation of data from multiple sources. The analysts have presented the various facets of the market with a particular focus on identifying the key industry influencers. The data thus presented is comprehensive, reliable, and the result of extensive research, both primary and secondary.

                INFORMATION SOURCES

                Primary sources

                • Manufacturers and suppliers
                • Channel partners
                • Industry experts
                • Strategic decision makers

                Secondary sources

                • Industry journals and periodicals
                • Government data
                • Financial reports of key industry players
                • Historical data
                • Press releases

                DATA ANALYSIS

                Data Synthesis

                • Collation of data
                • Estimation of key figures
                • Analysis of derived insights

                Data Validation

                • Triangulation with data models
                • Reference against proprietary databases
                • Corroboration with industry experts

                REPORT WRITING

                Qualitative

                • Market drivers
                • Market challenges
                • Market trends
                • Five forces analysis

                Quantitative

                • Market size and forecast
                • Market segmentation
                • Geographical insights
                • Competitive landscape

                Interested in this report?

                Get your sample now to see our research methodology and insights!

                Download Now

                Frequently Asked Questions

                Desktop Virtualization market growth will increase by $ 23496.7 mn during 2025-2029.

                The Desktop Virtualization market is expected to grow at a CAGR of 17.4% during 2025-2029.

                Desktop Virtualization market is segmented by Type( VDI, DaaS, RDS) End-user( Large enterprises, SMEs, medium enterprises) Deployment( Cloud-based, On-premises, APAC, Middle East and Africa, South America)

                Ace Cloud Hosting, Amazon.com Inc., Apporto, Cameyo Inc., Cisco Systems Inc., Cloud Software Group Inc., Deloitte Touche Tohmatsu Ltd., Evolve IP LLC, International Business Machines Corp., Kasm Technologies, Microsoft Corp., Ncomputing Co. Ltd., Nerdio Inc., Nutanix Inc., Oracle Corp., Parallels International GmbH, Red Hat Inc., V2Cloud Solutions Inc., VMware Inc. are a few of the key vendors in the Desktop Virtualization market.

                North America will register the highest growth rate of 41% among the other regions. Therefore, the Desktop Virtualization market in North America is expected to garner significant business opportunities for the vendors during the forecast period.

                US, UK, China, Germany, Japan, Canada, France, Italy, India, Spain

                • Growing adoption of cloud-based VDI for SMEsAn increase in the adoption of cloud computing services globally is driving the demand for cloud-based VDIs. Most companies are migrating their business operations from on-premises to the cloud for increased efficiency is the driving factor this market.
                • along with reduced operational costs. As part of their migration to the cloud is the driving factor this market.
                • enterprises are hosting their websites on the cloud is the driving factor this market.
                • and thus is the driving factor this market.
                • VDI solutions are being adopted by various industries is the driving factor this market.
                • such as BFSI is the driving factor this market.
                • IT and telecom is the driving factor this market.
                • education is the driving factor this market.
                • energy and utility is the driving factor this market.
                • and retail. The benefits of implementing VDI solutions include simplified administration is the driving factor this market.
                • remote access and maintenance is the driving factor this market.
                • and data security.SMEs are finding it difficult to implement VDI due to the high initial costs involved. Hence is the driving factor this market.
                • most such enterprises prefer operating through desktops. However is the driving factor this market.
                • the scenario changed after the introduction of cloud-based VDI solutions is the driving factor this market.
                • where the cost of initial VDI deployment is cheaper when compared with on-premises VDI. The hardware that runs hundreds of virtual machines is extremely costly for SMEs with a tighter VDI implementation budget. Operating these infrastructures requires higher skill sets than operating a physical desktop. Cloud-based VDI is the driving factor this market.
                • SMEs can easily deploy a VDI solution and pay monthly for the service. Therefore is the driving factor this market.
                • the adoption of cloud computing services will boost the growth of the market in focus during the forecast period. is the driving factor this market.

                The Desktop Virtualization market vendors should focus on grabbing business opportunities from the VDI segment as it accounted for the largest market share in the base year.