Dental Radiology Equipment Market Analysis, Size, and Forecast 2026-2030: North America (US, Canada, and Mexico), Europe (Germany, UK, and France), APAC (China, India, and Japan), South America (Brazil and Argentina), Middle East and Africa (Saudi Arabia, UAE, and Turkey), Asia, Rest of World (ROW)

Dental Radiology Equipment Market Analysis, Size, and Forecast 2026-2030:
North America (US, Canada, and Mexico), Europe (Germany, UK, and France), APAC (China, India, and Japan), South America (Brazil and Argentina), Middle East and Africa (Saudi Arabia, UAE, and Turkey), Asia, Rest of World (ROW)

Published: Jan 2026 291 Pages SKU: IRTNTR46599

Market Overview at a Glance

$3.42 B
Market Opportunity
13.4%
CAGR 2025 - 2030
40%
North America Growth
$1.61 B
Dental clinics segment 2024

Dental Radiology Equipment Market Size 2026-2030

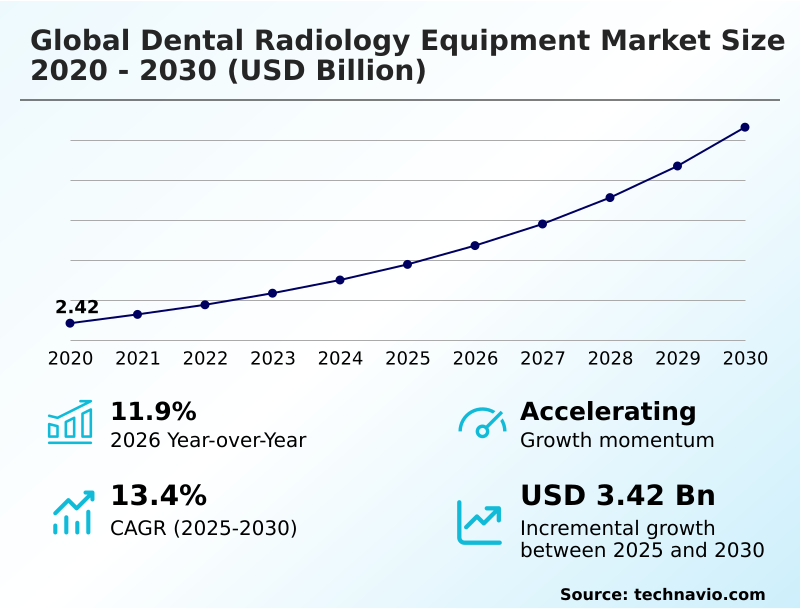
The dental radiology equipment market size is valued to increase by USD 3.42 billion, at a CAGR of 13.4% from 2025 to 2030. Consolidation of dental practices and rise of dental service organizations will drive the dental radiology equipment market.

Major Market Trends & Insights

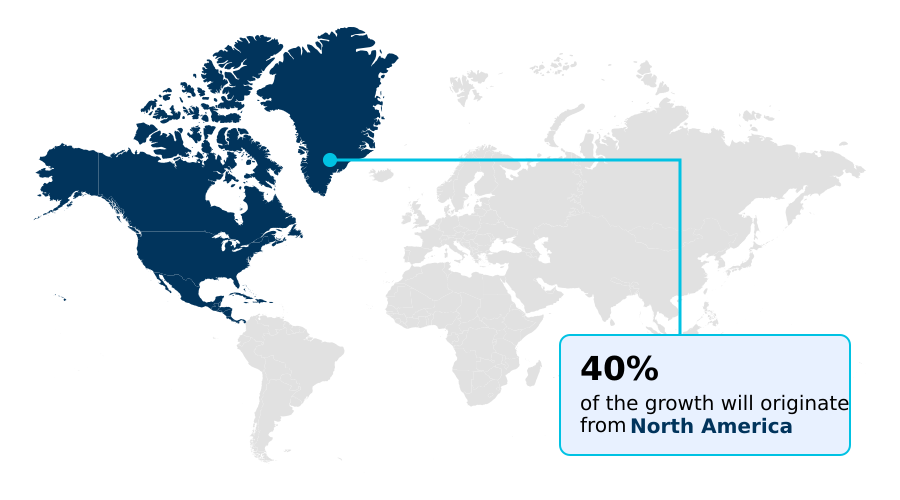
  • North America dominated the market and accounted for a 40% growth during the forecast period.
  • By End-user - Dental clinics segment was valued at USD 1.61 billion in 2024
  • By Product - Dental X-ray segment accounted for the largest market revenue share in 2024

Market Size & Forecast

  • Market Opportunities: USD 4.90 billion
  • Market Future Opportunities: USD 3.42 billion
  • CAGR from 2025 to 2030 : 13.4%

Market Summary

  • The Dental Radiology Equipment Market is defined by its indispensable role in modern clinical practice, providing the foundational diagnostic tools for accurate treatment planning and execution. A pivotal market dynamic is the comprehensive shift from analog film to digital workflows, driven by the demand for superior image quality, streamlined practice management, and significant radiation dose reduction.
  • The proliferation of technologies like cone-beam computed tomography (CBCT) has revolutionized care, enabling complex procedures such as implant dentistry and orthodontic treatment with unprecedented precision. For example, large dental service organizations now standardize their clinics with specific digital panoramic systems and integrated software to ensure a uniform standard of care and operational efficiency across hundreds of locations.
  • This push for standardization, combined with the integration of AI diagnostic software, creates a compelling business case for continuous technology investment, despite challenges related to high capital costs and the need for specialized training.

What will be the Size of the Dental Radiology Equipment Market during the forecast period?

Get Key Insights on Market Forecast (PDF) Request Free Sample

How is the Dental Radiology Equipment Market Segmented?

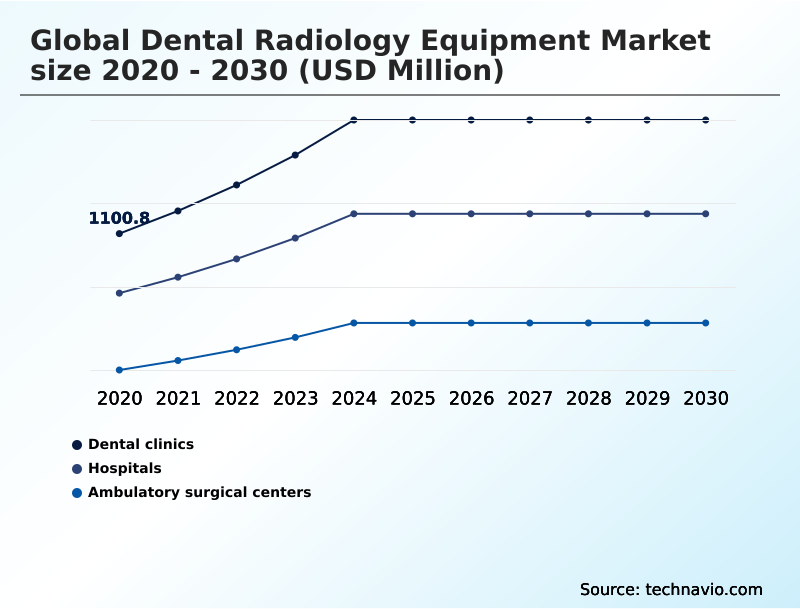
The dental radiology equipment industry research report provides comprehensive data (region-wise segment analysis), with forecasts and estimates in "USD million" for the period 2026-2030, as well as historical data from 2020-2024 for the following segments.

  • End-user
    • Dental clinics
    • Hospitals
    • Ambulatory surgical centers
  • Product
    • Dental X-ray
    • Dental CBCT
  • Type
    • Diagnostic equipment
    • Therapeutic equipment
  • Geography
    • North America
      • US
      • Canada
      • Mexico
    • Europe
      • Germany
      • UK
      • France
    • Asia
    • Rest of World (ROW)

By End-user Insights

The dental clinics segment is estimated to witness significant growth during the forecast period.

Dental clinics are the primary end-user, driving market evolution through technology adoption to enhance diagnostic precision and workflow automation.

The shift from film to advanced digital imaging is nearly complete, with clinics investing in tools that support minimally invasive procedures and improve patient outcomes.

The integration of AI into imaging software is a key factor, with systems demonstrating the ability to improve the detection of pathologies like incipient caries by over 20% compared to unassisted review.

This segment's purchasing decisions are shaped by the need for a seamless digital workflow, from initial data acquisition using a photostimulable phosphor plate and cmos sensor to treatment planning.

This necessitates advanced digital imaging platforms and cbct scanner units to meet rising patient expectations for a higher standard of care and support procedures like endodontic treatment.

Request Free Sample

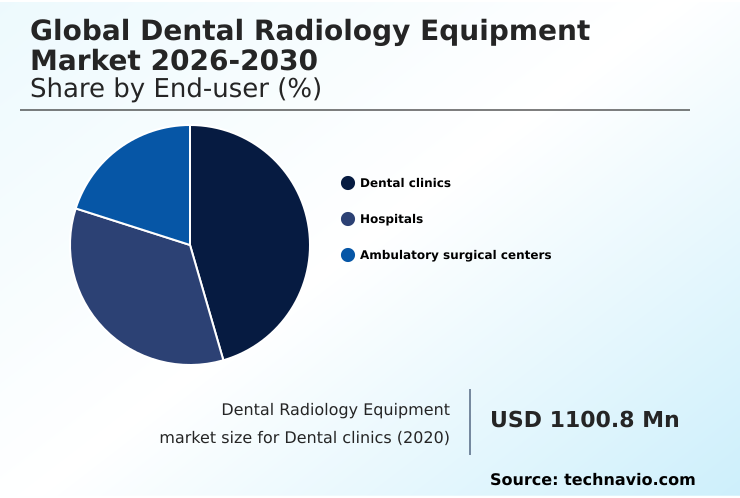
The Dental clinics segment was valued at USD 1.61 billion in 2024 and showed a gradual increase during the forecast period.

Request Free Sample

Regional Analysis

North America is estimated to contribute 40% to the growth of the global market during the forecast period.Technavio’s analysts have elaborately explained the regional trends and drivers that shape the market during the forecast period.

See How Dental Radiology Equipment Market Demand is Rising in North America Request Free Sample

The geographic landscape of the market is defined by a clear distinction between mature and emerging regions.

North America, which accounts for approximately 40% of the incremental growth, and Europe are characterized by high technology adoption rates, with digital penetration exceeding 90% in many areas.

In these markets, growth is driven by the replacement of aging systems and investment in advanced technologies like low-dose cbct imaging protocols and ai in dental radiology by large dental service organizations.

In contrast, Asia represents the fastest-growing region, fueled by rising healthcare expenditure and infrastructure development.

Countries like China and India are rapidly transitioning to digital imaging platforms, creating immense demand for both entry-level and advanced diagnostic equipment, including digital radiography and portable x-ray unit technology, to serve a burgeoning middle class seeking improved standards of care.

This creates a diverse global picture of both upgrade-driven and volume-driven expansion.

Market Dynamics

Our researchers analyzed the data with 2025 as the base year, along with the key drivers, trends, and challenges. A holistic analysis of drivers will help companies refine their marketing strategies to gain a competitive advantage.

  • Strategic investment decisions in dental radiology are increasingly complex, requiring a detailed analysis of various factors. For instance, the cost vs benefit of digital panoramic systems must be weighed against the initial capital outlay and long-term workflow efficiencies.
  • For practices focusing on high-value procedures, understanding the benefits of 3d cbct for orthodontics or the role of digital imaging in cosmetic dentistry is crucial for calculating return on investment. The evaluation of portable intraoral x-ray unit benefits centers on flexibility and space optimization, which is a key consideration for mobile dentistry and multi-operatory clinics.
  • Furthermore, the integration of AI in dental caries detection is no longer a futuristic concept but a practical tool that enhances diagnostic accuracy. The trend towards fully integrated digital workflows, which has shown to increase case acceptance for complex treatments by over 15% compared to practices using disparate systems, underscores the importance of ecosystem-based technology adoption.
  • Navigating the regulatory landscape for medical imaging devices, including compliance with low-dose CBCT imaging protocols and standards for 3d dental imaging software, is another critical aspect. As the market evolves, understanding the comparison of intraoral sensor technologies and the impact of ai on dental diagnostics will become central to maintaining a competitive edge and delivering a high standard of care.
  • The applications of cbct in endodontics continue to expand, making proficiency with cbct interpretation for general dentists a necessary skill. Ultimately, choices between different cbct machine price points, the use of handheld dental x-ray safety protocols, and the adoption of dental imaging AI algorithms shape a practice's clinical capabilities and financial health.
  • The comparison between 2d and 3d dental imaging remains a fundamental consideration in this evolving technological landscape.

What are the key market drivers leading to the rise in the adoption of Dental Radiology Equipment Industry?

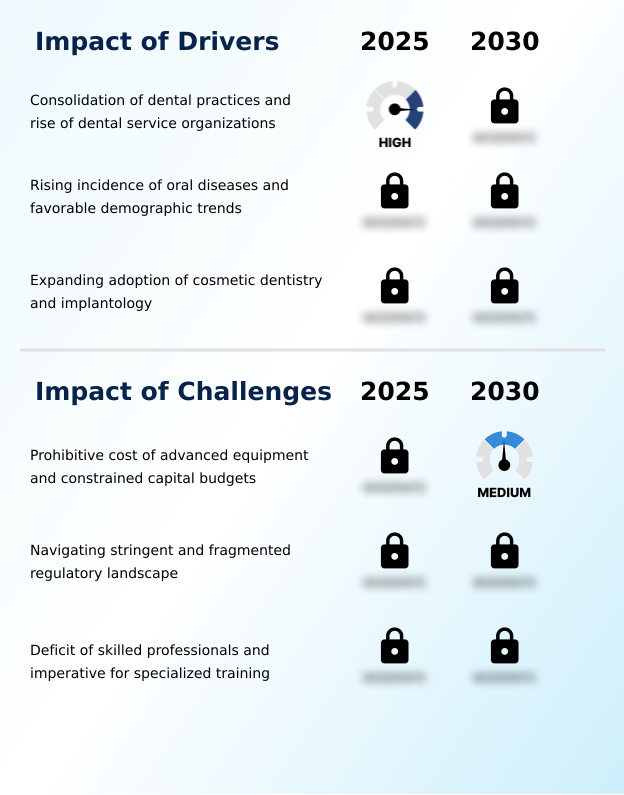
  • The consolidation of dental practices and the corresponding rise of dental service organizations (DSOs) represent a key driver for the market.

  • Market growth is propelled by powerful structural and demographic shifts.
  • The consolidation of dental practices into large Dental Service Organizations (DSOs) is a primary driver, as these entities leverage centralized procurement to invest in advanced imaging technology, often achieving cost efficiencies of up to 15%.
  • This standardization enhances the quality of care across their networks.
  • Concurrently, the rising global demand for dental implants and cosmetic dentistry, procedures that are heavily reliant on precise 3d dental imaging software for planning, creates a strong business case for adopting sophisticated equipment.
  • The high prevalence of oral diseases, coupled with an aging population retaining their teeth longer, ensures a consistent and complex caseload requiring thorough diagnostic workups, further sustaining demand for both routine and advanced imaging solutions like digital panoramic systems.

What are the market trends shaping the Dental Radiology Equipment Industry?

  • The ascendancy of artificial intelligence in diagnostic imaging is a transformative market trend. This evolution is reshaping clinical workflows and enhancing diagnostic capabilities across the industry.

  • Key market trends are redefining the value of diagnostic imaging, moving beyond hardware to intelligent software and integrated systems. The integration of artificial intelligence (AI) is paramount, with AI-powered diagnostic software automating tasks like cephalometric analysis, reducing a multi-minute manual process to under 30 seconds. This enhances clinical workflow efficiency and diagnostic precision.
  • Another major trend is the convergence toward a fully integrated digital workflow, connecting cone-beam computed tomography and other diagnostic equipment with treatment planning and delivery systems. These connected ecosystems can reduce data transfer errors by over 95%, ensuring greater accuracy in procedures like guided implant surgery and orthodontic treatment.
  • The growing demand for portability is also shaping hardware design, especially for intraoral x-ray imaging in settings requiring flexibility, such as mobile dentistry and domiciliary care.

What challenges does the Dental Radiology Equipment Industry face during its growth?

  • The prohibitive cost of advanced equipment, coupled with constrained capital budgets, presents a key challenge affecting industry growth.

  • Significant challenges constrain market growth, primarily related to cost, regulation, and training. The substantial capital investment required for a state-of-the-art cbct machine, where the total cost of ownership can be triple the initial hardware price, is a major barrier for smaller clinics.
  • Navigating the stringent and fragmented regulatory landscape for medical imaging devices also presents hurdles; securing approvals in multiple major jurisdictions can delay product launches by 18-24 months, adding significant expense. Furthermore, a pronounced shortage of professionals skilled in advanced techniques like cbct interpretation for general dentists creates a bottleneck.
  • This skills gap limits the effective utilization of installed equipment and can deter practices from investing in new technologies like handheld dental x-ray safety protocols, thereby slowing overall market adoption.

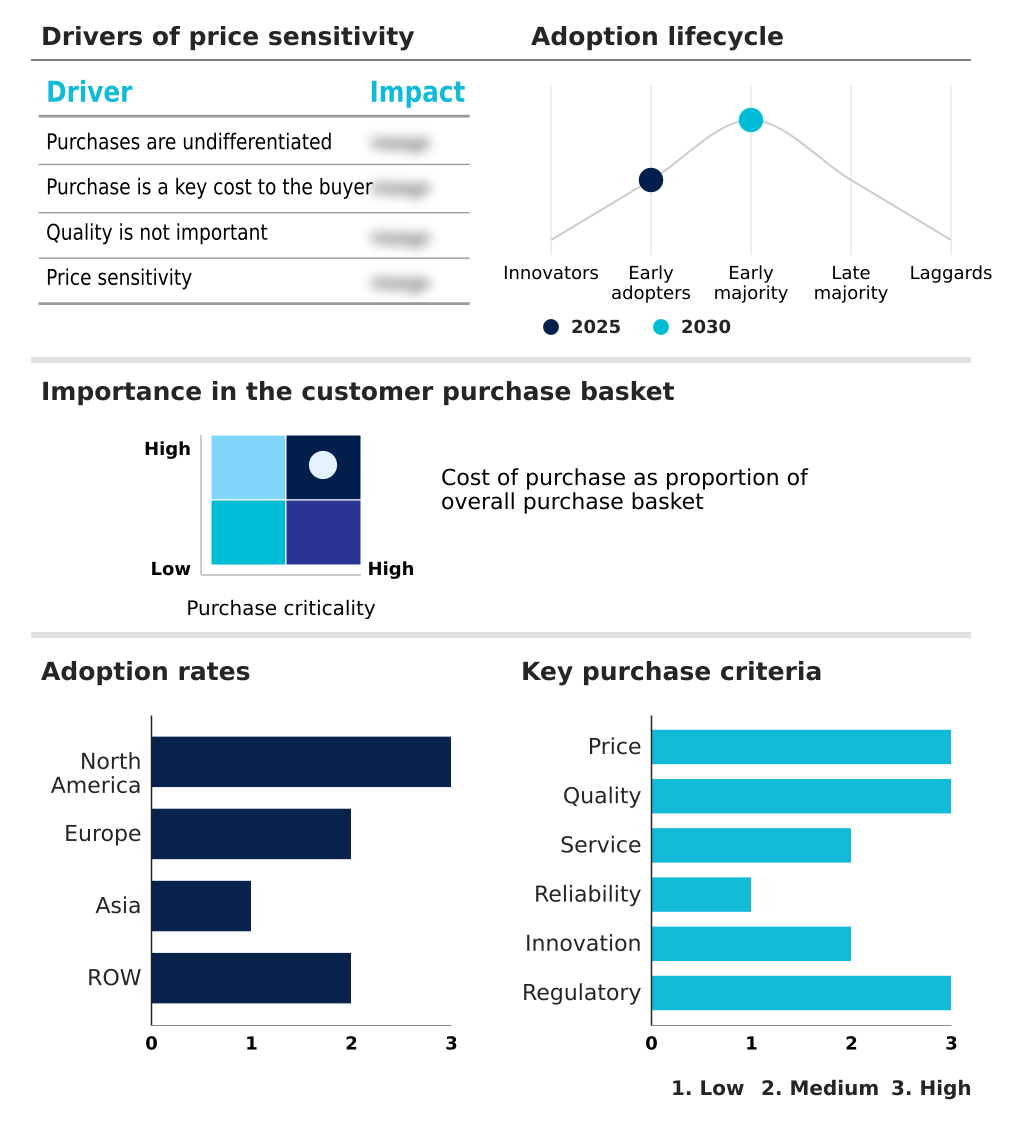
Exclusive Technavio Analysis on Customer Landscape

The dental radiology equipment market forecasting report includes the adoption lifecycle of the market, covering from the innovator’s stage to the laggard’s stage. It focuses on adoption rates in different regions based on penetration. Furthermore, the dental radiology equipment market report also includes key purchase criteria and drivers of price sensitivity to help companies evaluate and develop their market growth analysis strategies.

Customer Landscape of Dental Radiology Equipment Industry

Competitive Landscape

Companies are implementing various strategies, such as strategic alliances, dental radiology equipment market forecast, partnerships, mergers and acquisitions, geographical expansion, and product/service launches, to enhance their presence in the industry.

ACTEON Group - Key offerings encompass a range of diagnostic solutions, from intraoral X-ray systems and digital sensors to advanced cone-beam computed tomography for complex maxillofacial applications and surgical planning.

The industry research and growth report includes detailed analyses of the competitive landscape of the market and information about key companies, including:

  • ACTEON Group
  • Air Techniques Inc.
  • Asahi Roentgen Ind. Co. Ltd
  • Carestream Dental LLC
  • Cefla SC
  • Dentsply Sirona Inc.
  • Envista Holdings Corp.
  • Gnatus Dental Equipments Ltd.
  • HDXWILL North America
  • INTERMEDICAL Srl IMD Group
  • MediRay HealthCare
  • Planmeca Oy
  • PreXion Inc.
  • Shenzhen Anke High tech Co.
  • Simple Smart
  • The Yoshida Dental Mfg. Co.
  • Trident Srl
  • Varex Imaging Corp.
  • Vatech Co. Ltd.

Qualitative and quantitative analysis of companies has been conducted to help clients understand the wider business environment as well as the strengths and weaknesses of key industry players. Data is qualitatively analyzed to categorize companies as pure play, category-focused, industry-focused, and diversified; it is quantitatively analyzed to categorize companies as dominant, leading, strong, tentative, and weak.

Recent Development and News in Dental radiology equipment market

  • In August 2024, Acteon Group launched its X-MIND PRIME 2D panoramic system in Europe, featuring a patented Adaptive Collimation System designed to reduce the patient radiation dose area product by an average of 25%.
  • In March 2025, Heartland Dental initiated a major partnership with AI-based imaging analysis company Diagnocat, deploying its AI software platform across its network of over 1,700 supported dental offices to standardize diagnostic quality.
  • In April 2025, Straumann Group received US Food and Drug Administration clearance for its Virtuo Vivo Pro integrated digital workflow, which seamlessly combines data from its new CBCT unit and intraoral scanner using an AI-powered algorithm.
  • In June 2025, Aetna announced a strategic partnership with a national mobile dental services provider, mandating the use of specific lightweight, FDA-cleared portable intraoral X-ray systems for screenings in assisted living facilities.

Dive into Technavio’s robust research methodology, blending expert interviews, extensive data synthesis, and validated models for unparalleled Dental Radiology Equipment Market insights. See full methodology.

Market Scope
Page number 291
Base year 2025
Historic period 2020-2024
Forecast period 2026-2030
Growth momentum & CAGR Accelerate at a CAGR of 13.4%
Market growth 2026-2030 USD 3420.8 million
Market structure Fragmented
YoY growth 2025-2026(%) 11.9%
Key countries US, Canada, Mexico, Germany, UK, France, Italy, The Netherlands, Spain, China, India, Japan, South Korea, Thailand, Indonesia, Brazil, Argentina, Saudi Arabia, UAE, Chile, Turkey, South Africa and Israel
Competitive landscape Leading Companies, Market Positioning of Companies, Competitive Strategies, and Industry Risks

Request Free Sample

Research Analyst Overview

  • The market is undergoing a fundamental transformation, shifting its focus from hardware-centric sales to integrated, software-driven ecosystems. The value proposition is no longer solely in the cbct system or panoramic x-ray machine itself, but in how seamlessly these devices connect with AI diagnostic software, intraoral scanners, and practice management platforms.
  • This evolution toward a complete digital imaging platform forces a change in boardroom-level strategy, moving from one-time capital expenditure decisions to evaluating long-term operational expenses and subscription-based software models.
  • Innovations in cmos sensor technology and the development of the photostimulable phosphor plate continue to enhance image quality, while the imperative for radiation safety drives the adoption of advanced dose reduction technologies. Clinical studies show that modern low-dose protocols can lower patient exposure by up to 40% without sacrificing diagnostic integrity.
  • As technologies like near-infrared imaging (niri) emerge for caries detection, the competitive landscape will further evolve, demanding that vendors deliver not just a piece of equipment, but a comprehensive, intelligent, and upgradeable diagnostic solution that leverages every aspect of digital radiography and advanced dental imaging.

What are the Key Data Covered in this Dental Radiology Equipment Market Research and Growth Report?

  • What is the expected growth of the Dental Radiology Equipment Market between 2026 and 2030?

    • USD 3.42 billion, at a CAGR of 13.4%

  • What segmentation does the market report cover?

    • The report is segmented by End-user (Dental clinics, Hospitals, and Ambulatory surgical centers), Product (Dental X-ray, and Dental CBCT), Type (Diagnostic equipment, and Therapeutic equipment) and Geography (North America, Europe, Asia, Rest of World (ROW))

  • Which regions are analyzed in the report?

    • North America, Europe, Asia and Rest of World (ROW)

  • What are the key growth drivers and market challenges?

    • Consolidation of dental practices and rise of dental service organizations, Prohibitive cost of advanced equipment and constrained capital budgets

  • Who are the major players in the Dental Radiology Equipment Market?

    • ACTEON Group, Air Techniques Inc., Asahi Roentgen Ind. Co. Ltd, Carestream Dental LLC, Cefla SC, Dentsply Sirona Inc., Envista Holdings Corp., Gnatus Dental Equipments Ltd., HDXWILL North America, INTERMEDICAL Srl IMD Group, MediRay HealthCare, Planmeca Oy, PreXion Inc., Shenzhen Anke High tech Co., Simple Smart, The Yoshida Dental Mfg. Co., Trident Srl, Varex Imaging Corp. and Vatech Co. Ltd.

Market Research Insights

  • Market dynamics are shaped by a push toward greater efficiency and diagnostic precision, where the integration of advanced technologies delivers measurable returns. The adoption of AI-driven diagnostic software, for instance, has been shown to reduce radiograph review times by up to 30%, allowing clinicians to focus on patient care.
  • Similarly, fully integrated digital workflows that connect diagnostic imaging with practice management systems can decrease administrative errors associated with manual data entry by over 15%. This convergence of technologies not only enhances clinical outcomes in areas like endodontic treatment and teledentistry but also strengthens the business case for capital investment by optimizing operational performance and supporting higher-value procedures.
  • These quantifiable benefits are central to purchasing decisions in a competitive landscape.

We can help! Our analysts can customize this dental radiology equipment market research report to meet your requirements.

Get in touch

1. Executive Summary

1.1 Market overview

Executive Summary - Chart on Market Overview
Executive Summary - Data Table on Market Overview
Executive Summary - Chart on Global Market Characteristics
Executive Summary - Chart on Market by Geography
Executive Summary - Chart on Market Segmentation by End-user
Executive Summary - Chart on Market Segmentation by Product
Executive Summary - Chart on Market Segmentation by Type
Executive Summary - Chart on Incremental Growth
Executive Summary - Data Table on Incremental Growth
Executive Summary - Chart on Company Market Positioning

2. Technavio Analysis

2.1 Analysis of price sensitivity, lifecycle, customer purchase basket, adoption rates, and purchase criteria

2.2 Criticality of inputs and Factors of differentiation

Chart on Overview on criticality of inputs and factors of differentiation

2.3 Factors of disruption

Chart on Overview on factors of disruption

2.4 Impact of drivers and challenges

Chart on Impact of drivers and challenges in 2025 and 2030

3. Market Landscape

3.1 Market ecosystem

Chart on Parent Market
Data Table on - Parent Market

3.2 Market characteristics

Chart on Market characteristics analysis

3.3 Value chain analysis

Chart on Value chain analysis

4. Market Sizing

4.1 Market definition

Data Table on Offerings of companies included in the market definition

4.2 Market segment analysis

Market segments

4.3 Market size 2025

4.4 Market outlook: Forecast for 2025-2030

Chart on Global - Market size and forecast 2025-2030 ($ million)
Data Table on Global - Market size and forecast 2025-2030 ($ million)
Chart on Global Market: Year-over-year growth 2025-2030 (%)
Data Table on Global Market: Year-over-year growth 2025-2030 (%)

5. Historic Market Size

5.1 Global Dental Radiology Equipment Market 2020 - 2024

Historic Market Size - Data Table on Global Dental Radiology Equipment Market 2020 - 2024 ($ million)

5.2 End-user segment analysis 2020 - 2024

Historic Market Size - End-user Segment 2020 - 2024 ($ million)

5.3 Product segment analysis 2020 - 2024

Historic Market Size - Product Segment 2020 - 2024 ($ million)

5.4 Type segment analysis 2020 - 2024

Historic Market Size - Type Segment 2020 - 2024 ($ million)

5.5 Geography segment analysis 2020 - 2024

Historic Market Size - Geography Segment 2020 - 2024 ($ million)

5.6 Country segment analysis 2020 - 2024

Historic Market Size - Country Segment 2020 - 2024 ($ million)

6. Qualitative Analysis

6.1 The AI impact on global dental radiology equipment market

7. Five Forces Analysis

7.1 Five forces summary

Five forces analysis - Comparison between 2025 and 2030

7.2 Bargaining power of buyers

Bargaining power of buyers - Impact of key factors 2025 and 2030

7.3 Bargaining power of suppliers

Bargaining power of suppliers - Impact of key factors in 2025 and 2030

7.4 Threat of new entrants

Threat of new entrants - Impact of key factors in 2025 and 2030

7.5 Threat of substitutes

Threat of substitutes - Impact of key factors in 2025 and 2030

7.6 Threat of rivalry

Threat of rivalry - Impact of key factors in 2025 and 2030

7.7 Market condition

Chart on Market condition - Five forces 2025 and 2030

8. Market Segmentation by End-user

8.1 Market segments

Chart on End-user - Market share 2025-2030 (%)
Data Table on End-user - Market share 2025-2030 (%)

8.2 Comparison by End-user

Chart on Comparison by End-user
Data Table on Comparison by End-user

8.3 Dental clinics - Market size and forecast 2025-2030

Chart on Dental clinics - Market size and forecast 2025-2030 ($ million)
Data Table on Dental clinics - Market size and forecast 2025-2030 ($ million)
Chart on Dental clinics - Year-over-year growth 2025-2030 (%)
Data Table on Dental clinics - Year-over-year growth 2025-2030 (%)

8.4 Hospitals - Market size and forecast 2025-2030

Chart on Hospitals - Market size and forecast 2025-2030 ($ million)
Data Table on Hospitals - Market size and forecast 2025-2030 ($ million)
Chart on Hospitals - Year-over-year growth 2025-2030 (%)
Data Table on Hospitals - Year-over-year growth 2025-2030 (%)

8.5 Ambulatory surgical centers - Market size and forecast 2025-2030

Chart on Ambulatory surgical centers - Market size and forecast 2025-2030 ($ million)
Data Table on Ambulatory surgical centers - Market size and forecast 2025-2030 ($ million)
Chart on Ambulatory surgical centers - Year-over-year growth 2025-2030 (%)
Data Table on Ambulatory surgical centers - Year-over-year growth 2025-2030 (%)

8.6 Market opportunity by End-user

Market opportunity by End-user ($ million)
Data Table on Market opportunity by End-user ($ million)

9. Market Segmentation by Product

9.1 Market segments

Chart on Product - Market share 2025-2030 (%)
Data Table on Product - Market share 2025-2030 (%)

9.2 Comparison by Product

Chart on Comparison by Product
Data Table on Comparison by Product

9.3 Dental X-ray - Market size and forecast 2025-2030

Chart on Dental X-ray - Market size and forecast 2025-2030 ($ million)
Data Table on Dental X-ray - Market size and forecast 2025-2030 ($ million)
Chart on Dental X-ray - Year-over-year growth 2025-2030 (%)
Data Table on Dental X-ray - Year-over-year growth 2025-2030 (%)

9.4 Dental CBCT - Market size and forecast 2025-2030

Chart on Dental CBCT - Market size and forecast 2025-2030 ($ million)
Data Table on Dental CBCT - Market size and forecast 2025-2030 ($ million)
Chart on Dental CBCT - Year-over-year growth 2025-2030 (%)
Data Table on Dental CBCT - Year-over-year growth 2025-2030 (%)

9.5 Market opportunity by Product

Market opportunity by Product ($ million)
Data Table on Market opportunity by Product ($ million)

10. Market Segmentation by Type

10.1 Market segments

Chart on Type - Market share 2025-2030 (%)
Data Table on Type - Market share 2025-2030 (%)

10.2 Comparison by Type

Chart on Comparison by Type
Data Table on Comparison by Type

10.3 Diagnostic equipment - Market size and forecast 2025-2030

Chart on Diagnostic equipment - Market size and forecast 2025-2030 ($ million)
Data Table on Diagnostic equipment - Market size and forecast 2025-2030 ($ million)
Chart on Diagnostic equipment - Year-over-year growth 2025-2030 (%)
Data Table on Diagnostic equipment - Year-over-year growth 2025-2030 (%)

10.4 Therapeutic equipment - Market size and forecast 2025-2030

Chart on Therapeutic equipment - Market size and forecast 2025-2030 ($ million)
Data Table on Therapeutic equipment - Market size and forecast 2025-2030 ($ million)
Chart on Therapeutic equipment - Year-over-year growth 2025-2030 (%)
Data Table on Therapeutic equipment - Year-over-year growth 2025-2030 (%)

10.5 Market opportunity by Type

Market opportunity by Type ($ million)
Data Table on Market opportunity by Type ($ million)

11. Customer Landscape

11.1 Customer landscape overview

Analysis of price sensitivity, lifecycle, customer purchase basket, adoption rates, and purchase criteria

12. Geographic Landscape

12.1 Geographic segmentation

Chart on Market share by geography 2025-2030 (%)
Data Table on Market share by geography 2025-2030 (%)

12.2 Geographic comparison

Chart on Geographic comparison
Data Table on Geographic comparison

12.3 North America - Market size and forecast 2025-2030

Chart on North America - Market size and forecast 2025-2030 ($ million)
Data Table on North America - Market size and forecast 2025-2030 ($ million)
Chart on North America - Year-over-year growth 2025-2030 (%)
Data Table on North America - Year-over-year growth 2025-2030 (%)
Chart on Regional Comparison - North America
Data Table on Regional Comparison - North America

12.3.1 US - Market size and forecast 2025-2030

Chart on US - Market size and forecast 2025-2030 ($ million)
Data Table on US - Market size and forecast 2025-2030 ($ million)
Chart on US - Year-over-year growth 2025-2030 (%)
Data Table on US - Year-over-year growth 2025-2030 (%)

12.3.2 Canada - Market size and forecast 2025-2030

Chart on Canada - Market size and forecast 2025-2030 ($ million)
Data Table on Canada - Market size and forecast 2025-2030 ($ million)
Chart on Canada - Year-over-year growth 2025-2030 (%)
Data Table on Canada - Year-over-year growth 2025-2030 (%)

12.3.3 Mexico - Market size and forecast 2025-2030

Chart on Mexico - Market size and forecast 2025-2030 ($ million)
Data Table on Mexico - Market size and forecast 2025-2030 ($ million)
Chart on Mexico - Year-over-year growth 2025-2030 (%)
Data Table on Mexico - Year-over-year growth 2025-2030 (%)

12.4 Europe - Market size and forecast 2025-2030

Chart on Europe - Market size and forecast 2025-2030 ($ million)
Data Table on Europe - Market size and forecast 2025-2030 ($ million)
Chart on Europe - Year-over-year growth 2025-2030 (%)
Data Table on Europe - Year-over-year growth 2025-2030 (%)
Chart on Regional Comparison - Europe
Data Table on Regional Comparison - Europe

12.4.1 Germany - Market size and forecast 2025-2030

Chart on Germany - Market size and forecast 2025-2030 ($ million)
Data Table on Germany - Market size and forecast 2025-2030 ($ million)
Chart on Germany - Year-over-year growth 2025-2030 (%)
Data Table on Germany - Year-over-year growth 2025-2030 (%)

12.4.2 UK - Market size and forecast 2025-2030

Chart on UK - Market size and forecast 2025-2030 ($ million)
Data Table on UK - Market size and forecast 2025-2030 ($ million)
Chart on UK - Year-over-year growth 2025-2030 (%)
Data Table on UK - Year-over-year growth 2025-2030 (%)

12.4.3 France - Market size and forecast 2025-2030

Chart on France - Market size and forecast 2025-2030 ($ million)
Data Table on France - Market size and forecast 2025-2030 ($ million)
Chart on France - Year-over-year growth 2025-2030 (%)
Data Table on France - Year-over-year growth 2025-2030 (%)

12.4.4 Italy - Market size and forecast 2025-2030

Chart on Italy - Market size and forecast 2025-2030 ($ million)
Data Table on Italy - Market size and forecast 2025-2030 ($ million)
Chart on Italy - Year-over-year growth 2025-2030 (%)
Data Table on Italy - Year-over-year growth 2025-2030 (%)

12.4.5 The Netherlands - Market size and forecast 2025-2030

Chart on The Netherlands - Market size and forecast 2025-2030 ($ million)
Data Table on The Netherlands - Market size and forecast 2025-2030 ($ million)
Chart on The Netherlands - Year-over-year growth 2025-2030 (%)
Data Table on The Netherlands - Year-over-year growth 2025-2030 (%)

12.4.6 Spain - Market size and forecast 2025-2030

Chart on Spain - Market size and forecast 2025-2030 ($ million)
Data Table on Spain - Market size and forecast 2025-2030 ($ million)
Chart on Spain - Year-over-year growth 2025-2030 (%)
Data Table on Spain - Year-over-year growth 2025-2030 (%)

12.5 Asia - Market size and forecast 2025-2030

Chart on Asia - Market size and forecast 2025-2030 ($ million)
Data Table on Asia - Market size and forecast 2025-2030 ($ million)
Chart on Asia - Year-over-year growth 2025-2030 (%)
Data Table on Asia - Year-over-year growth 2025-2030 (%)
Chart on Regional Comparison - Asia
Data Table on Regional Comparison - Asia

12.5.1 China - Market size and forecast 2025-2030

Chart on China - Market size and forecast 2025-2030 ($ million)
Data Table on China - Market size and forecast 2025-2030 ($ million)
Chart on China - Year-over-year growth 2025-2030 (%)
Data Table on China - Year-over-year growth 2025-2030 (%)

12.5.2 India - Market size and forecast 2025-2030

Chart on India - Market size and forecast 2025-2030 ($ million)
Data Table on India - Market size and forecast 2025-2030 ($ million)
Chart on India - Year-over-year growth 2025-2030 (%)
Data Table on India - Year-over-year growth 2025-2030 (%)

12.5.3 Japan - Market size and forecast 2025-2030

Chart on Japan - Market size and forecast 2025-2030 ($ million)
Data Table on Japan - Market size and forecast 2025-2030 ($ million)
Chart on Japan - Year-over-year growth 2025-2030 (%)
Data Table on Japan - Year-over-year growth 2025-2030 (%)

12.5.4 South Korea - Market size and forecast 2025-2030

Chart on South Korea - Market size and forecast 2025-2030 ($ million)
Data Table on South Korea - Market size and forecast 2025-2030 ($ million)
Chart on South Korea - Year-over-year growth 2025-2030 (%)
Data Table on South Korea - Year-over-year growth 2025-2030 (%)

12.5.5 Thailand - Market size and forecast 2025-2030

Chart on Thailand - Market size and forecast 2025-2030 ($ million)
Data Table on Thailand - Market size and forecast 2025-2030 ($ million)
Chart on Thailand - Year-over-year growth 2025-2030 (%)
Data Table on Thailand - Year-over-year growth 2025-2030 (%)

12.5.6 Indonesia - Market size and forecast 2025-2030

Chart on Indonesia - Market size and forecast 2025-2030 ($ million)
Data Table on Indonesia - Market size and forecast 2025-2030 ($ million)
Chart on Indonesia - Year-over-year growth 2025-2030 (%)
Data Table on Indonesia - Year-over-year growth 2025-2030 (%)

12.6 Rest of World (ROW) - Market size and forecast 2025-2030

Chart on Rest of World (ROW) - Market size and forecast 2025-2030 ($ million)
Data Table on Rest of World (ROW) - Market size and forecast 2025-2030 ($ million)
Chart on Rest of World (ROW) - Year-over-year growth 2025-2030 (%)
Data Table on Rest of World (ROW) - Year-over-year growth 2025-2030 (%)
Chart on Regional Comparison - Rest of World (ROW)
Data Table on Regional Comparison - Rest of World (ROW)

12.6.1 Brazil - Market size and forecast 2025-2030

Chart on Brazil - Market size and forecast 2025-2030 ($ million)
Data Table on Brazil - Market size and forecast 2025-2030 ($ million)
Chart on Brazil - Year-over-year growth 2025-2030 (%)
Data Table on Brazil - Year-over-year growth 2025-2030 (%)

12.6.2 Argentina - Market size and forecast 2025-2030

Chart on Argentina - Market size and forecast 2025-2030 ($ million)
Data Table on Argentina - Market size and forecast 2025-2030 ($ million)
Chart on Argentina - Year-over-year growth 2025-2030 (%)
Data Table on Argentina - Year-over-year growth 2025-2030 (%)

12.6.3 Saudi Arabia - Market size and forecast 2025-2030

Chart on Saudi Arabia - Market size and forecast 2025-2030 ($ million)
Data Table on Saudi Arabia - Market size and forecast 2025-2030 ($ million)
Chart on Saudi Arabia - Year-over-year growth 2025-2030 (%)
Data Table on Saudi Arabia - Year-over-year growth 2025-2030 (%)

12.6.4 UAE - Market size and forecast 2025-2030

Chart on UAE - Market size and forecast 2025-2030 ($ million)
Data Table on UAE - Market size and forecast 2025-2030 ($ million)
Chart on UAE - Year-over-year growth 2025-2030 (%)
Data Table on UAE - Year-over-year growth 2025-2030 (%)

12.6.5 Chile - Market size and forecast 2025-2030

Chart on Chile - Market size and forecast 2025-2030 ($ million)
Data Table on Chile - Market size and forecast 2025-2030 ($ million)
Chart on Chile - Year-over-year growth 2025-2030 (%)
Data Table on Chile - Year-over-year growth 2025-2030 (%)

12.6.6 Turkey - Market size and forecast 2025-2030

Chart on Turkey - Market size and forecast 2025-2030 ($ million)
Data Table on Turkey - Market size and forecast 2025-2030 ($ million)
Chart on Turkey - Year-over-year growth 2025-2030 (%)
Data Table on Turkey - Year-over-year growth 2025-2030 (%)

12.6.7 South Africa - Market size and forecast 2025-2030

Chart on South Africa - Market size and forecast 2025-2030 ($ million)
Data Table on South Africa - Market size and forecast 2025-2030 ($ million)
Chart on South Africa - Year-over-year growth 2025-2030 (%)
Data Table on South Africa - Year-over-year growth 2025-2030 (%)

12.6.8 Israel - Market size and forecast 2025-2030

Chart on Israel - Market size and forecast 2025-2030 ($ million)
Data Table on Israel - Market size and forecast 2025-2030 ($ million)
Chart on Israel - Year-over-year growth 2025-2030 (%)
Data Table on Israel - Year-over-year growth 2025-2030 (%)

12.7 Market opportunity by geography

Market opportunity by geography ($ million)
Data Tables on Market opportunity by geography ($ million)

13. Drivers, Challenges, and Opportunity

13.1 Market drivers

Consolidation of dental practices and rise of dental service organizations
Rising incidence of oral diseases and favorable demographic trends
Expanding adoption of cosmetic dentistry and implantology

13.2 Market challenges

Prohibitive cost of advanced equipment and constrained capital budgets
Navigating stringent and fragmented regulatory landscape
Deficit of skilled professionals and imperative for specialized training

13.3 Impact of drivers and challenges

Impact of drivers and challenges in 2025 and 2030

13.4 Market opportunities

Ascendancy of artificial intelligence in diagnostic imaging
Convergence towards integrated digital ecosystems
Emphasis on portability, miniaturization, and ergonomics

14. Competitive Landscape

14.1 Overview

14.2

Overview on criticality of inputs and factors of differentiation

14.3 Landscape disruption

Overview on factors of disruption

14.4 Industry risks

Impact of key risks on business

15. Competitive Analysis

15.1 Companies profiled

Companies covered

15.2 Company ranking index

15.3 Market positioning of companies

Matrix on companies position and classification

15.4 ACTEON Group

ACTEON Group - Overview
ACTEON Group - Product / Service
ACTEON Group - Key offerings
SWOT

15.5 Air Techniques Inc.

Air Techniques Inc. - Overview
Air Techniques Inc. - Product / Service
Air Techniques Inc. - Key offerings
SWOT

15.6 Asahi Roentgen Ind. Co. Ltd

Asahi Roentgen Ind. Co. Ltd - Overview
Asahi Roentgen Ind. Co. Ltd - Product / Service
Asahi Roentgen Ind. Co. Ltd - Key offerings
SWOT

15.7 Carestream Dental LLC

Carestream Dental LLC - Overview
Carestream Dental LLC - Product / Service
Carestream Dental LLC - Key offerings
SWOT

15.8 Cefla SC

Cefla SC - Overview
Cefla SC - Product / Service
Cefla SC - Key offerings
SWOT

15.9 Dentsply Sirona Inc.

Dentsply Sirona Inc. - Overview
Dentsply Sirona Inc. - Business segments
Dentsply Sirona Inc. - Key news
Dentsply Sirona Inc. - Key offerings
Dentsply Sirona Inc. - Segment focus
SWOT

15.10 Envista Holdings Corp.

Envista Holdings Corp. - Overview
Envista Holdings Corp. - Business segments
Envista Holdings Corp. - Key news
Envista Holdings Corp. - Key offerings
Envista Holdings Corp. - Segment focus
SWOT

15.11 Gnatus Dental Equipments Ltd.

Gnatus Dental Equipments Ltd. - Overview
Gnatus Dental Equipments Ltd. - Product / Service
Gnatus Dental Equipments Ltd. - Key offerings
SWOT

15.12 Planmeca Oy

Planmeca Oy - Overview
Planmeca Oy - Product / Service
Planmeca Oy - Key offerings
SWOT

15.13 PreXion Inc.

PreXion Inc. - Overview
PreXion Inc. - Product / Service
PreXion Inc. - Key offerings
SWOT

15.14 Shenzhen Anke High tech Co.

Shenzhen Anke High tech Co. - Overview
Shenzhen Anke High tech Co. - Product / Service
Shenzhen Anke High tech Co. - Key offerings
SWOT

15.15 The Yoshida Dental Mfg. Co.

The Yoshida Dental Mfg. Co. - Overview
The Yoshida Dental Mfg. Co. - Product / Service
The Yoshida Dental Mfg. Co. - Key offerings
SWOT

15.16 Trident Srl

Trident Srl - Overview
Trident Srl - Product / Service
Trident Srl - Key offerings
SWOT

15.17 Varex Imaging Corp.

Varex Imaging Corp. - Overview
Varex Imaging Corp. - Business segments
Varex Imaging Corp. - Key offerings
Varex Imaging Corp. - Segment focus
SWOT

15.18 Vatech Co. Ltd.

Vatech Co. Ltd. - Overview
Vatech Co. Ltd. - Product / Service
Vatech Co. Ltd. - Key offerings
SWOT

16. Appendix

16.1 Scope of the report

Market definition
Objectives
Notes and caveats

16.2 Inclusions and exclusions checklist

Inclusions checklist
Exclusions checklist

16.3 Currency conversion rates for US$

16.4 Research methodology

16.5 Data procurement

Information sources

16.6 Data validation

16.7 Validation techniques employed for market sizing

16.8 Data synthesis

16.9 360 degree market analysis

16.10 List of abbreviations

Research Methodology

Technavio presents a detailed picture of the market by way of study, synthesis, and summation of data from multiple sources. The analysts have presented the various facets of the market with a particular focus on identifying the key industry influencers. The data thus presented is comprehensive, reliable, and the result of extensive research, both primary and secondary.

INFORMATION SOURCES

Primary sources

  • Manufacturers and suppliers
  • Channel partners
  • Industry experts
  • Strategic decision makers

Secondary sources

  • Industry journals and periodicals
  • Government data
  • Financial reports of key industry players
  • Historical data
  • Press releases

DATA ANALYSIS

Data Synthesis

  • Collation of data
  • Estimation of key figures
  • Analysis of derived insights

Data Validation

  • Triangulation with data models
  • Reference against proprietary databases
  • Corroboration with industry experts

REPORT WRITING

Qualitative

  • Market drivers
  • Market challenges
  • Market trends
  • Five forces analysis

Quantitative

  • Market size and forecast
  • Market segmentation
  • Geographical insights
  • Competitive landscape

Interested in this report?

Get your sample now to see our research methodology and insights!

Download Now

Frequently Asked Questions

Dental Radiology Equipment market growth will increase by USD 3420.8 million during 2026-2030.

The Dental Radiology Equipment market is expected to grow at a CAGR of 13.4% during 2026-2030.

Dental Radiology Equipment market is segmented by End-user (Dental clinics, Hospitals, Ambulatory surgical centers) Product (Dental X-ray, Dental CBCT) Type (Diagnostic equipment, Therapeutic equipment)

ACTEON Group, Air Techniques Inc., Asahi Roentgen Ind. Co. Ltd, Carestream Dental LLC, Cefla SC, Dentsply Sirona Inc., Envista Holdings Corp., Gnatus Dental Equipments Ltd., HDXWILL North America, INTERMEDICAL Srl IMD Group, MediRay HealthCare, Planmeca Oy, PreXion Inc., Shenzhen Anke High tech Co., Simple Smart, The Yoshida Dental Mfg. Co., Trident Srl, Varex Imaging Corp., Vatech Co. Ltd. are a few of the key vendors in the Dental Radiology Equipment market.

North America will register the highest growth rate of 40% among the other regions. Therefore, the Dental Radiology Equipment market in North America is expected to garner significant business opportunities for the vendors during the forecast period.

US, Canada, Mexico, Germany, UK, France, Italy, The Netherlands, Spain, China, India, Japan, South Korea, Thailand, Indonesia, Brazil, Argentina, Saudi Arabia, UAE, Chile, Turkey, South Africa, Israel

  • Consolidation of dental practices and rise of dental service organizations is the driving factor this market.

The Dental Radiology Equipment market vendors should focus on grabbing business opportunities from the End-user segment as it accounted for the largest market share in the base year.