Deep Sea Robot Market Analysis North America, Europe, APAC, Middle East and Africa, South America - US, Canada, China, Germany, Norway - Size and Forecast 2024-2028

Deep Sea Robot Market Analysis North America, Europe, APAC, Middle East and Africa, South America - US, Canada, China, Germany, Norway - Size and Forecast 2024-2028

Published: Mar 2024 175 Pages SKU: IRTNTR75479

Market Overview at a Glance

$2.09 B
Market Opportunity
12.05%
CAGR
10.78
YoY growth 2023-2024(%)

Deep Sea Robot Market Size 2024-2028

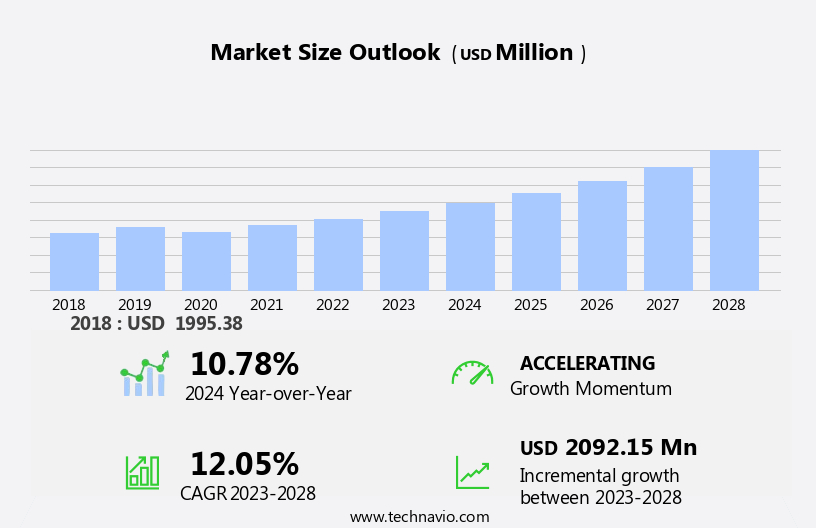
The deep sea robot market size is forecast to increase by USD 2.09 billion, at a CAGR of 12.05% between 2023 and 2028.

  • The market is witnessing significant growth due to the increasing demand for underwater exploration and maritime security. The market is driven by the growing trend of using Unmanned Underwater Vehicles (UUVs) for various applications such as oceanography research, leak detection in pipelines, and submarine inspections. The high cost of developing deep sea robots, primarily due to the use of expensive materials like titanium, nickel, cobalt, and copper, acts as a challenge for market growth. However, advancements in battery technology, such as the use of zinc-air batteries, and the integration of advanced sensors and software for improved functionality, act as catalysts for market expansion. Furthermore, the use of deep sea robots in construction projects and maritime security, including torpedo detection and drone applications, is also contributing to market growth.

What will be the Size of the Deep Sea Robot Market During the Forecast Period?

Deep Sea Robot Market Size

 Request Free Sample

  • The market encompasses the design, production, and application of underwater exploration robots, including submersibles, submarines, underwater surveillance vehicles, and torpedoes. Driven by the demand for advanced ocean exploration and underwater surveillance, this market continues to expand, particularly in sectors such as oil and gas, oceanography, and anti-submarine warfare. These robots often feature cube-like structures, propellers for maneuverability, and cameras and manipulator arms for data collection. 
  • They can navigate ocean depths, employing sonar pulses, electromagnetic waves, and free-space optical (FSO) technology to map the seafloor and detect objects. Utilized for tasks ranging from underwater inspections of shipwrecks to the monitoring of marine life, deep sea robots are increasingly integral to our understanding of the ocean's mysteries and resources.

How is this Deep Sea Robot Industry segmented and which is the largest segment?

The deep sea robot industry research report provides comprehensive data (region-wise segment analysis), with forecasts and estimates in "USD billion" for the period 2024-2028, as well as historical data from 2018-2022 for the following segments.
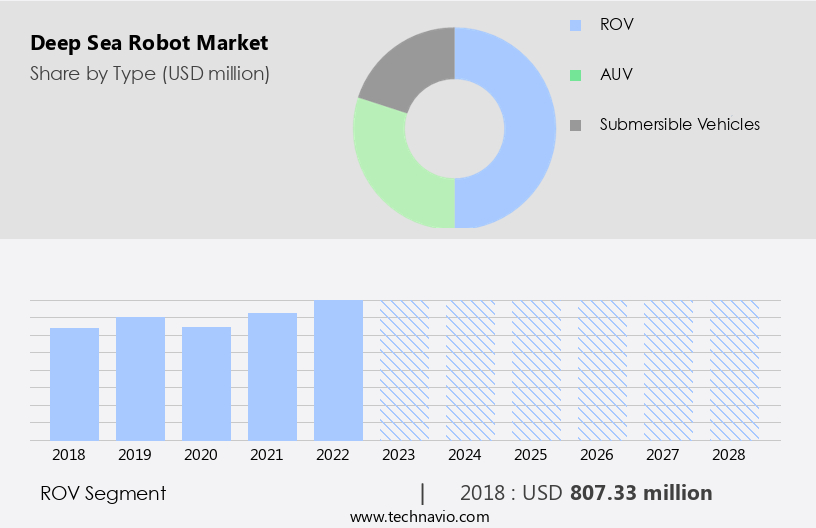
  • Type
    • ROV
    • AUV
    • Submersible vehicles
  • Application
    • Commercial exploration
    • Defense and security
    • Scientific research
  • Geography
    • North America
      • Canada
      • US
    • Europe
      • Germany
      • Norway
    • APAC
      • China
    • Middle East and Africa
    • South America

By Type Insights

  • The ROV segment is estimated to witness significant growth during the forecast period.

Deep-sea robots, specifically Remotely Operated Vehicles (ROVs,) have gained significant importance in various industries, including oil and gas, marine biology, and oceanography. Equipped with cameras, sensors, and manipulator arms, ROVs can navigate and execute tasks In the deep ocean. In the oil and gas sector, ROVs are instrumental for underwater exploration, pipeline maintenance, and repair. They enable precise and accurate inspections of underwater structures, while also featuring oil leak detection systems to minimize environmental damage. In marine biology, ROVs facilitate research and exploration of the underwater world, contributing to the discovery of new marine species and the study of existing ones.

Advanced ROVs incorporate AI software, autonomous navigation, and environmental perception, enhancing their functionality. The commercial exploration segment and defense & security sectors also utilize ROVs for tasks such as shipwreck exploration, sonar technology, and anti-submarine warfare. Companies are at the forefront of ROV development. ROVs are essential tools for underwater surveillance and exploration, providing valuable insights and data in a safe and efficient manner.

Deep Sea Robot Market Size

Get a glance at the market report of share of various segments Request Free Sample

The ROV segment was valued at USD 807.33 million in 2018 and showed a gradual increase during the forecast period.
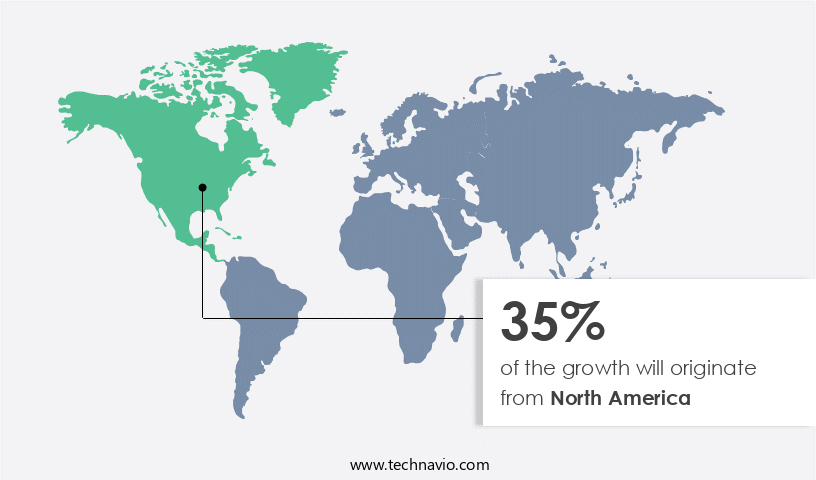
Regional Analysis

  • North America is estimated to contribute 35% to the growth of the global market during the forecast period.

Technavio's analysts have elaborately explained the regional trends and drivers that shape the market during the forecast period.

Deep Sea Robot Market Share by Geography

For more insights on the market share of various regions, Request Free Sample

Deep sea robots have gained significant traction in various industries, including oil and gas, defense, and underwater exploration. The North American market for deep sea robots is experiencing substantial growth due to the presence of key players and favorable government initiatives. A primary driver of this growth is the increasing demand for deep sea robots In the oil and gas sector. Major oil and gas companies in North America have invested heavily In the development of these robots for exploration and production activities. Deep sea robots are employed for underwater surveillance, self-maintenance, and autonomous navigation. 

They feature advanced technologies such as AI software, cameras, manipulator arms, sonar technology, and propellers. Applications include underwater exploration, shipwreck detection, and commercial exploration. Additionally, deep sea robots are utilized in anti-submarine warfare and defense and security sectors. The ROVs and commercial exploration segments are expected to dominate the market. Deep sea robots offer numerous benefits, including reduced crew requirements, increased efficiency, and enhanced safety.

Market Dynamics

Our researchers analyzed the data with 2023 as the base year, along with the key drivers, trends, and challenges. A holistic analysis of drivers will help companies refine their marketing strategies to gain a competitive advantage.

What are the key market drivers leading to the rise In the adoption of Deep Sea Robot Industry?

Growing demand for oceanography research is the key driver of the market.

  • The market is experiencing significant growth due to the increasing demand for underwater surveillance and exploration. This includes the oil & gas sector's reliance on submersibles for underwater inspections and maintenance, as well as commercial exploration and defence & security applications. Self-maintenance, environmental perception, autonomous navigation, and AI software are key features driving the development of advanced deep-sea robots. Deep-sea robots are used for various purposes, such as underwater exploration, oceanography, anti-submarine warfare, and commercial exploration. These robots come in various forms, including cube-like structures with propellers, cameras, manipulator arms, and sonar technology. Some are modeled after submarines or torpedoes, while others resemble eels or have unique designs.
  • Deep-sea robots are essential for exploring the ocean depths, where human presence is limited or impossible. They can withstand extreme pressure and temperature conditions, as well as navigate through challenging environments. These robots can also collect valuable data on shipwrecks, seafloor geology, and marine life, which is crucial for scientific research and resource management. Sonar technology, including sonar pulses and electromagnetic waves, is a critical component of deep-sea robots. They can also use free-space optical (FSO) and sound waves to communicate with surface vessels or other underwater robots. Seawater and surface ambient noise can affect the performance of deep-sea robots, making it essential to design them with advanced technologies to mitigate these challenges.

What are the market trends shaping the Deep Sea Robot Industry?

Increasing deployment of UUVs is the upcoming market trend.

  • Underwater drones, also known as Unmanned Underwater Vehicles (UUVs), are gaining significant attention due to the increasing demand for underwater surveillance in various sectors. UUVs are utilized for diverse applications, including naval mine detection, seabed mapping, seabed mining, underwater mine searches, and recovery missions. Equipped with sonar systems and oceanographic sensors, these drones enable effective monitoring of underwater environments. The need for underwater surveillance is escalating due to security concerns, particularly in relation to naval bases, offshore oil-and-gas production and transport facilities, and nuclear power plants. Furthermore, environmental concerns are driving the demand for monitoring water quality and detecting pollutants in sensitive areas and larger basins.
  • UUVs are instrumental in underwater exploration, with companies such as Nauticus Robotics, Vaarst, Equinor, Open Ocean Robotics, and Schilling Robotics leading the way in this field. These drones employ AI software, autonomous navigation, and environmental perception to navigate the ocean depths. They come in various forms, including cube-like structures with propellers and cameras, as well as manipulator arms. UUVs are also used in commercial exploration, such as oil and gas industries, and in defense and security applications, including anti-submarine warfare. Sonar technology, which is a critical component of UUVs, emits sonar pulses and detects electromagnetic waves or sound waves In the seawater.
  • However, surface ambient noise can interfere with sonar detection, necessitating advanced technologies like Free-space optical (FSO) for clearer communication between UUVs and their operators. UUVs have replaced crewed submarines and torpedoes in several applications, providing a safer and more cost-effective solution. Aquanauts, human divers, are increasingly being replaced by UUVs due to their ability to operate in harsh conditions and for extended periods without the need for crew members. Unmanned drone systems, such as UUVs, are revolutionizing underwater exploration and surveillance, offering significant benefits to various industries and governments.

What challenges does the Deep Sea Robot Industry face during its growth?

The high cost of development of deep sea robots is a key challenge affecting the industry growth.

  • Deep sea robots, also known as underwater exploration robots, are essential tools for underwater surveillance and commercial exploration in various industries, including oil & gas and defence & security. The demand for these robots is driven by the need to explore the vast ocean depths, where human presence is limited due to extreme conditions. These robots come in various forms, such as submersibles, self-maintenance vehicles, and autonomous underwater vehicles (AUVs). They are equipped with AI software, cameras, manipulator arms, sonar technology, and other advanced features for environmental perception, autonomous navigation, and commercial exploration. The development of deep sea robots is a complex and costly process due to the requirement for specialized materials and components.
  • These robots must be constructed from materials that can withstand extreme pressures, temperatures, and corrosive seawater. For instance, ROVs (Remotely Operated Vehicles) used in oceanography and anti-submarine warfare are often made of titanium and other strong metals. Companies like Nauticus Robotics, Vaarst, Equinor, Open Ocean Robotics, and Schilling Robotics are leading the way in this field, using the latest technologies to create advanced deep sea robots. The ROVs segment and commercial exploration segment are expected to dominate the market due to their wide applications and increasing demand. Deep sea robots are used for various purposes, including underwater surveillance, exploration of shipwrecks, and even the inspection of submarines and torpedoes.

Exclusive Customer Landscape

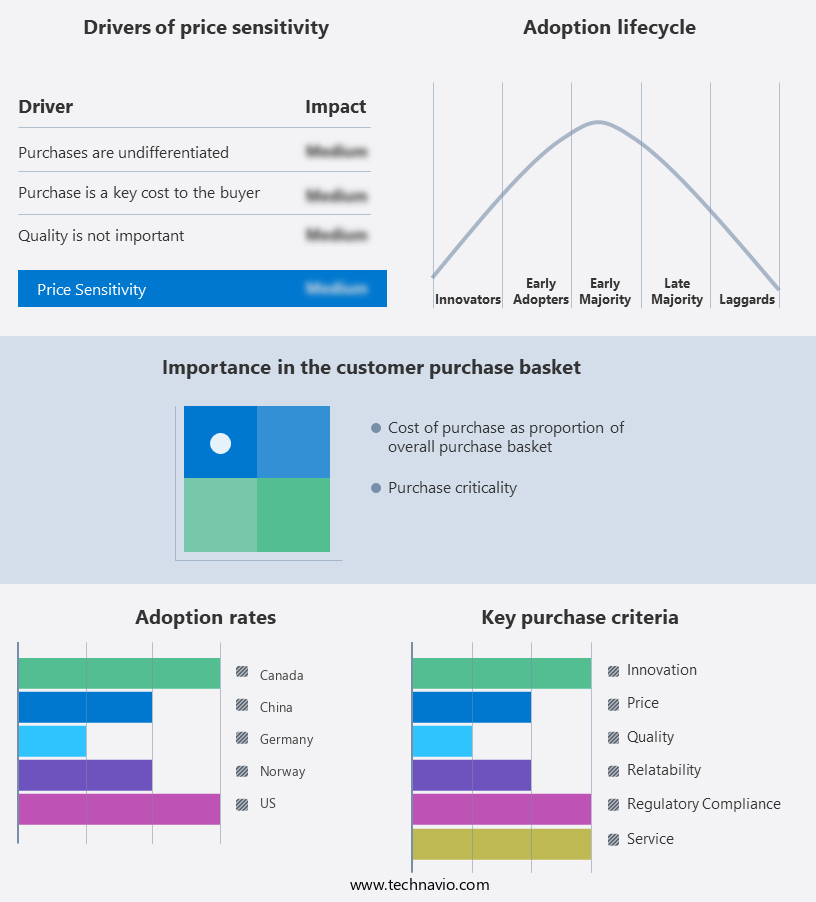
The deep sea robot market forecasting report includes the adoption lifecycle of the market, covering from the innovator's stage to the laggard's stage. It focuses on adoption rates in different regions based on penetration. Furthermore, the deep sea robot market report also includes key purchase criteria and drivers of price sensitivity to help companies evaluate and develop their market growth analysis strategies.

Deep Sea Robot Market Share by Geography

 Customer Landscape

Key Companies & Market Insights

Companies are implementing various strategies, such as strategic alliances, deep sea robot market forecast, partnerships, mergers and acquisitions, geographical expansion, and product/service launches, to enhance their presence In the industry.

The industry research and growth report includes detailed analyses of the competitive landscape of the market and information about key companies, including:

  • BAE Systems Plc
  • Blue Robotics Inc.
  • CRRC Corp. Ltd.
  • Deep Ocean Engineering Inc.
  • DOER Marine
  • Exail Technologies
  • Forum Energy Technologies Inc.
  • Halma Plc
  • International Submarine Engineering Ltd.
  • Kongsberg Gruppen ASA
  • L3Harris Technologies Inc.
  • Lockheed Martin Corp.
  • Mariscope
  • Nauticus Robotics Inc.
  • Oceaneering International Inc.
  • ROVOP Ltd.
  • Saab AB
  • Shark Marine Technologies Inc.
  • TechnipFMC plc
  • VideoRay LLC

Qualitative and quantitative analysis of companies has been conducted to help clients understand the wider business environment as well as the strengths and weaknesses of key industry players. Data is qualitatively analyzed to categorize companies as pure play, category-focused, industry-focused, and diversified; it is quantitatively analyzed to categorize companies as dominant, leading, strong, tentative, and weak.

Research Analyst Overview

The market is experiencing significant growth due to the increasing demand for underwater surveillance and exploration. Robots designed for underwater applications are becoming increasingly important in various sectors, including oceanography, oil and gas, commercial exploration, and defense and security. Underwater exploration robots, also known as underwater robots or autonomous underwater vehicles (AUVs), are gaining popularity due to their ability to operate in extreme ocean depths and collect valuable data. These robots are typically designed with advanced features such as self-maintenance, environmental perception, and autonomous navigation. Self-maintenance is a crucial aspect of deep-sea robots, as the harsh underwater environment can cause significant wear and tear on the machinery.

Further, robots equipped with self-maintenance capabilities can extend their operational lifespan and reduce the need for costly and time-consuming maintenance and repair. Environmental perception is another essential feature of deep-sea robots, as they must be able to navigate and interact with their environment effectively. Advanced sensors and AI software enable robots to perceive their surroundings and make informed decisions based on the data they collect. Autonomous navigation is a critical component of deep-sea robots, as it allows them to operate independently and cover large areas of the ocean floor. This capability is particularly important in commercial exploration, where robots are used to search for resources such as minerals and oil and gas deposits.

In addition, deep-sea robots are also being used in defense and security applications, including anti-submarine warfare and underwater surveillance. These robots are equipped with advanced sonar technology, which allows them to detect and track underwater objects, including submarines and torpedoes. The oil and gas sector is another significant market for deep-sea robots, particularly In the ROVs (remotely operated vehicles) segment. These robots are used for underwater inspections, maintenance, and repair of offshore installations and pipelines. The commercial exploration segment is also experiencing significant growth, with deep-sea robots being used to explore the ocean floor for resources and to study marine life.

Market Scope

Report Coverage

Details

Page number

175

Base year

2023

Historic period

2018-2022

Forecast period

2024-2028

Growth momentum & CAGR

Accelerate at a CAGR of 12.05%

Market Growth 2024-2028

USD 2.09 billion

Market structure

Fragmented

YoY growth 2023-2024(%)

10.78

Key countries

US, Canada, China, Germany, and Norway

Competitive landscape

Leading Companies, Market Positioning of Companies, Competitive Strategies, and Industry Risks

Request Free Sample

What are the Key Data Covered in this Deep Sea Robot Market Research and Growth Report?

  • CAGR of the Deep Sea Robot industry during the forecast period
  • Detailed information on factors that will drive the market growth and forecasting between 2024 and 2028
  • Precise estimation of the size of the market and its contribution of the industry in focus to the parent market
  • Accurate predictions about upcoming growth and trends and changes in consumer behaviour
  • Growth of the market across North America, Europe, APAC, Middle East and Africa, and South America
  • Thorough analysis of the market's competitive landscape and detailed information about companies
  • Comprehensive analysis of factors that will challenge the deep sea robot market growth of industry companies

We can help! Our analysts can customize this deep sea robot market research report to meet your requirements.

Get in touch

1 Executive Summary

  • 1.1 Market overview
    • Exhibit 01: Executive Summary – Chart on Market Overview
    • Exhibit 02: Executive Summary – Data Table on Market Overview
    • Exhibit 03: Executive Summary – Chart on Global Market Characteristics
    • Exhibit 04: Executive Summary – Chart on Market by Geography
    • Exhibit 05: Executive Summary – Chart on Market Segmentation by Type
    • Exhibit 06: Executive Summary – Chart on Market Segmentation by Application
    • Exhibit 07: Executive Summary – Chart on Incremental Growth
    • Exhibit 08: Executive Summary – Data Table on Incremental Growth
    • Exhibit 09: Executive Summary – Chart on Vendor Market Positioning

2 Market Landscape

  • 2.1 Market ecosystem
    • Exhibit 10: Parent market
    • Exhibit 11: Market Characteristics

3 Market Sizing

  • 3.1 Market definition
    • Exhibit 12: Offerings of vendors included in the market definition
  • 3.2 Market segment analysis
    • Exhibit 13: Market segments
  • 3.3 Market size 2023
    • 3.4 Market outlook: Forecast for 2023-2028
      • Exhibit 14: Chart on Global - Market size and forecast 2023-2028 ($ million)
      • Exhibit 15: Data Table on Global - Market size and forecast 2023-2028 ($ million)
      • Exhibit 16: Chart on Global Market: Year-over-year growth 2023-2028 (%)
      • Exhibit 17: Data Table on Global Market: Year-over-year growth 2023-2028 (%)

    4 Historic Market Size

    • 4.1 Global deep sea robot market 2018 - 2022
      • Exhibit 18: Historic Market Size – Data Table on global deep sea robot market 2018 - 2022 ($ million)
    • 4.2 Type Segment Analysis 2018 - 2022
      • Exhibit 19: Historic Market Size – Type Segment 2018 - 2022 ($ million)
    • 4.3 Application Segment Analysis 2018 - 2022
      • Exhibit 20: Historic Market Size – Application Segment 2018 - 2022 ($ million)
    • 4.4 Geography Segment Analysis 2018 - 2022
      • Exhibit 21: Historic Market Size – Geography Segment 2018 - 2022 ($ million)
    • 4.5 Country Segment Analysis 2018 - 2022
      • Exhibit 22: Historic Market Size – Country Segment 2018 - 2022 ($ million)

    5 Five Forces Analysis

    • 5.1 Five forces summary
      • Exhibit 23: Five forces analysis - Comparison between 2023 and 2028
    • 5.2 Bargaining power of buyers
      • Exhibit 24: Chart on Bargaining power of buyers – Impact of key factors 2023 and 2028
    • 5.3 Bargaining power of suppliers
      • Exhibit 25: Bargaining power of suppliers – Impact of key factors in 2023 and 2028
    • 5.4 Threat of new entrants
      • Exhibit 26: Threat of new entrants – Impact of key factors in 2023 and 2028
    • 5.5 Threat of substitutes
      • Exhibit 27: Threat of substitutes – Impact of key factors in 2023 and 2028
    • 5.6 Threat of rivalry
      • Exhibit 28: Threat of rivalry – Impact of key factors in 2023 and 2028
    • 5.7 Market condition
      • Exhibit 29: Chart on Market condition - Five forces 2023 and 2028

    6 Market Segmentation by Type

    • 6.1 Market segments
      • Exhibit 30: Chart on Type - Market share 2023-2028 (%)
      • Exhibit 31: Data Table on Type - Market share 2023-2028 (%)
    • 6.2 Comparison by Type
      • Exhibit 32: Chart on Comparison by Type
      • Exhibit 33: Data Table on Comparison by Type
    • 6.3 ROV - Market size and forecast 2023-2028
      • Exhibit 34: Chart on ROV - Market size and forecast 2023-2028 ($ million)
      • Exhibit 35: Data Table on ROV - Market size and forecast 2023-2028 ($ million)
      • Exhibit 36: Chart on ROV - Year-over-year growth 2023-2028 (%)
      • Exhibit 37: Data Table on ROV - Year-over-year growth 2023-2028 (%)
    • 6.4 AUV - Market size and forecast 2023-2028
      • Exhibit 38: Chart on AUV - Market size and forecast 2023-2028 ($ million)
      • Exhibit 39: Data Table on AUV - Market size and forecast 2023-2028 ($ million)
      • Exhibit 40: Chart on AUV - Year-over-year growth 2023-2028 (%)
      • Exhibit 41: Data Table on AUV - Year-over-year growth 2023-2028 (%)
    • 6.5 Submersible vehicles - Market size and forecast 2023-2028
      • Exhibit 42: Chart on Submersible vehicles - Market size and forecast 2023-2028 ($ million)
      • Exhibit 43: Data Table on Submersible vehicles - Market size and forecast 2023-2028 ($ million)
      • Exhibit 44: Chart on Submersible vehicles - Year-over-year growth 2023-2028 (%)
      • Exhibit 45: Data Table on Submersible vehicles - Year-over-year growth 2023-2028 (%)
    • 6.6 Market opportunity by Type
      • Exhibit 46: Market opportunity by Type ($ million)
      • Exhibit 47: Data Table on Market opportunity by Type ($ million)

    7 Market Segmentation by Application

    • 7.1 Market segments
      • Exhibit 48: Chart on Application - Market share 2023-2028 (%)
      • Exhibit 49: Data Table on Application - Market share 2023-2028 (%)
    • 7.2 Comparison by Application
      • Exhibit 50: Chart on Comparison by Application
      • Exhibit 51: Data Table on Comparison by Application
    • 7.3 Commercial exploration - Market size and forecast 2023-2028
      • Exhibit 52: Chart on Commercial exploration - Market size and forecast 2023-2028 ($ million)
      • Exhibit 53: Data Table on Commercial exploration - Market size and forecast 2023-2028 ($ million)
      • Exhibit 54: Chart on Commercial exploration - Year-over-year growth 2023-2028 (%)
      • Exhibit 55: Data Table on Commercial exploration - Year-over-year growth 2023-2028 (%)
    • 7.4 Defense and security - Market size and forecast 2023-2028
      • Exhibit 56: Chart on Defense and security - Market size and forecast 2023-2028 ($ million)
      • Exhibit 57: Data Table on Defense and security - Market size and forecast 2023-2028 ($ million)
      • Exhibit 58: Chart on Defense and security - Year-over-year growth 2023-2028 (%)
      • Exhibit 59: Data Table on Defense and security - Year-over-year growth 2023-2028 (%)
    • 7.5 Scientific research - Market size and forecast 2023-2028
      • Exhibit 60: Chart on Scientific research - Market size and forecast 2023-2028 ($ million)
      • Exhibit 61: Data Table on Scientific research - Market size and forecast 2023-2028 ($ million)
      • Exhibit 62: Chart on Scientific research - Year-over-year growth 2023-2028 (%)
      • Exhibit 63: Data Table on Scientific research - Year-over-year growth 2023-2028 (%)
    • 7.6 Market opportunity by Application
      • Exhibit 64: Market opportunity by Application ($ million)
      • Exhibit 65: Data Table on Market opportunity by Application ($ million)

    8 Customer Landscape

    • 8.1 Customer landscape overview
      • Exhibit 66: Analysis of price sensitivity, lifecycle, customer purchase basket, adoption rates, and purchase criteria

    9 Geographic Landscape

    • 9.1 Geographic segmentation
      • Exhibit 67: Chart on Market share by geography 2023-2028 (%)
      • Exhibit 68: Data Table on Market share by geography 2023-2028 (%)
    • 9.2 Geographic comparison
      • Exhibit 69: Chart on Geographic comparison
      • Exhibit 70: Data Table on Geographic comparison
    • 9.3 North America - Market size and forecast 2023-2028
      • Exhibit 71: Chart on North America - Market size and forecast 2023-2028 ($ million)
      • Exhibit 72: Data Table on North America - Market size and forecast 2023-2028 ($ million)
      • Exhibit 73: Chart on North America - Year-over-year growth 2023-2028 (%)
      • Exhibit 74: Data Table on North America - Year-over-year growth 2023-2028 (%)
    • 9.4 Europe - Market size and forecast 2023-2028
      • Exhibit 75: Chart on Europe - Market size and forecast 2023-2028 ($ million)
      • Exhibit 76: Data Table on Europe - Market size and forecast 2023-2028 ($ million)
      • Exhibit 77: Chart on Europe - Year-over-year growth 2023-2028 (%)
      • Exhibit 78: Data Table on Europe - Year-over-year growth 2023-2028 (%)
    • 9.5 APAC - Market size and forecast 2023-2028
      • Exhibit 79: Chart on APAC - Market size and forecast 2023-2028 ($ million)
      • Exhibit 80: Data Table on APAC - Market size and forecast 2023-2028 ($ million)
      • Exhibit 81: Chart on APAC - Year-over-year growth 2023-2028 (%)
      • Exhibit 82: Data Table on APAC - Year-over-year growth 2023-2028 (%)
    • 9.6 Middle East and Africa - Market size and forecast 2023-2028
      • Exhibit 83: Chart on Middle East and Africa - Market size and forecast 2023-2028 ($ million)
      • Exhibit 84: Data Table on Middle East and Africa - Market size and forecast 2023-2028 ($ million)
      • Exhibit 85: Chart on Middle East and Africa - Year-over-year growth 2023-2028 (%)
      • Exhibit 86: Data Table on Middle East and Africa - Year-over-year growth 2023-2028 (%)
    • 9.7 South America - Market size and forecast 2023-2028
      • Exhibit 87: Chart on South America - Market size and forecast 2023-2028 ($ million)
      • Exhibit 88: Data Table on South America - Market size and forecast 2023-2028 ($ million)
      • Exhibit 89: Chart on South America - Year-over-year growth 2023-2028 (%)
      • Exhibit 90: Data Table on South America - Year-over-year growth 2023-2028 (%)
    • 9.8 US - Market size and forecast 2023-2028
      • Exhibit 91: Chart on US - Market size and forecast 2023-2028 ($ million)
      • Exhibit 92: Data Table on US - Market size and forecast 2023-2028 ($ million)
      • Exhibit 93: Chart on US - Year-over-year growth 2023-2028 (%)
      • Exhibit 94: Data Table on US - Year-over-year growth 2023-2028 (%)
    • 9.9 China - Market size and forecast 2023-2028
      • Exhibit 95: Chart on China - Market size and forecast 2023-2028 ($ million)
      • Exhibit 96: Data Table on China - Market size and forecast 2023-2028 ($ million)
      • Exhibit 97: Chart on China - Year-over-year growth 2023-2028 (%)
      • Exhibit 98: Data Table on China - Year-over-year growth 2023-2028 (%)
    • 9.10 Germany - Market size and forecast 2023-2028
      • Exhibit 99: Chart on Germany - Market size and forecast 2023-2028 ($ million)
      • Exhibit 100: Data Table on Germany - Market size and forecast 2023-2028 ($ million)
      • Exhibit 101: Chart on Germany - Year-over-year growth 2023-2028 (%)
      • Exhibit 102: Data Table on Germany - Year-over-year growth 2023-2028 (%)
    • 9.11 Canada - Market size and forecast 2023-2028
      • Exhibit 103: Chart on Canada - Market size and forecast 2023-2028 ($ million)
      • Exhibit 104: Data Table on Canada - Market size and forecast 2023-2028 ($ million)
      • Exhibit 105: Chart on Canada - Year-over-year growth 2023-2028 (%)
      • Exhibit 106: Data Table on Canada - Year-over-year growth 2023-2028 (%)
    • 9.12 Norway - Market size and forecast 2023-2028
      • Exhibit 107: Chart on Norway - Market size and forecast 2023-2028 ($ million)
      • Exhibit 108: Data Table on Norway - Market size and forecast 2023-2028 ($ million)
      • Exhibit 109: Chart on Norway - Year-over-year growth 2023-2028 (%)
      • Exhibit 110: Data Table on Norway - Year-over-year growth 2023-2028 (%)
    • 9.13 Market opportunity by geography
      • Exhibit 111: Market opportunity by geography ($ million)
      • Exhibit 112: Data Tables on Market opportunity by geography ($ million)

    10 Drivers, Challenges, and Trends

    • 10.1 Market drivers
      • 10.2 Market challenges
        • 10.3 Impact of drivers and challenges
          • Exhibit 113: Impact of drivers and challenges in 2023 and 2028
        • 10.4 Market trends

          11 Vendor Landscape

          • 11.1 Overview
            • 11.2 Vendor landscape
              • Exhibit 114: Overview on Criticality of inputs and Factors of differentiation
            • 11.3 Landscape disruption
              • Exhibit 115: Overview on factors of disruption
            • 11.4 Industry risks
              • Exhibit 116: Impact of key risks on business

            12 Vendor Analysis

            • 12.1 Vendors covered
              • Exhibit 117: Vendors covered
            • 12.2 Market positioning of vendors
              • Exhibit 118: Matrix on vendor position and classification
            • 12.3 BAE Systems Plc
              • Exhibit 119: BAE Systems Plc - Overview
              • Exhibit 120: BAE Systems Plc - Business segments
              • Exhibit 121: BAE Systems Plc - Key offerings
              • Exhibit 122: BAE Systems Plc - Segment focus
            • 12.4 Blue Robotics Inc.
              • Exhibit 123: Blue Robotics Inc. - Overview
              • Exhibit 124: Blue Robotics Inc. - Product / Service
              • Exhibit 125: Blue Robotics Inc. - Key offerings
            • 12.5 Deep Ocean Engineering Inc.
              • Exhibit 126: Deep Ocean Engineering Inc. - Overview
              • Exhibit 127: Deep Ocean Engineering Inc. - Product / Service
              • Exhibit 128: Deep Ocean Engineering Inc. - Key offerings
            • 12.6 DOER Marine
              • Exhibit 129: DOER Marine - Overview
              • Exhibit 130: DOER Marine - Product / Service
              • Exhibit 131: DOER Marine - Key offerings
            • 12.7 Exail Technologies
              • Exhibit 132: Exail Technologies - Overview
              • Exhibit 133: Exail Technologies - Product / Service
              • Exhibit 134: Exail Technologies - Key offerings
            • 12.8 Forum Energy Technologies Inc.
              • Exhibit 135: Forum Energy Technologies Inc. - Overview
              • Exhibit 136: Forum Energy Technologies Inc. - Business segments
              • Exhibit 137: Forum Energy Technologies Inc. - Key offerings
              • Exhibit 138: Forum Energy Technologies Inc. - Segment focus
            • 12.9 Halma Plc
              • Exhibit 139: Halma Plc - Overview
              • Exhibit 140: Halma Plc - Business segments
              • Exhibit 141: Halma Plc - Key news
              • Exhibit 142: Halma Plc - Key offerings
              • Exhibit 143: Halma Plc - Segment focus
            • 12.10 International Submarine Engineering Ltd.
              • Exhibit 144: International Submarine Engineering Ltd. - Overview
              • Exhibit 145: International Submarine Engineering Ltd. - Product / Service
              • Exhibit 146: International Submarine Engineering Ltd. - Key offerings
            • 12.11 Kongsberg Gruppen ASA
              • Exhibit 147: Kongsberg Gruppen ASA - Overview
              • Exhibit 148: Kongsberg Gruppen ASA - Business segments
              • Exhibit 149: Kongsberg Gruppen ASA - Key offerings
              • Exhibit 150: Kongsberg Gruppen ASA - Segment focus
            • 12.12 L3Harris Technologies Inc.
              • Exhibit 151: L3Harris Technologies Inc. - Overview
              • Exhibit 152: L3Harris Technologies Inc. - Business segments
              • Exhibit 153: L3Harris Technologies Inc. - Key news
              • Exhibit 154: L3Harris Technologies Inc. - Key offerings
              • Exhibit 155: L3Harris Technologies Inc. - Segment focus
            • 12.13 Lockheed Martin Corp.
              • Exhibit 156: Lockheed Martin Corp. - Overview
              • Exhibit 157: Lockheed Martin Corp. - Business segments
              • Exhibit 158: Lockheed Martin Corp. - Key offerings
              • Exhibit 159: Lockheed Martin Corp. - Segment focus
            • 12.14 Oceaneering International Inc.
              • Exhibit 160: Oceaneering International Inc. - Overview
              • Exhibit 161: Oceaneering International Inc. - Product / Service
              • Exhibit 162: Oceaneering International Inc. - Key offerings
            • 12.15 ROVOP Ltd.
              • Exhibit 163: ROVOP Ltd. - Overview
              • Exhibit 164: ROVOP Ltd. - Product / Service
              • Exhibit 165: ROVOP Ltd. - Key offerings
            • 12.16 Saab AB
              • Exhibit 166: Saab AB - Overview
              • Exhibit 167: Saab AB - Business segments
              • Exhibit 168: Saab AB - Key news
              • Exhibit 169: Saab AB - Key offerings
              • Exhibit 170: Saab AB - Segment focus
            • 12.17 TechnipFMC plc
              • Exhibit 171: TechnipFMC plc - Overview
              • Exhibit 172: TechnipFMC plc - Business segments
              • Exhibit 173: TechnipFMC plc - Key news
              • Exhibit 174: TechnipFMC plc - Key offerings
              • Exhibit 175: TechnipFMC plc - Segment focus

            13 Appendix

            • 13.1 Scope of the report
              • 13.2 Inclusions and exclusions checklist
                • Exhibit 176: Inclusions checklist
                • Exhibit 177: Exclusions checklist
              • 13.3 Currency conversion rates for US$
                • Exhibit 178: Currency conversion rates for US$
              • 13.4 Research methodology
                • Exhibit 179: Research methodology
                • Exhibit 180: Validation techniques employed for market sizing
                • Exhibit 181: Information sources
              • 13.5 List of abbreviations
                • Exhibit 182: List of abbreviations

              Research Methodology

              Technavio presents a detailed picture of the market by way of study, synthesis, and summation of data from multiple sources. The analysts have presented the various facets of the market with a particular focus on identifying the key industry influencers. The data thus presented is comprehensive, reliable, and the result of extensive research, both primary and secondary.

              INFORMATION SOURCES

              Primary sources

              • Manufacturers and suppliers
              • Channel partners
              • Industry experts
              • Strategic decision makers

              Secondary sources

              • Industry journals and periodicals
              • Government data
              • Financial reports of key industry players
              • Historical data
              • Press releases

              DATA ANALYSIS

              Data Synthesis

              • Collation of data
              • Estimation of key figures
              • Analysis of derived insights

              Data Validation

              • Triangulation with data models
              • Reference against proprietary databases
              • Corroboration with industry experts

              REPORT WRITING

              Qualitative

              • Market drivers
              • Market challenges
              • Market trends
              • Five forces analysis

              Quantitative

              • Market size and forecast
              • Market segmentation
              • Geographical insights
              • Competitive landscape

              Interested in this report?

              Get your sample now to see our research methodology and insights!

              Download Now

              Frequently Asked Questions

              Deep Sea Robot market growth will increase by $ 2092.15 mn during 2024-2028.

              The Deep Sea Robot market is expected to grow at a CAGR of 12.05% during 2024-2028.

              Deep Sea Robot market is segmented by Type( ROV, AUV, Submersible vehicles) Application( Commercial exploration, Defense and security, Scientific research)

              BAE Systems Plc, Blue Robotics Inc., CRRC Corp. Ltd., Deep Ocean Engineering Inc., DOER Marine, Exail Technologies, Forum Energy Technologies Inc., Halma Plc, International Submarine Engineering Ltd., Kongsberg Gruppen ASA, L3Harris Technologies Inc., Lockheed Martin Corp., Mariscope, Nauticus Robotics Inc., Oceaneering International Inc., ROVOP Ltd., Saab AB, Shark Marine Technologies Inc., TechnipFMC plc, VideoRay LLC are a few of the key vendors in the Deep Sea Robot market.

              North America will register the highest growth rate of 35% among the other regions. Therefore, the Deep Sea Robot market in North America is expected to garner significant business opportunities for the vendors during the forecast period.

              US, Canada, China, Germany, Norway

              • Growing demand for oceanography researchOceanography is a field of study that has been growing in importance in recent years as scientists and researchers strive to better understand the vast and complex marine environment. There are many factors driving the increased demand for oceanography research is the driving factor this market.
              • including concerns about CC is the driving factor this market.
              • rising sea levels is the driving factor this market.
              • and the impact of human activities on the ocean. Oceanography research is focused on understanding the role of the ocean in global climate patterns. This includes exploring the ways in which ocean currents and temperatures affect weather patterns is the driving factor this market.
              • as well as investigating the role of the ocean in sequestering carbon dioxide from the atmosphere. For example is the driving factor this market.
              • researchers have been using advanced satellite technology to study the Gulf Stream is the driving factor this market.
              • a powerful ocean current that influences weather patterns across the Atlantic. Another area of growing demand for oceanography research is centered around understanding the impact of human activities on the ocean environment. This includes studying the effects of pollution is the driving factor this market.
              • overfishing is the driving factor this market.
              • and CC on marine ecosystems. One particularly pressing concern is the acidification of ocean waters due to increased carbon dioxide (CO2) emissions. Scientists are working to understand the impacts of this phenomenon on marine life and developing strategies to mitigate its effects. In addition to these areas of focus is the driving factor this market.
              • there are many other topics that are driving the demand for oceanography research. For example is the driving factor this market.
              • researchers are working to better understand the role of the ocean in biogeochemical cycles is the driving factor this market.
              • such as nutrient cycling and carbon storage. There is also increasing interest in the potential of the ocean as a source of renewable energy and its potential to support sustainable aquaculture practices. Moreover is the driving factor this market.
              • one of the recent and ongoing project examples is Project MEDUSA (Model of Ecosystem Dynamics is the driving factor this market.
              • nutrient Utilization is the driving factor this market.
              • Sequestration and Acidification). MEDUSA is developed by the UK National Capability program and is run in high-resolution configurations for forced-ocean hindcasts (observation-based recent past) and future projections and as a component model of the UK Earth System Model (UKESM). It is designed to include sufficient complexity to address major feedback between ocean biogeochemical cycles and anthropogenic drivers such as CC and ocean acidification (OA). This project was started in January 2007 and will be completed by March 2024. Projects ANTICS (advancing novel imaging technologies and data analyses to understand interior ocean carbon storage) is a project that focuses on photosynthesis to convert approximately 100 Gt of CO2 into organic matter every year in the deep ocean. The depth to which this organic matter sinks is important in controlling the magnitude of ocean carbon storage is the driving factor this market.
              • as changes in this flux attenuation depth drive variations in atmospheric pCO2 of up to 200 ppm. Efforts to produce global maps of flux attenuation have yielded starkly contrasting global patterns is the driving factor this market.
              • blocking the understandability of ocean carbon storage and the ability to predict it. The bottleneck is the ignorance of the spatiotemporal variability of the processes that control flux attenuation. The aim of the project is to address the knowledge gap by using an innovative synthesis of cutting-edge in situ imaging is the driving factor this market.
              • ML is the driving factor this market.
              • and novel data analyses to mechanistically understand ocean carbon storage. This project was started in October 2021 and will be completed by October 2026. Project Greensand aims to store up to 8 million tons of CO2 safely and permanently per annum in the INEOS Group Ltd (INEOS) is the driving factor this market.
              • operated in the Siri area of the North Sea. The storage potential is the driving factor this market.
              • if achieved is the driving factor this market.
              • will contribute significantly to Denmarks 2030 overall emissions reduction target. Thus is the driving factor this market.
              • the abovementioned factors are expected to propel the demand for deep sea robots is the driving factor this market.
              • which will drive the growth of the global deep sea robot market during the forecast period. is the driving factor this market.

              The Deep Sea Robot market vendors should focus on grabbing business opportunities from the ROV segment as it accounted for the largest market share in the base year.