Customer Information System Market Analysis, Size, and Forecast 2026-2030: North America (US, Canada, and Mexico), APAC (China, Japan, and India), Europe (Germany, UK, and France), South America (Brazil and Argentina), Middle East and Africa (South Africa, Saudi Arabia, and UAE), and Rest of World (ROW)

Customer Information System Market Analysis, Size, and Forecast 2026-2030:
North America (US, Canada, and Mexico), APAC (China, Japan, and India), Europe (Germany, UK, and France), South America (Brazil and Argentina), Middle East and Africa (South Africa, Saudi Arabia, and UAE), and Rest of World (ROW)

Published: Jan 2026 286 Pages SKU: IRTNTR72552

Market Overview at a Glance

$427.8 Mn
Market Opportunity
7.4%
CAGR 2025 - 2030
45.9%
North America Growth
$491.1 Mn
Cloud segment 2024

Customer Information System Market Size 2026-2030

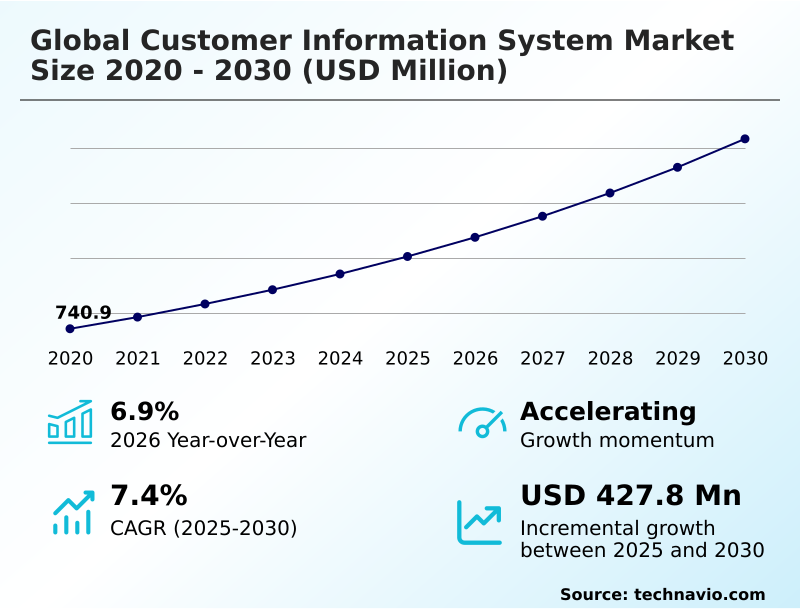
The customer information system market size is valued to increase by USD 427.8 million, at a CAGR of 7.4% from 2025 to 2030. Accelerated adoption of cloud-native architectures and SaaS models will drive the customer information system market.

Major Market Trends & Insights

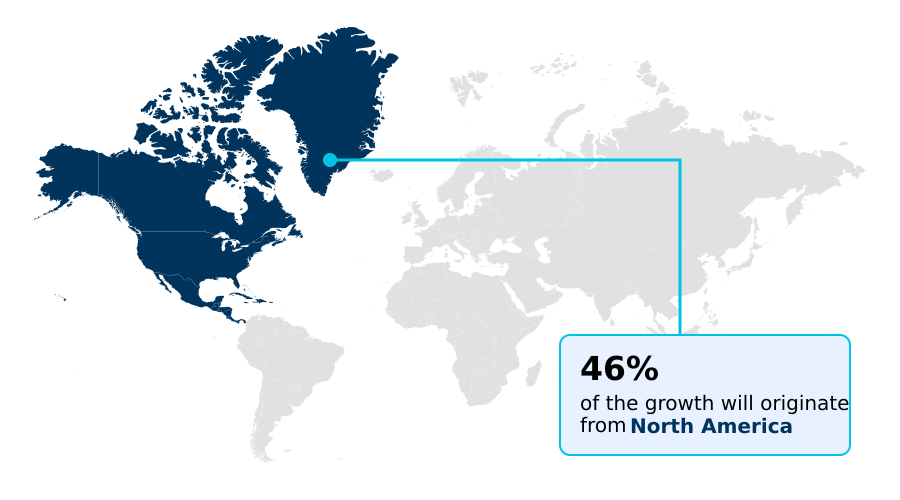
  • North America dominated the market and accounted for a 45.9% growth during the forecast period.
  • By Deployment - Cloud segment was valued at USD 491.1 million in 2024
  • By Component - Software segment accounted for the largest market revenue share in 2024

Market Size & Forecast

  • Market Opportunities: USD 690.6 million
  • Market Future Opportunities: USD 427.8 million
  • CAGR from 2025 to 2030 : 7.4%

Market Summary

  • The Customer Information System market is undergoing a significant transformation, driven by the shift from monolithic on-premises solutions to agile cloud-native platforms. This modernization is critical for utility providers seeking to enhance operational efficiency and manage the complexities of a transitioning energy grid.
  • The integration of agentic artificial intelligence and smart grid data analytics is a central theme, allowing for proactive outage communication and personalized services that improve customer satisfaction. A key driver is the accelerated adoption of a cloud-native CIS platform and SaaS deployment model, which provides scalability and reduces infrastructure costs.
  • For instance, a multi-service utility might use a modern CIS to manage meter-to-cash cycle automation for its electricity, gas, and water services simultaneously, while using an integrated outage management system (OMS) to provide real-time updates during service disruptions. However, the industry faces challenges related to the high cost of legacy system modernization and the constant threat of cybersecurity for utilities.
  • Navigating complex data privacy compliance regulations while ensuring data sovereignty management remains a critical hurdle for organizations aiming to deliver a seamless digital customer experience through a customer data platform (CDP) for utilities.

What will be the Size of the Customer Information System Market during the forecast period?

Get Key Insights on Market Forecast (PDF) Request Free Sample

How is the Customer Information System Market Segmented?

The customer information system industry research report provides comprehensive data (region-wise segment analysis), with forecasts and estimates in "USD million" for the period 2026-2030, as well as historical data from 2020-2024 for the following segments.

  • Deployment
    • Cloud
    • On-premises
  • Component
    • Software
    • Services
  • Application
    • Water and wastewater management
    • Electricity and power management
    • Utility gas management
  • Geography
    • North America
      • US
      • Canada
      • Mexico
    • APAC
      • China
      • Japan
      • India
    • Europe
      • Germany
      • UK
      • France
    • South America
      • Brazil
      • Argentina
    • Middle East and Africa
      • South Africa
      • Saudi Arabia
      • UAE
    • Rest of World (ROW)

By Deployment Insights

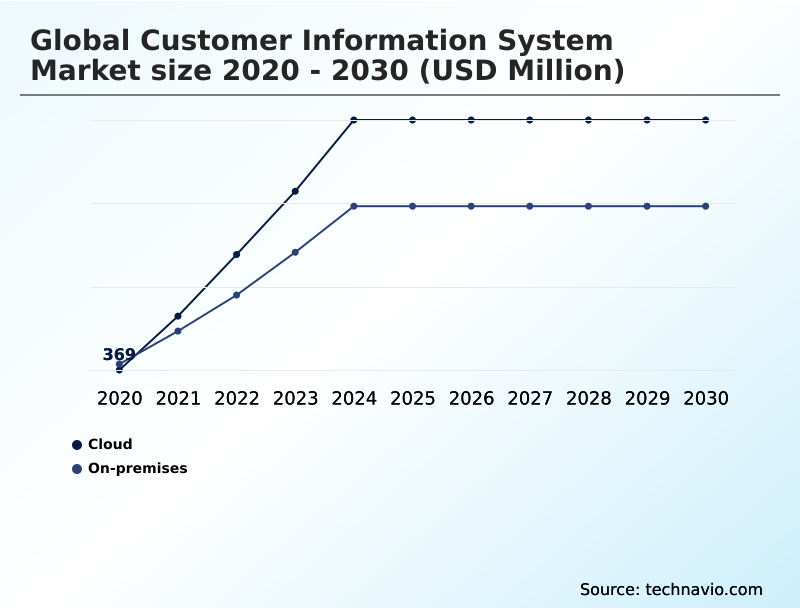
The cloud segment is estimated to witness significant growth during the forecast period.

The cloud segment is experiencing rapid expansion as organizations increasingly adopt a SaaS deployment model to enhance digital agility.

This transition to a cloud-native CIS platform allows utilities to move beyond rigid legacy architectures, enabling dynamic scalability and reducing capital expenditure on physical data centers.

By leveraging a secure cloud infrastructure, providers can seamlessly deploy advanced capabilities, such as AI-powered virtual agents and real-time metering data processing, to improve the digital customer experience.

This strategic shift supports better DER integration and facilitates a more agile meter-to-cash process optimization.

A focus on cloud migration strategy has enabled some utilities to improve data processing efficiency by over 30%, which is critical for handling complex billing scenarios and achieving customer satisfaction improvement through proactive outage communication and customer self-service portals.

Request Free Sample

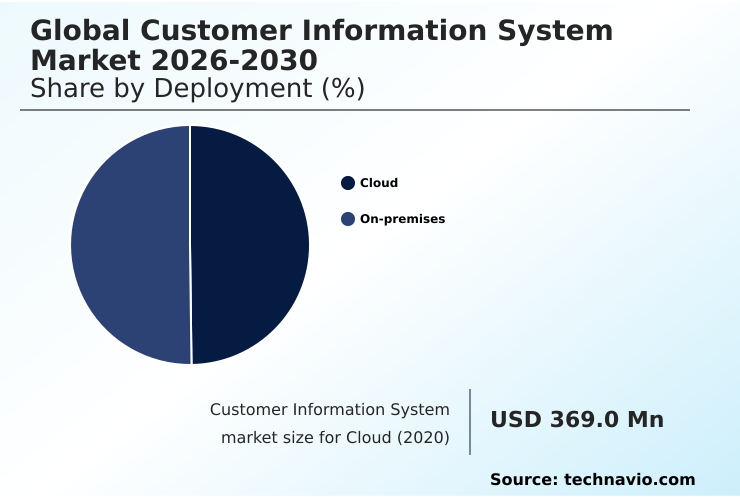
The Cloud segment was valued at USD 491.1 million in 2024 and showed a gradual increase during the forecast period.

Request Free Sample

Regional Analysis

North America is estimated to contribute 45.9% to the growth of the global market during the forecast period.Technavio’s analysts have elaborately explained the regional trends and drivers that shape the market during the forecast period.

See How Customer Information System Market Demand is Rising in North America Request Free Sample

The geographic landscape reflects varying maturity levels, with North America and Europe leading in adopting customer engagement platforms. These regions are focused on dynamic pricing models and EV charging billing. In North America, over 60% of utilities prioritize cloud investments.

In contrast, APAC is a high-growth region driven by the need for water and wastewater billing and utility gas management software.

CIS implementation services are in high demand, focusing on meter data management (MDM) and enterprise resource planning (ERP) integration for better asset performance management (APM).

In developing markets, the focus is establishing foundational real-time metering data infrastructure, where initial deployments show a potential 5% increase in revenue collection.

These regions often leverage mobile utility applications to leapfrog legacy models, supported by regulatory reporting automation and field service management integration. The implementation of automated payment plans is also gaining traction.

Market Dynamics

Our researchers analyzed the data with 2025 as the base year, along with the key drivers, trends, and challenges. A holistic analysis of drivers will help companies refine their marketing strategies to gain a competitive advantage.

  • The strategic imperative for utilities is evolving from basic billing to holistic operational management, highlighting the diverse applications of modern platforms. For example, a customer information system for water utilities now focuses on leak detection and conservation as much as invoicing. Similarly, a cloud-based cis for electric cooperatives provides scalability and advanced analytics that were previously unattainable.
  • The technical foundation involves integrating cis with meter data management, enabling real-time data processing in cis. In competitive environments, a flexible cis for deregulated energy markets is crucial for retaining customers. Organizations are recognizing the saas-based customer information system benefits, which include lower upfront costs and continuous innovation.
  • The process of upgrading legacy cis to cloud native is a major undertaking, but it is essential to the cis role in smart grid implementation. The application of ai in cis for predictive analytics transforms raw data into actionable insights, crucial for managing ders with a modern cis and using cis for demand response management.
  • A unified cis platform for multi-service utilities can handle electricity, gas, and water on a single system, streamlining operations. Enhancing cis for utility customer engagement is achieved through rich customer self-service features in cis. A key focus remains on ensuring data security in utility cis and maintaining cis compliance with data privacy laws.
  • The drive toward improving billing accuracy with new cis has led some providers to see error rates drop to less than half of what they were with older systems.
  • Finally, cis and crm integration for utilities and tools for mobile workforce management with cis create a connected enterprise, offering a seamless experience for both employees and customers of cis solutions for renewable energy providers.

What are the key market drivers leading to the rise in the adoption of Customer Information System Industry?

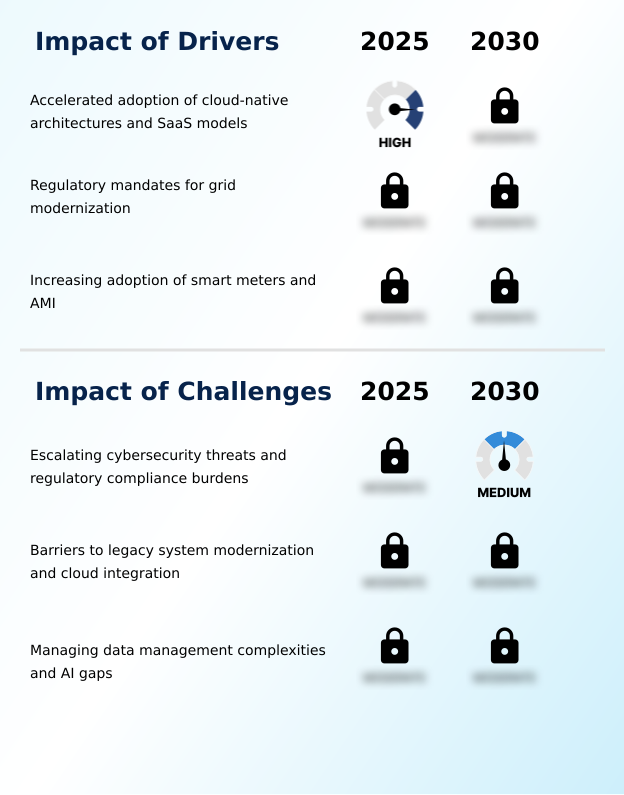
  • The accelerated adoption of cloud-native architectures and SaaS models is a key driver for the market, enabling greater flexibility and scalability for utility providers.

  • The accelerated adoption of advanced metering infrastructure (AMI) is a primary market driver, compelling an overhaul of legacy systems. Modernization centered on meter-to-cash cycle automation and API-first integration is critical.
  • Smart grid data analytics platforms, when integrated, have improved load forecasting accuracy by over 20%. Regulatory mandates for data transparency are pushing for more efficient regulatory compliance reporting, driving back-office process automation.
  • Investment in platforms supporting IT/OT convergence and omnichannel customer communication is driven by the need for utility asset management.
  • These systems have helped some utilities reduce customer churn by up to 5% annually by enabling personalized energy recommendations, improving revenue assurance for utilities and customer segmentation analysis.

What are the market trends shaping the Customer Information System Industry?

  • A key market trend is the strategic integration of agentic AI for autonomous customer engagement. This evolution transforms how utility providers interact with their customer base through proactive, hyper-personalized service.

  • A primary trend is the strategic shift toward agentic artificial intelligence for autonomous customer engagement, moving beyond traditional reactive service models. Modern platforms now offer customer journey orchestration to deliver hyper-personalized interactions, with some providers seeing a 40% reduction in call center volume.
  • The adoption of composable CIS architecture and event-driven architecture allows for greater flexibility, enabling seamless geospatial information system (GIS) integration and management of demand response programs. This unification of utility billing software with grid edge intelligence enhances operational efficiency metrics.
  • Utilities using these advanced systems report up to a 15% improvement in high-bill anomaly detection accuracy compared to legacy tools, significantly boosting customer lifecycle management and supporting a unified customer view.

What challenges does the Customer Information System Industry face during its growth?

  • Escalating cybersecurity threats and regulatory compliance burdens are key challenges affecting industry growth, requiring significant investment in data security and governance.

  • Key challenges include the complexities of legacy system modernization, with some migrations costing 25% more than budgeted. Cybersecurity for utilities is paramount, as a single breach can compromise millions of records, affecting service order management. Ensuring data sovereignty management introduces compliance burdens for utility data governance, impacting customer satisfaction scores which can drop by 10% during difficult transitions.
  • A skills gap hinders use of predictive billing analytics and energy consumption analytics for non-revenue water (NRW) reduction. Organizations struggle with billing dispute resolution without modern tools, impacting cost-to-serve reduction goals. Managing net metering for solar and time-of-use (TOU) rates is a challenge for older customer information control system (CICS) platforms, which also struggle with data privacy compliance.

Exclusive Technavio Analysis on Customer Landscape

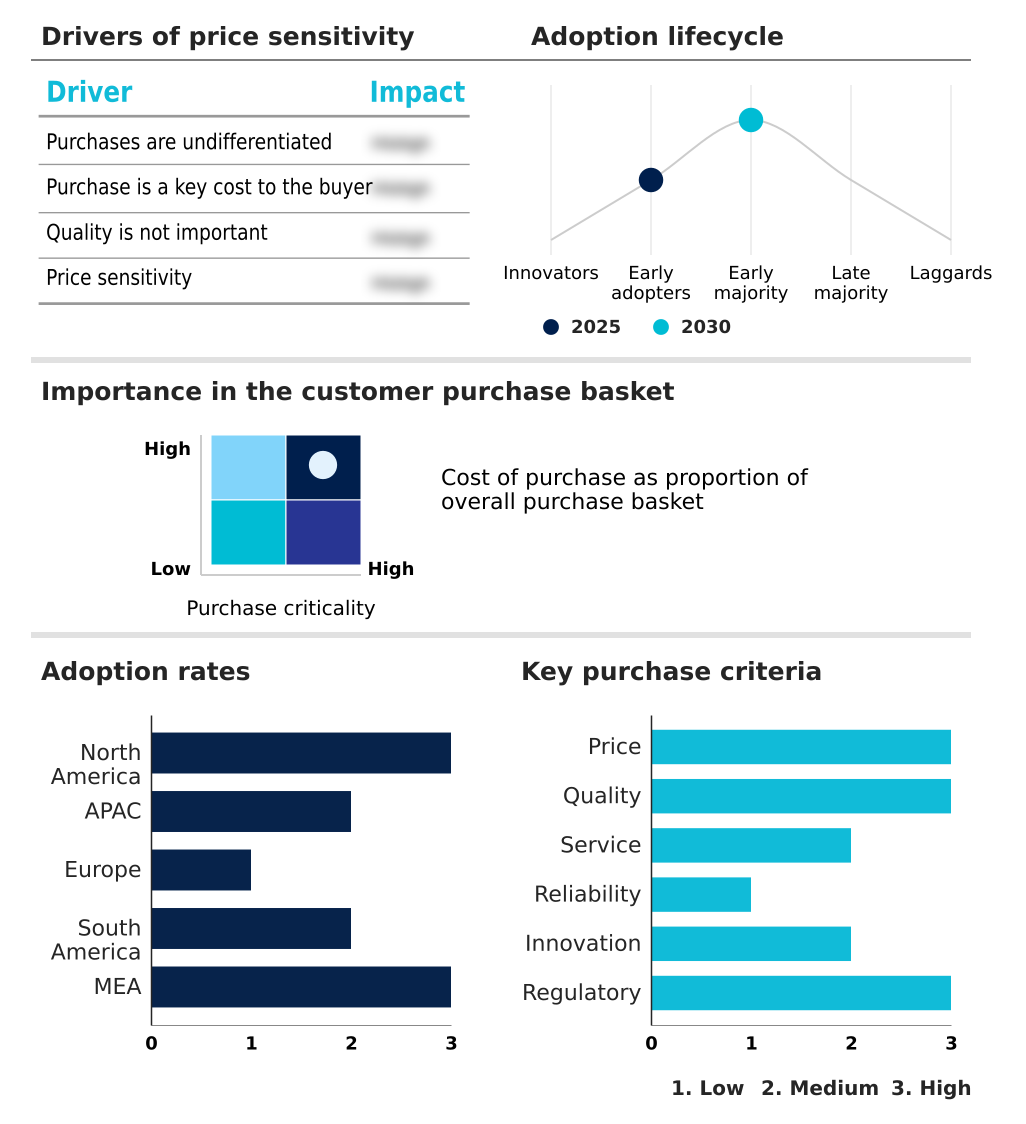
The customer information system market forecasting report includes the adoption lifecycle of the market, covering from the innovator’s stage to the laggard’s stage. It focuses on adoption rates in different regions based on penetration. Furthermore, the customer information system market report also includes key purchase criteria and drivers of price sensitivity to help companies evaluate and develop their market growth analysis strategies.

Customer Landscape of Customer Information System Industry

Competitive Landscape

Companies are implementing various strategies, such as strategic alliances, customer information system market forecast, partnerships, mergers and acquisitions, geographical expansion, and product/service launches, to enhance their presence in the industry.

Cogsdale Corp. - Delivering integrated customer information system platforms that unify billing, revenue management, and customer engagement for utility providers through cloud-native and on-premise solutions.

The industry research and growth report includes detailed analyses of the competitive landscape of the market and information about key companies, including:

  • Cogsdale Corp.
  • Constellation Software Inc.
  • CSG Systems International Inc.
  • Fluentgrid Ltd.
  • Gentrack Group Ltd.
  • Hansen Technologies Ltd.
  • HCL Technologies Ltd.
  • IBM Corp.
  • Indra Sistemas SA
  • Itineris NV
  • Kraken Technologies Ltd.
  • Microsoft Corp.
  • Milsoft Utility Solutions
  • Oracle Corp.
  • Salesforce Inc.
  • SAP SE
  • Wipro Ltd.

Qualitative and quantitative analysis of companies has been conducted to help clients understand the wider business environment as well as the strengths and weaknesses of key industry players. Data is qualitatively analyzed to categorize companies as pure play, category-focused, industry-focused, and diversified; it is quantitatively analyzed to categorize companies as dominant, leading, strong, tentative, and weak.

Recent Development and News in Customer information system market

  • In October 2024, American Water detected unauthorized activity on its systems, forcing a temporary shutdown of its customer portal and billing operations to contain the cybersecurity threat.
  • In February 2025, Hansen Technologies launched HansenCIS, a new platform featuring AI-powered virtual agents and cloud-native architecture to assist energy and communications providers with modernizing their systems.
  • In May 2025, Kraken Technologies partnered with National Grid to implement its operating system for over six million energy customers in Massachusetts and New York, replacing legacy infrastructure.
  • In October 2025, Salesforce introduced Agentforce 360 for Energy and Utilities, a solution using autonomous AI agents to manage over 70% of customer inquiries without human intervention.

Dive into Technavio’s robust research methodology, blending expert interviews, extensive data synthesis, and validated models for unparalleled Customer Information System Market insights. See full methodology.

Market Scope
Page number 286
Base year 2025
Historic period 2020-2024
Forecast period 2026-2030
Growth momentum & CAGR Accelerate at a CAGR of 7.4%
Market growth 2026-2030 USD 427.8 million
Market structure Fragmented
YoY growth 2025-2026(%) 6.9%
Key countries US, Canada, Mexico, China, Japan, India, Australia, South Korea, Indonesia, Germany, UK, France, Italy, Spain, The Netherlands, Brazil, Argentina, Chile, South Africa, Saudi Arabia, UAE, Egypt and Nigeria
Competitive landscape Leading Companies, Market Positioning of Companies, Competitive Strategies, and Industry Risks

Request Free Sample

Research Analyst Overview

  • The market is pivoting from legacy system modernization toward the adoption of a cloud-native CIS platform using a SaaS deployment model. This shift is fundamental for utilities aiming for end-to-end meter-to-cash cycle automation. The core of this evolution lies in agentic artificial intelligence enabling autonomous customer engagement through a composable CIS architecture and event-driven architecture.
  • Such systems leverage grid edge intelligence and advanced metering infrastructure (AMI) for superior meter data management (MDM). Modern utility billing software is essential for DER integration, non-revenue water (NRW) reduction, and handling real-time metering data. Effective service order management is now facilitated through a customer self-service portal, which also supports proactive outage communication.
  • Leading platforms offer dynamic pricing models powered by smart grid data analytics, improving regulatory compliance reporting and data sovereignty management. With robust cybersecurity for utilities, API-first integration ensures seamless customer journey orchestration. The use of predictive billing analytics and energy consumption analytics has shown to reduce billing dispute resolution cases by over 15%.
  • This is augmented by AI-powered virtual agents within a customer engagement platform or customer data platform (CDP) for utilities, which also handles omnichannel customer communication, EV charging billing, water and wastewater billing, and utility gas management software through enterprise resource planning (ERP) integration and utility asset management.

What are the Key Data Covered in this Customer Information System Market Research and Growth Report?

  • What is the expected growth of the Customer Information System Market between 2026 and 2030?

    • USD 427.8 million, at a CAGR of 7.4%

  • What segmentation does the market report cover?

    • The report is segmented by Deployment (Cloud, and On-premises), Component (Software, and Services), Application (Water and wastewater management, Electricity and power management, and Utility gas management) and Geography (North America, APAC, Europe, South America, Middle East and Africa)

  • Which regions are analyzed in the report?

    • North America, APAC, Europe, South America and Middle East and Africa

  • What are the key growth drivers and market challenges?

    • Accelerated adoption of cloud-native architectures and SaaS models, Escalating cybersecurity threats and regulatory compliance burdens

  • Who are the major players in the Customer Information System Market?

    • Cogsdale Corp., Constellation Software Inc., CSG Systems International Inc., Fluentgrid Ltd., Gentrack Group Ltd., Hansen Technologies Ltd., HCL Technologies Ltd., IBM Corp., Indra Sistemas SA, Itineris NV, Kraken Technologies Ltd., Microsoft Corp., Milsoft Utility Solutions, Oracle Corp., Salesforce Inc., SAP SE and Wipro Ltd.

Market Research Insights

  • The market is characterized by a rapid shift toward platforms that provide a unified customer view and enhance the digital customer experience. Organizations are leveraging churn prediction models, which have proven to reduce customer attrition by up to 5% in competitive markets.
  • The adoption of back-office process automation is another key dynamic, with some utilities reporting a 20% improvement in operational efficiency metrics. As providers implement demand response programs, the ability to manage complex billing scenarios and time-of-use (TOU) rates becomes critical. This requires sophisticated systems with robust utility data governance frameworks.
  • CIS implementation services are increasingly focused on cloud migration strategy, as platforms hosted on a secure cloud infrastructure demonstrate 15% better uptime compared to on-premises alternatives.

We can help! Our analysts can customize this customer information system market research report to meet your requirements.

Get in touch

1. Executive Summary

1.1 Market overview

Executive Summary - Chart on Market Overview
Executive Summary - Data Table on Market Overview
Executive Summary - Chart on Global Market Characteristics
Executive Summary - Chart on Market by Geography
Executive Summary - Chart on Market Segmentation by Deployment
Executive Summary - Chart on Market Segmentation by Component
Executive Summary - Chart on Market Segmentation by Application
Executive Summary - Chart on Incremental Growth
Executive Summary - Data Table on Incremental Growth
Executive Summary - Chart on Company Market Positioning

2. Technavio Analysis

2.1 Analysis of price sensitivity, lifecycle, customer purchase basket, adoption rates, and purchase criteria

2.2 Criticality of inputs and Factors of differentiation

Chart on Overview on criticality of inputs and factors of differentiation

2.3 Factors of disruption

Chart on Overview on factors of disruption

2.4 Impact of drivers and challenges

Chart on Impact of drivers and challenges in 2025 and 2030

3. Market Landscape

3.1 Market ecosystem

Chart on Parent Market
Data Table on - Parent Market

3.2 Market characteristics

Chart on Market characteristics analysis

3.3 Value chain analysis

Chart on Value chain analysis

4. Market Sizing

4.1 Market definition

Data Table on Offerings of companies included in the market definition

4.2 Market segment analysis

Market segments

4.3 Market size 2025

4.4 Market outlook: Forecast for 2025-2030

Chart on Global - Market size and forecast 2025-2030 ($ million)
Data Table on Global - Market size and forecast 2025-2030 ($ million)
Chart on Global Market: Year-over-year growth 2025-2030 (%)
Data Table on Global Market: Year-over-year growth 2025-2030 (%)

5. Historic Market Size

5.1 Global Customer Information System Market 2020 - 2024

Historic Market Size - Data Table on Global Customer Information System Market 2020 - 2024 ($ million)

5.2 Deployment segment analysis 2020 - 2024

Historic Market Size - Deployment Segment 2020 - 2024 ($ million)

5.3 Component segment analysis 2020 - 2024

Historic Market Size - Component Segment 2020 - 2024 ($ million)

5.4 Application segment analysis 2020 - 2024

Historic Market Size - Application Segment 2020 - 2024 ($ million)

5.5 Geography segment analysis 2020 - 2024

Historic Market Size - Geography Segment 2020 - 2024 ($ million)

5.6 Country segment analysis 2020 - 2024

Historic Market Size - Country Segment 2020 - 2024 ($ million)

6. Qualitative Analysis

6.1 The AI impact on Global Customer Information System Market

7. Five Forces Analysis

7.1 Five forces summary

Five forces analysis - Comparison between 2025 and 2030

7.2 Bargaining power of buyers

Bargaining power of buyers - Impact of key factors 2025 and 2030

7.3 Bargaining power of suppliers

Bargaining power of suppliers - Impact of key factors in 2025 and 2030

7.4 Threat of new entrants

Threat of new entrants - Impact of key factors in 2025 and 2030

7.5 Threat of substitutes

Threat of substitutes - Impact of key factors in 2025 and 2030

7.6 Threat of rivalry

Threat of rivalry - Impact of key factors in 2025 and 2030

7.7 Market condition

Chart on Market condition - Five forces 2025 and 2030

8. Market Segmentation by Deployment

8.1 Market segments

Chart on Deployment - Market share 2025-2030 (%)
Data Table on Deployment - Market share 2025-2030 (%)

8.2 Comparison by Deployment

Chart on Comparison by Deployment
Data Table on Comparison by Deployment

8.3 Cloud - Market size and forecast 2025-2030

Chart on Cloud - Market size and forecast 2025-2030 ($ million)
Data Table on Cloud - Market size and forecast 2025-2030 ($ million)
Chart on Cloud - Year-over-year growth 2025-2030 (%)
Data Table on Cloud - Year-over-year growth 2025-2030 (%)

8.4 On-premises - Market size and forecast 2025-2030

Chart on On-premises - Market size and forecast 2025-2030 ($ million)
Data Table on On-premises - Market size and forecast 2025-2030 ($ million)
Chart on On-premises - Year-over-year growth 2025-2030 (%)
Data Table on On-premises - Year-over-year growth 2025-2030 (%)

8.5 Market opportunity by Deployment

Market opportunity by Deployment ($ million)
Data Table on Market opportunity by Deployment ($ million)

9. Market Segmentation by Component

9.1 Market segments

Chart on Component - Market share 2025-2030 (%)
Data Table on Component - Market share 2025-2030 (%)

9.2 Comparison by Component

Chart on Comparison by Component
Data Table on Comparison by Component

9.3 Software - Market size and forecast 2025-2030

Chart on Software - Market size and forecast 2025-2030 ($ million)
Data Table on Software - Market size and forecast 2025-2030 ($ million)
Chart on Software - Year-over-year growth 2025-2030 (%)
Data Table on Software - Year-over-year growth 2025-2030 (%)

9.4 Services - Market size and forecast 2025-2030

Chart on Services - Market size and forecast 2025-2030 ($ million)
Data Table on Services - Market size and forecast 2025-2030 ($ million)
Chart on Services - Year-over-year growth 2025-2030 (%)
Data Table on Services - Year-over-year growth 2025-2030 (%)

9.5 Market opportunity by Component

Market opportunity by Component ($ million)
Data Table on Market opportunity by Component ($ million)

10. Market Segmentation by Application

10.1 Market segments

Chart on Application - Market share 2025-2030 (%)
Data Table on Application - Market share 2025-2030 (%)

10.2 Comparison by Application

Chart on Comparison by Application
Data Table on Comparison by Application

10.3 Water and wastewater management - Market size and forecast 2025-2030

Chart on Water and wastewater management - Market size and forecast 2025-2030 ($ million)
Data Table on Water and wastewater management - Market size and forecast 2025-2030 ($ million)
Chart on Water and wastewater management - Year-over-year growth 2025-2030 (%)
Data Table on Water and wastewater management - Year-over-year growth 2025-2030 (%)

10.4 Electricity and power management - Market size and forecast 2025-2030

Chart on Electricity and power management - Market size and forecast 2025-2030 ($ million)
Data Table on Electricity and power management - Market size and forecast 2025-2030 ($ million)
Chart on Electricity and power management - Year-over-year growth 2025-2030 (%)
Data Table on Electricity and power management - Year-over-year growth 2025-2030 (%)

10.5 Utility gas management - Market size and forecast 2025-2030

Chart on Utility gas management - Market size and forecast 2025-2030 ($ million)
Data Table on Utility gas management - Market size and forecast 2025-2030 ($ million)
Chart on Utility gas management - Year-over-year growth 2025-2030 (%)
Data Table on Utility gas management - Year-over-year growth 2025-2030 (%)

10.6 Market opportunity by Application

Market opportunity by Application ($ million)
Data Table on Market opportunity by Application ($ million)

11. Customer Landscape

11.1 Customer landscape overview

Analysis of price sensitivity, lifecycle, customer purchase basket, adoption rates, and purchase criteria

12. Geographic Landscape

12.1 Geographic segmentation

Chart on Market share by geography 2025-2030 (%)
Data Table on Market share by geography 2025-2030 (%)

12.2 Geographic comparison

Chart on Geographic comparison
Data Table on Geographic comparison

12.3 North America - Market size and forecast 2025-2030

Chart on North America - Market size and forecast 2025-2030 ($ million)
Data Table on North America - Market size and forecast 2025-2030 ($ million)
Chart on North America - Year-over-year growth 2025-2030 (%)
Data Table on North America - Year-over-year growth 2025-2030 (%)
Chart on Regional Comparison - North America
Data Table on Regional Comparison - North America

12.3.1 US - Market size and forecast 2025-2030

Chart on US - Market size and forecast 2025-2030 ($ million)
Data Table on US - Market size and forecast 2025-2030 ($ million)
Chart on US - Year-over-year growth 2025-2030 (%)
Data Table on US - Year-over-year growth 2025-2030 (%)

12.3.2 Canada - Market size and forecast 2025-2030

Chart on Canada - Market size and forecast 2025-2030 ($ million)
Data Table on Canada - Market size and forecast 2025-2030 ($ million)
Chart on Canada - Year-over-year growth 2025-2030 (%)
Data Table on Canada - Year-over-year growth 2025-2030 (%)

12.3.3 Mexico - Market size and forecast 2025-2030

Chart on Mexico - Market size and forecast 2025-2030 ($ million)
Data Table on Mexico - Market size and forecast 2025-2030 ($ million)
Chart on Mexico - Year-over-year growth 2025-2030 (%)
Data Table on Mexico - Year-over-year growth 2025-2030 (%)

12.4 APAC - Market size and forecast 2025-2030

Chart on APAC - Market size and forecast 2025-2030 ($ million)
Data Table on APAC - Market size and forecast 2025-2030 ($ million)
Chart on APAC - Year-over-year growth 2025-2030 (%)
Data Table on APAC - Year-over-year growth 2025-2030 (%)
Chart on Regional Comparison - APAC
Data Table on Regional Comparison - APAC

12.4.1 China - Market size and forecast 2025-2030

Chart on China - Market size and forecast 2025-2030 ($ million)
Data Table on China - Market size and forecast 2025-2030 ($ million)
Chart on China - Year-over-year growth 2025-2030 (%)
Data Table on China - Year-over-year growth 2025-2030 (%)

12.4.2 Japan - Market size and forecast 2025-2030

Chart on Japan - Market size and forecast 2025-2030 ($ million)
Data Table on Japan - Market size and forecast 2025-2030 ($ million)
Chart on Japan - Year-over-year growth 2025-2030 (%)
Data Table on Japan - Year-over-year growth 2025-2030 (%)

12.4.3 India - Market size and forecast 2025-2030

Chart on India - Market size and forecast 2025-2030 ($ million)
Data Table on India - Market size and forecast 2025-2030 ($ million)
Chart on India - Year-over-year growth 2025-2030 (%)
Data Table on India - Year-over-year growth 2025-2030 (%)

12.4.4 Australia - Market size and forecast 2025-2030

Chart on Australia - Market size and forecast 2025-2030 ($ million)
Data Table on Australia - Market size and forecast 2025-2030 ($ million)
Chart on Australia - Year-over-year growth 2025-2030 (%)
Data Table on Australia - Year-over-year growth 2025-2030 (%)

12.4.5 South Korea - Market size and forecast 2025-2030

Chart on South Korea - Market size and forecast 2025-2030 ($ million)
Data Table on South Korea - Market size and forecast 2025-2030 ($ million)
Chart on South Korea - Year-over-year growth 2025-2030 (%)
Data Table on South Korea - Year-over-year growth 2025-2030 (%)

12.4.6 Indonesia - Market size and forecast 2025-2030

Chart on Indonesia - Market size and forecast 2025-2030 ($ million)
Data Table on Indonesia - Market size and forecast 2025-2030 ($ million)
Chart on Indonesia - Year-over-year growth 2025-2030 (%)
Data Table on Indonesia - Year-over-year growth 2025-2030 (%)

12.5 Europe - Market size and forecast 2025-2030

Chart on Europe - Market size and forecast 2025-2030 ($ million)
Data Table on Europe - Market size and forecast 2025-2030 ($ million)
Chart on Europe - Year-over-year growth 2025-2030 (%)
Data Table on Europe - Year-over-year growth 2025-2030 (%)
Chart on Regional Comparison - Europe
Data Table on Regional Comparison - Europe

12.5.1 Germany - Market size and forecast 2025-2030

Chart on Germany - Market size and forecast 2025-2030 ($ million)
Data Table on Germany - Market size and forecast 2025-2030 ($ million)
Chart on Germany - Year-over-year growth 2025-2030 (%)
Data Table on Germany - Year-over-year growth 2025-2030 (%)

12.5.2 UK - Market size and forecast 2025-2030

Chart on UK - Market size and forecast 2025-2030 ($ million)
Data Table on UK - Market size and forecast 2025-2030 ($ million)
Chart on UK - Year-over-year growth 2025-2030 (%)
Data Table on UK - Year-over-year growth 2025-2030 (%)

12.5.3 France - Market size and forecast 2025-2030

Chart on France - Market size and forecast 2025-2030 ($ million)
Data Table on France - Market size and forecast 2025-2030 ($ million)
Chart on France - Year-over-year growth 2025-2030 (%)
Data Table on France - Year-over-year growth 2025-2030 (%)

12.5.4 Italy - Market size and forecast 2025-2030

Chart on Italy - Market size and forecast 2025-2030 ($ million)
Data Table on Italy - Market size and forecast 2025-2030 ($ million)
Chart on Italy - Year-over-year growth 2025-2030 (%)
Data Table on Italy - Year-over-year growth 2025-2030 (%)

12.5.5 Spain - Market size and forecast 2025-2030

Chart on Spain - Market size and forecast 2025-2030 ($ million)
Data Table on Spain - Market size and forecast 2025-2030 ($ million)
Chart on Spain - Year-over-year growth 2025-2030 (%)
Data Table on Spain - Year-over-year growth 2025-2030 (%)

12.5.6 The Netherlands - Market size and forecast 2025-2030

Chart on The Netherlands - Market size and forecast 2025-2030 ($ million)
Data Table on The Netherlands - Market size and forecast 2025-2030 ($ million)
Chart on The Netherlands - Year-over-year growth 2025-2030 (%)
Data Table on The Netherlands - Year-over-year growth 2025-2030 (%)

12.6 South America - Market size and forecast 2025-2030

Chart on South America - Market size and forecast 2025-2030 ($ million)
Data Table on South America - Market size and forecast 2025-2030 ($ million)
Chart on South America - Year-over-year growth 2025-2030 (%)
Data Table on South America - Year-over-year growth 2025-2030 (%)
Chart on Regional Comparison - South America
Data Table on Regional Comparison - South America

12.6.1 Brazil - Market size and forecast 2025-2030

Chart on Brazil - Market size and forecast 2025-2030 ($ million)
Data Table on Brazil - Market size and forecast 2025-2030 ($ million)
Chart on Brazil - Year-over-year growth 2025-2030 (%)
Data Table on Brazil - Year-over-year growth 2025-2030 (%)

12.6.2 Argentina - Market size and forecast 2025-2030

Chart on Argentina - Market size and forecast 2025-2030 ($ million)
Data Table on Argentina - Market size and forecast 2025-2030 ($ million)
Chart on Argentina - Year-over-year growth 2025-2030 (%)
Data Table on Argentina - Year-over-year growth 2025-2030 (%)

12.6.3 Chile - Market size and forecast 2025-2030

Chart on Chile - Market size and forecast 2025-2030 ($ million)
Data Table on Chile - Market size and forecast 2025-2030 ($ million)
Chart on Chile - Year-over-year growth 2025-2030 (%)
Data Table on Chile - Year-over-year growth 2025-2030 (%)

12.7 Middle East and Africa - Market size and forecast 2025-2030

Chart on Middle East and Africa - Market size and forecast 2025-2030 ($ million)
Data Table on Middle East and Africa - Market size and forecast 2025-2030 ($ million)
Chart on Middle East and Africa - Year-over-year growth 2025-2030 (%)
Data Table on Middle East and Africa - Year-over-year growth 2025-2030 (%)
Chart on Regional Comparison - Middle East and Africa
Data Table on Regional Comparison - Middle East and Africa

12.7.1 South Africa - Market size and forecast 2025-2030

Chart on South Africa - Market size and forecast 2025-2030 ($ million)
Data Table on South Africa - Market size and forecast 2025-2030 ($ million)
Chart on South Africa - Year-over-year growth 2025-2030 (%)
Data Table on South Africa - Year-over-year growth 2025-2030 (%)

12.7.2 Saudi Arabia - Market size and forecast 2025-2030

Chart on Saudi Arabia - Market size and forecast 2025-2030 ($ million)
Data Table on Saudi Arabia - Market size and forecast 2025-2030 ($ million)
Chart on Saudi Arabia - Year-over-year growth 2025-2030 (%)
Data Table on Saudi Arabia - Year-over-year growth 2025-2030 (%)

12.7.3 UAE - Market size and forecast 2025-2030

Chart on UAE - Market size and forecast 2025-2030 ($ million)
Data Table on UAE - Market size and forecast 2025-2030 ($ million)
Chart on UAE - Year-over-year growth 2025-2030 (%)
Data Table on UAE - Year-over-year growth 2025-2030 (%)

12.7.4 Egypt - Market size and forecast 2025-2030

Chart on Egypt - Market size and forecast 2025-2030 ($ million)
Data Table on Egypt - Market size and forecast 2025-2030 ($ million)
Chart on Egypt - Year-over-year growth 2025-2030 (%)
Data Table on Egypt - Year-over-year growth 2025-2030 (%)

12.7.5 Nigeria - Market size and forecast 2025-2030

Chart on Nigeria - Market size and forecast 2025-2030 ($ million)
Data Table on Nigeria - Market size and forecast 2025-2030 ($ million)
Chart on Nigeria - Year-over-year growth 2025-2030 (%)
Data Table on Nigeria - Year-over-year growth 2025-2030 (%)

12.8 Market opportunity by geography

Market opportunity by geography ($ million)
Data Tables on Market opportunity by geography ($ million)

13. Drivers, Challenges, and Opportunity

13.1 Market drivers

Accelerated adoption of cloud-native architectures and SaaS models
Regulatory mandates for grid modernization
Increasing adoption of smart meters and AMI

13.2 Market challenges

Escalating cybersecurity threats and regulatory compliance burdens
Barriers to legacy system modernization and cloud integration
Managing data management complexities and AI gaps

13.3 Impact of drivers and challenges

Impact of drivers and challenges in 2025 and 2030

13.4 Market opportunities

Strategic integration of agentic AI for autonomous customer engagement
Acceleration of cloud-native modernization and composable architectures
Unification of CIS with grid edge intelligence and data orchestration

14. Competitive Landscape

14.1 Overview

14.2

Overview on criticality of inputs and factors of differentiation

14.3 Landscape disruption

Overview on factors of disruption

14.4 Industry risks

Impact of key risks on business

15. Competitive Analysis

15.1 Companies profiled

Companies covered

15.2 Company ranking index

15.3 Market positioning of companies

Matrix on companies position and classification

15.4 Constellation Software Inc.

Constellation Software Inc. - Overview
Constellation Software Inc. - Product / Service
Constellation Software Inc. - Key offerings
SWOT

15.5 CSG Systems International Inc.

CSG Systems International Inc. - Overview
CSG Systems International Inc. - Product / Service
CSG Systems International Inc. - Key offerings
SWOT

15.6 Fluentgrid Ltd.

Fluentgrid Ltd. - Overview
Fluentgrid Ltd. - Product / Service
Fluentgrid Ltd. - Key offerings
SWOT

15.7 Gentrack Group Ltd.

Gentrack Group Ltd. - Overview
Gentrack Group Ltd. - Business segments
Gentrack Group Ltd. - Key offerings
Gentrack Group Ltd. - Segment focus
SWOT

15.8 Hansen Technologies Ltd.

Hansen Technologies Ltd. - Overview
Hansen Technologies Ltd. - Product / Service
Hansen Technologies Ltd. - Key news
Hansen Technologies Ltd. - Key offerings
SWOT

15.9 HCL Technologies Ltd.

HCL Technologies Ltd. - Overview
HCL Technologies Ltd. - Business segments
HCL Technologies Ltd. - Key news
HCL Technologies Ltd. - Key offerings
HCL Technologies Ltd. - Segment focus
SWOT

15.10 IBM Corp.

IBM Corp. - Overview
IBM Corp. - Business segments
IBM Corp. - Key news
IBM Corp. - Key offerings
IBM Corp. - Segment focus
SWOT

15.11 Indra Sistemas SA

Indra Sistemas SA - Overview
Indra Sistemas SA - Business segments
Indra Sistemas SA - Key news
Indra Sistemas SA - Key offerings
Indra Sistemas SA - Segment focus
SWOT

15.12 Itineris NV

Itineris NV - Overview
Itineris NV - Product / Service
Itineris NV - Key offerings
SWOT

15.13 Kraken Technologies Ltd.

Kraken Technologies Ltd. - Overview
Kraken Technologies Ltd. - Product / Service
Kraken Technologies Ltd. - Key offerings
SWOT

15.14 Microsoft Corp.

Microsoft Corp. - Overview
Microsoft Corp. - Business segments
Microsoft Corp. - Key news
Microsoft Corp. - Key offerings
Microsoft Corp. - Segment focus
SWOT

15.15 Oracle Corp.

Oracle Corp. - Overview
Oracle Corp. - Business segments
Oracle Corp. - Key news
Oracle Corp. - Key offerings
Oracle Corp. - Segment focus
SWOT

15.16 Salesforce Inc.

Salesforce Inc. - Overview
Salesforce Inc. - Product / Service
Salesforce Inc. - Key news
Salesforce Inc. - Key offerings
SWOT

15.17 SAP SE

SAP SE - Overview
SAP SE - Business segments
SAP SE - Key news
SAP SE - Key offerings
SAP SE - Segment focus
SWOT

15.18 Wipro Ltd.

Wipro Ltd. - Overview
Wipro Ltd. - Business segments
Wipro Ltd. - Key news
Wipro Ltd. - Key offerings
Wipro Ltd. - Segment focus
SWOT

16. Appendix

16.1 Scope of the report

Market definition
Objectives
Notes and caveats

16.2 Inclusions and exclusions checklist

Inclusions checklist
Exclusions checklist

16.3 Currency conversion rates for US$

16.4 Research methodology

16.5 Data procurement

Information sources

16.6 Data validation

16.7 Validation techniques employed for market sizing

16.8 Data synthesis

16.9 360 degree market analysis

16.10 List of abbreviations

Research Methodology

Technavio presents a detailed picture of the market by way of study, synthesis, and summation of data from multiple sources. The analysts have presented the various facets of the market with a particular focus on identifying the key industry influencers. The data thus presented is comprehensive, reliable, and the result of extensive research, both primary and secondary.

INFORMATION SOURCES

Primary sources

  • Manufacturers and suppliers
  • Channel partners
  • Industry experts
  • Strategic decision makers

Secondary sources

  • Industry journals and periodicals
  • Government data
  • Financial reports of key industry players
  • Historical data
  • Press releases

DATA ANALYSIS

Data Synthesis

  • Collation of data
  • Estimation of key figures
  • Analysis of derived insights

Data Validation

  • Triangulation with data models
  • Reference against proprietary databases
  • Corroboration with industry experts

REPORT WRITING

Qualitative

  • Market drivers
  • Market challenges
  • Market trends
  • Five forces analysis

Quantitative

  • Market size and forecast
  • Market segmentation
  • Geographical insights
  • Competitive landscape

Interested in this report?

Get your sample now to see our research methodology and insights!

Download Now

Frequently Asked Questions

Customer Information System market growth will increase by USD 427.8 million during 2026-2030.

The Customer Information System market is expected to grow at a CAGR of 7.4% during 2026-2030.

Customer Information System market is segmented by Deployment (Cloud, On-premises) Component (Software, Services) Application (Water and wastewater management, Electricity and power management, Utility gas management)

Cogsdale Corp., Constellation Software Inc., CSG Systems International Inc., Fluentgrid Ltd., Gentrack Group Ltd., Hansen Technologies Ltd., HCL Technologies Ltd., IBM Corp., Indra Sistemas SA, Itineris NV, Kraken Technologies Ltd., Microsoft Corp., Milsoft Utility Solutions, Oracle Corp., Salesforce Inc., SAP SE, Wipro Ltd. are a few of the key vendors in the Customer Information System market.

North America will register the highest growth rate of 45.9% among the other regions. Therefore, the Customer Information System market in North America is expected to garner significant business opportunities for the vendors during the forecast period.

US, Canada, Mexico, China, Japan, India, Australia, South Korea, Indonesia, Germany, UK, France, Italy, Spain, The Netherlands, Brazil, Argentina, Chile, South Africa, Saudi Arabia, UAE, Egypt, Nigeria

  • Accelerated adoption of cloud-native architectures and SaaS models is the driving factor this market.

The Customer Information System market vendors should focus on grabbing business opportunities from the Deployment segment as it accounted for the largest market share in the base year.