Consumer Battery Market Analysis, Size, and Forecast 2025-2029: North America (US, Canada, and Mexico), APAC (China, Japan, and India), Europe (Germany, UK, and France), Middle East and Africa (Saudi Arabia, UAE, and South Africa), South America (Brazil, Argentina, and Colombia), and Rest of World (ROW)

Consumer Battery Market Analysis, Size, and Forecast 2025-2029:
North America (US, Canada, and Mexico), APAC (China, Japan, and India), Europe (Germany, UK, and France), Middle East and Africa (Saudi Arabia, UAE, and South Africa), South America (Brazil, Argentina, and Colombia), and Rest of World (ROW)

Published: Dec 2025 287 Pages SKU: IRTNTR41139

Market Overview at a Glance

$7.60 B
Market Opportunity
6.1%
CAGR 2024 - 2029
39%
APAC Growth
$13.31 B
Primary segment 2023

Consumer Battery Market Size 2025-2029

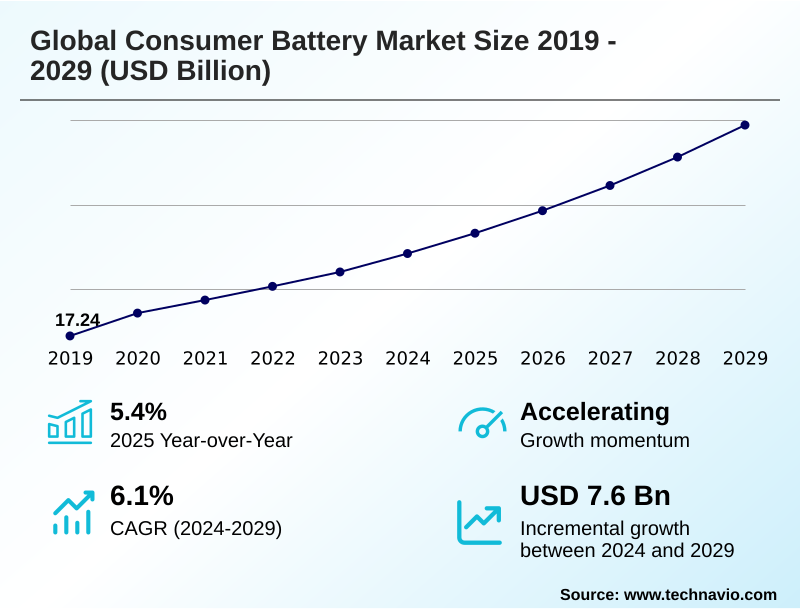
The consumer battery market size is valued to increase by USD 7.60 billion, at a CAGR of 6.1% from 2024 to 2029. Supportive government regulations will drive the consumer battery market.

Major Market Trends & Insights

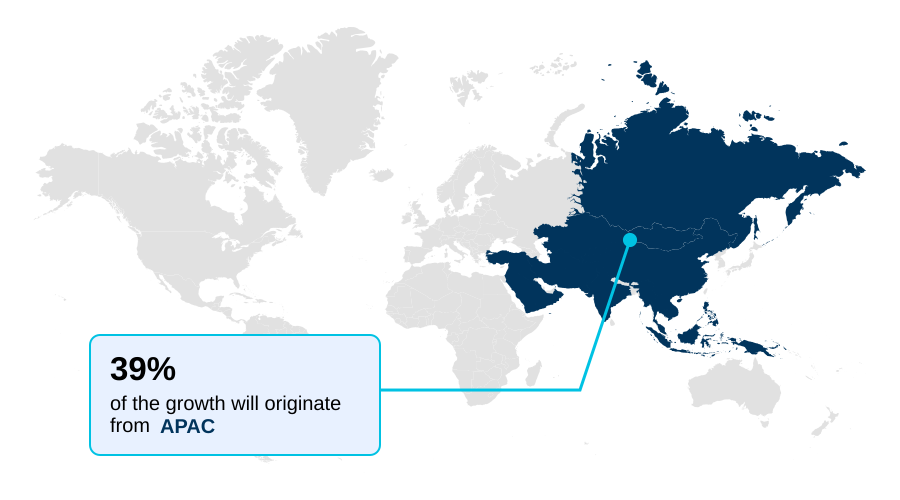
  • APAC dominated the market and accounted for a 39% growth during the forecast period.
  • By Type - Primary segment was valued at USD 13.31 billion in 2023
  • By End-user - Residential segment accounted for the largest market revenue share in 2023

Market Size & Forecast

  • Market Opportunities: USD 12.46 billion
  • Market Future Opportunities: USD 7.60 billion
  • CAGR from 2024 to 2029 : 6.1%

Market Summary

  • The consumer battery market is undergoing a significant transformation, driven by advancements in lithium-ion chemistry and the increasing demand for high-performance portable power sources. The proliferation of consumer electronics, from smartphones to battery-powered wearables, necessitates continuous improvements in energy density and cycle life.
  • A key industry focus is the development of a robust battery supply chain to manage the volatile raw material sourcing for critical components like anode materials and cathode materials. For instance, an OEM designing a new portable device must navigate complex trade-offs between battery manufacturing cost and performance, while ensuring compliance with evolving battery safety standards.
  • This includes incorporating features like thermal runaway prevention and overcharge protection. The shift towards an eco-friendly battery design is also gaining traction, pushing manufacturers to improve battery recycling processes and explore sustainable battery materials to address growing e-waste reduction initiatives.

What will be the Size of the Consumer Battery Market during the forecast period?

Get Key Insights on Market Forecast (PDF) Request Free Sample

How is the Consumer Battery Market Segmented?

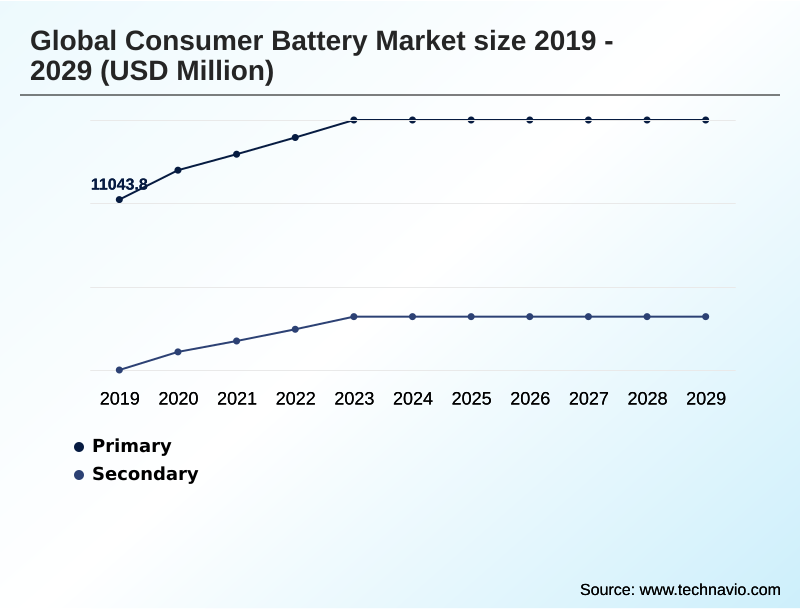
The consumer battery industry research report provides comprehensive data (region-wise segment analysis), with forecasts and estimates in "USD million" for the period 2025-2029, as well as historical data from 2019-2023 for the following segments.

  • Type
    • Primary
    • Secondary
  • End-user
    • Residential
    • Commercial
  • Technology
    • Lithium-ion batteries
    • Alkaline batteries
    • Nickel metal hydride
    • Nickel cadmium
    • Zinc-carbon batteries
  • Geography
    • North America
      • US
      • Canada
      • Mexico
    • APAC
      • China
      • Japan
      • India
    • Europe
      • Germany
      • UK
      • France
    • Middle East and Africa
      • Saudi Arabia
      • UAE
      • South Africa
    • South America
      • Brazil
      • Argentina
      • Colombia
    • Rest of World (ROW)

By Type Insights

The primary segment is estimated to witness significant growth during the forecast period.

Primary batteries, also known as disposable batteries, remain a foundational segment of the market, serving a vast range of low-drain electronics where convenience and long shelf life are paramount.

These single-use electrochemical cells, including alkaline battery technology and zinc-carbon cells, power everyday devices from remote controls to smoke detectors. However, the segment faces scrutiny over its environmental impact, as a significant portion of disposable batteries contribute to e-waste.

This has prompted a push toward eco-friendly battery design and improved battery recycling processes.

Industry data indicates that in certain regions, over 90% of specific primary battery compositions are improperly discarded, highlighting the need for better e-waste reduction initiatives and consumer education on responsible disposal.

Request Free Sample

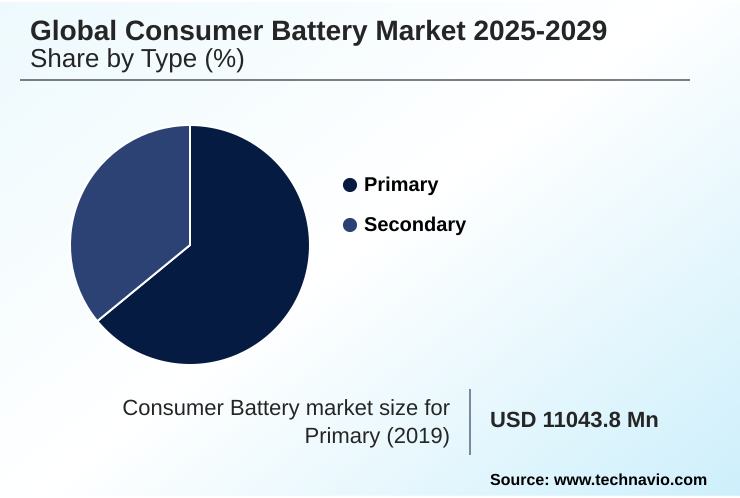
The Primary segment was valued at USD 13.31 billion in 2023 and showed a gradual increase during the forecast period.

Request Free Sample

Regional Analysis

APAC is estimated to contribute 39% to the growth of the global market during the forecast period.Technavio’s analysts have elaborately explained the regional trends and drivers that shape the market during the forecast period.

See How Consumer Battery Market Demand is Rising in APAC Request Free Sample

The geographic landscape is defined by regional specializations. APAC dominates global production, accounting for over 75% of the world's lithium-ion cell manufacturing capacity, which drives down battery manufacturing cost through a highly scaled battery supply chain.

North America leads in the adoption of residential energy storage systems, with some regions experiencing a 30% year-over-year increase in installations. This is driven by consumer demand for backup power systems and energy independence.

Europe is focused on creating a circular economy, enforcing stringent battery safety standards and e-waste reduction initiatives that influence global product design and battery recycling processes.

Market Dynamics

Our researchers analyzed the data with 2024 as the base year, along with the key drivers, trends, and challenges. A holistic analysis of drivers will help companies refine their marketing strategies to gain a competitive advantage.

  • Strategic decision-making in the consumer battery market increasingly hinges on navigating complex technological and regulatory landscapes. The comparison of li-ion vs nimh for consumer devices remains a critical evaluation for product designers, who must balance cost with performance for different applications.
  • Concurrently, the impact of raw material costs on battery prices forces a continuous re-evaluation of the battery supply chain and material sourcing strategies. A central theme is the role of bms in extending battery life, with advanced systems delivering tangible improvements in device longevity and reliability.
  • As businesses prepare for the future, advancements in solid-state battery technology are dictating long-term R&D investments, promising a leap in safety and energy density. Firms that successfully integrate innovations in wireless charging for portable devices report customer satisfaction scores that are nearly double those of competitors, underscoring the value of user-centric features.
  • However, challenges of counterfeit consumer batteries and evolving government regulations for battery disposal require vigilant compliance and quality control frameworks to mitigate risks and ensure market access.

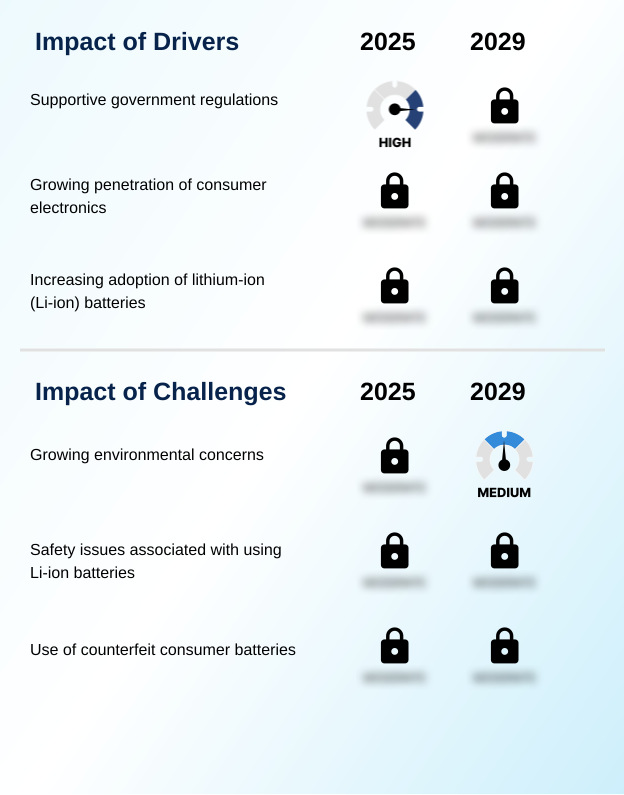
What are the key market drivers leading to the rise in the adoption of Consumer Battery Industry?

  • Supportive government regulations concerning battery safety, transport, and disposal are a key driver influencing the market's growth and product quality standards.

  • Market growth is fueled by the insatiable demand for consumer electronics power and the expanding universe of connected devices.
  • The proliferation of IoT device batteries is a significant driver, with demand in certain low-power application segments surging by over 200% as smart home and industrial automation become mainstream.
  • Government support for electric vehicle (EV) batteries creates beneficial economies of scale, lowering the battery manufacturing cost for consumer-grade cells by an average of 12%.
  • Additionally, supportive regulations have streamlined battery recycling processes, improving material recovery rates by 15% and fostering a more circular battery supply chain. These factors collectively expand the applications for portable power source technologies.

What are the market trends shaping the Consumer Battery Industry?

  • Technological developments aimed at enhancing battery performance are a significant upcoming market trend. These innovations focus on improving energy density, safety, and charging capabilities for consumer devices.

  • Key trends are reshaping the market, with a strong emphasis on intelligence and sustainability. The emergence of smart battery features, enabled by integrated battery management systems, allows for real-time monitoring of battery performance metrics, which has been shown to reduce unexpected device failures by up to 25%.
  • Concurrently, the adoption of wireless charging technology is accelerating, enhancing user convenience and driving new product designs for portable device battery applications. This technology has contributed to a 40% increase in positive user experience feedback for newly launched consumer electronics.
  • Furthermore, the industry is increasingly focused on an eco-friendly battery design, with innovations in battery recycling processes leading to higher material recovery and supporting e-waste reduction initiatives.

What challenges does the Consumer Battery Industry face during its growth?

  • Growing environmental concerns surrounding the production, disposal, and recycling of batteries present a key challenge to the industry's pursuit of sustainable growth.

  • The market faces significant hurdles related to supply chain stability and product safety. Volatility in raw material sourcing for critical inputs like lithium and cobalt can cause battery manufacturing costs to fluctuate by as much as 30% within a single quarter, disrupting financial planning. Safety remains a primary concern, as improper design can lead to thermal runaway prevention failures.
  • Counterfeit products, which often lack essential short-circuit protection and overcharge protection, are linked to a 70% higher incidence of device damage and pose serious risks. Addressing these challenges requires robust quality control, diversified sourcing strategies, and stringent adherence to battery safety standards across the entire battery supply chain.

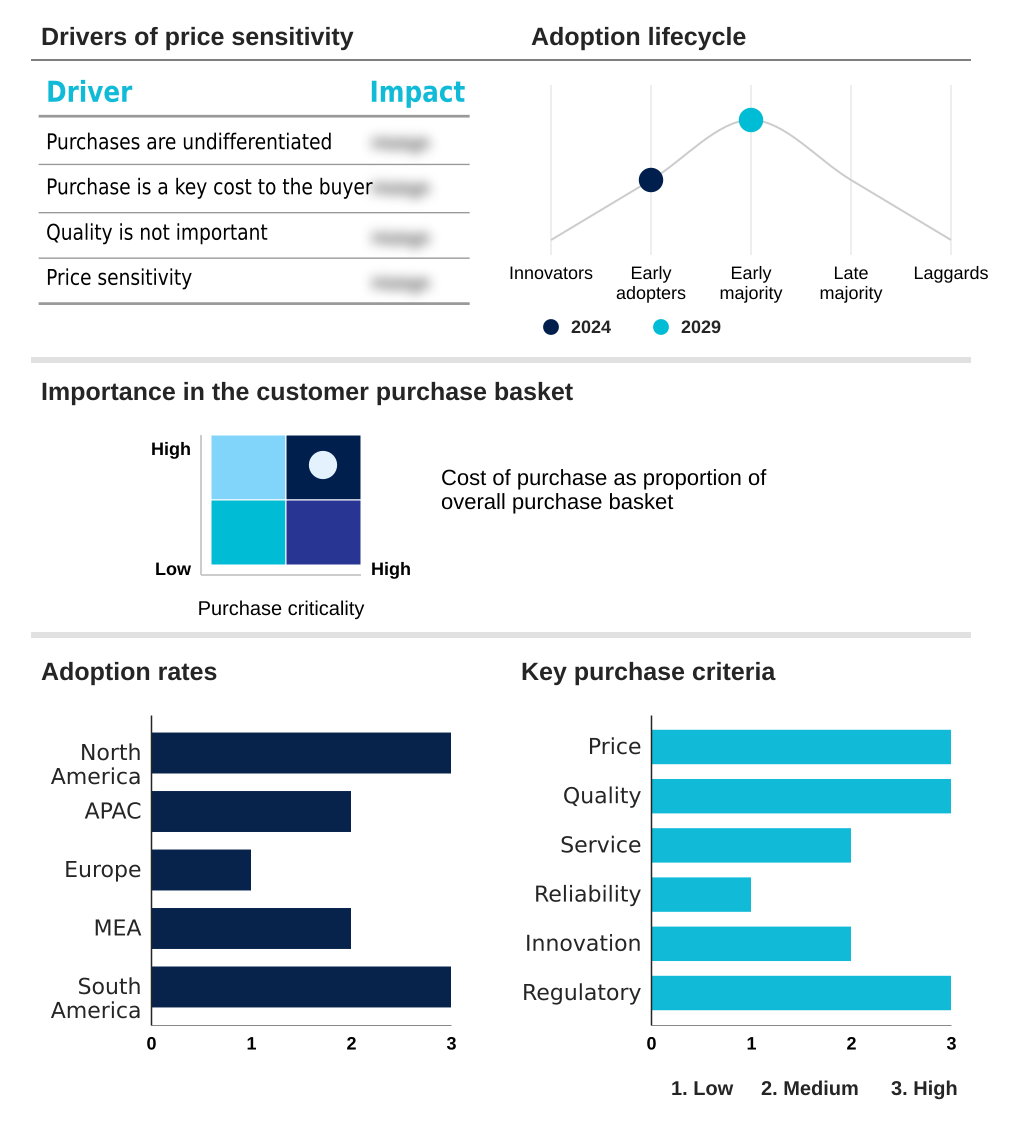
Exclusive Technavio Analysis on Customer Landscape

The consumer battery market forecasting report includes the adoption lifecycle of the market, covering from the innovator’s stage to the laggard’s stage. It focuses on adoption rates in different regions based on penetration. Furthermore, the consumer battery market report also includes key purchase criteria and drivers of price sensitivity to help companies evaluate and develop their market growth analysis strategies.

Customer Landscape of Consumer Battery Industry

Competitive Landscape

Companies are implementing various strategies, such as strategic alliances, consumer battery market forecast, partnerships, mergers and acquisitions, geographical expansion, and product/service launches, to enhance their presence in the industry.

Electrochem Automation Inc. - Key offerings include consumer battery products, from alkaline and lithium coin cells to rechargeable NiMH batteries, for a wide range of devices.

The industry research and growth report includes detailed analyses of the competitive landscape of the market and information about key companies, including:

  • Electrochem Automation Inc.
  • Energizer Holdings Inc.
  • EVE Energy Co. Ltd.
  • Eveready Industries India Ltd.
  • FDK Corp.
  • GP Batteries International Ltd.
  • Jiangmen TWD Technology Co. Ltd.
  • MAXELL EUROPE LTD.
  • Murata Manufacturing Co. Ltd.
  • Panasonic Holdings Corp.
  • Samsung SDI Co. Ltd.
  • Shenzhen PKCELL Battery Co. Ltd
  • Suzhou South Large Battery Co. Ltd.
  • The Duracell Co.
  • The Swatch Group Ltd.
  • Ultralife Corp.
  • VARTA AG

Qualitative and quantitative analysis of companies has been conducted to help clients understand the wider business environment as well as the strengths and weaknesses of key industry players. Data is qualitatively analyzed to categorize companies as pure play, category-focused, industry-focused, and diversified; it is quantitatively analyzed to categorize companies as dominant, leading, strong, tentative, and weak.

Recent Development and News in Consumer battery market

  • In August, 2024, leading South Korean manufacturers reportedly initiated a strategic pivot toward prismatic batteries, a form factor gaining popularity in the electric vehicle market, signaling a shift in manufacturing focus.
  • In November, 2024, Honda unveiled a demonstration production line for its proprietary all-solid-state batteries, marking a significant step toward the commercialization of next-generation battery technology.
  • In January, 2025, Masdar announced a project in the UAE to develop a landmark energy facility that will integrate 5.2 gigawatts of solar capacity with 19 gigawatt-hours of battery storage.
  • In March, 2025, Mexico's government introduced a mandate requiring that all future wind and solar energy projects must include battery energy storage systems, aiming to stabilize the national grid.

Dive into Technavio’s robust research methodology, blending expert interviews, extensive data synthesis, and validated models for unparalleled Consumer Battery Market insights. See full methodology.

Market Scope
Page number 287
Base year 2024
Historic period 2019-2023
Forecast period 2025-2029
Growth momentum & CAGR Accelerate at a CAGR of 6.1%
Market growth 2025-2029 USD 7596.8 million
Market structure Fragmented
YoY growth 2024-2025(%) 5.4%
Key countries US, Canada, Mexico, China, Japan, India, South Korea, Australia, Indonesia, Germany, UK, France, Italy, Spain, The Netherlands, Saudi Arabia, UAE, South Africa, Israel, Turkey, Brazil, Argentina and Colombia
Competitive landscape Leading Companies, Market Positioning of Companies, Competitive Strategies, and Industry Risks

Request Free Sample

Research Analyst Overview

  • The consumer battery market is evolving beyond simple power delivery to become a nexus of advanced materials science and intelligent system design. A key boardroom consideration is the strategic pivot toward an eco-friendly battery design, driven by both regulatory pressure and consumer demand. Incorporating sustainable battery materials is no longer optional but a critical differentiator.
  • Innovations in lithium-ion chemistry continue, but the focus is increasingly on enhancing safety features like thermal runaway prevention and short-circuit protection. Designs that integrate an advanced battery management system (BMS) for monitoring electrochemical cells demonstrate superior performance, with some achieving a 40% reduction in degradation rates under stress conditions.
  • The development of solid-state electrolyte technology and advanced electrode surface coating techniques represents the next frontier, promising to redefine benchmarks for energy density and cycle life in rechargeable battery packs and other portable power source applications.

What are the Key Data Covered in this Consumer Battery Market Research and Growth Report?

  • What is the expected growth of the Consumer Battery Market between 2025 and 2029?

    • USD 7.60 billion, at a CAGR of 6.1%

  • What segmentation does the market report cover?

    • The report is segmented by Type (Primary, and Secondary), End-user (Residential, and Commercial), Technology (Lithium-ion batteries, Alkaline batteries, Nickel metal hydride, Nickel cadmium, and Zinc-carbon batteries) and Geography (North America, APAC, Europe, Middle East and Africa, South America)

  • Which regions are analyzed in the report?

    • North America, APAC, Europe, Middle East and Africa and South America

  • What are the key growth drivers and market challenges?

    • Supportive government regulations, Growing environmental concerns

  • Who are the major players in the Consumer Battery Market?

    • Electrochem Automation Inc., Energizer Holdings Inc., EVE Energy Co. Ltd., Eveready Industries India Ltd., FDK Corp., GP Batteries International Ltd., Jiangmen TWD Technology Co. Ltd., MAXELL EUROPE LTD., Murata Manufacturing Co. Ltd., Panasonic Holdings Corp., Samsung SDI Co. Ltd., Shenzhen PKCELL Battery Co. Ltd, Suzhou South Large Battery Co. Ltd., The Duracell Co., The Swatch Group Ltd., Ultralife Corp. and VARTA AG

Market Research Insights

  • The market's dynamics are shaped by the dual demand for high-capacity energy storage solutions and efficient consumer electronics power. The transition toward electric vehicle (EV) batteries is creating economies of scale, impacting the battery manufacturing cost for all segments.
  • The adoption of advanced battery management systems has led to a 15% improvement in battery lifespan optimization for portable device battery applications. Furthermore, strategic raw material sourcing has helped manufacturers mitigate price volatility, reducing production costs by up to 10% in certain segments.
  • The expansion into residential energy storage and grid energy storage, coupled with the rising use of IoT device batteries, underscores the industry's broadening scope beyond traditional consumer goods.

We can help! Our analysts can customize this consumer battery market research report to meet your requirements.

Get in touch

1. Executive Summary

1.1 Market overview

Executive Summary - Chart on Market Overview
Executive Summary - Data Table on Market Overview
Executive Summary - Chart on Global Market Characteristics
Executive Summary - Chart on Market by Geography
Executive Summary - Chart on Market Segmentation by Type
Executive Summary - Chart on Market Segmentation by End-user
Executive Summary - Chart on Market Segmentation by Technology
Executive Summary - Chart on Incremental Growth
Executive Summary - Data Table on Incremental Growth
Executive Summary - Chart on Company Market Positioning

2. Technavio Analysis

2.1 Analysis of price sensitivity, lifecycle, customer purchase basket, adoption rates, and purchase criteria

2.2 Criticality of inputs and Factors of differentiation

Chart on Overview on criticality of inputs and factors of differentiation

2.3 Factors of disruption

Chart on Overview on factors of disruption

2.4 Impact of drivers and challenges

Chart on Impact of drivers and challenges in 2024 and 2029

3. Market Landscape

3.1 Market ecosystem

Chart on Parent Market
Data Table on - Parent Market

3.2 Market characteristics

Chart on Market characteristics analysis

3.3 Value chain analysis

Chart on Value chain analysis

4. Market Sizing

4.1 Market definition

Data Table on Offerings of companies included in the market definition

4.2 Market segment analysis

Market segments

4.3 Market size 2024

4.4 Market outlook: Forecast for 2024-2029

Chart on Global - Market size and forecast 2024-2029 ($ million)
Data Table on Global - Market size and forecast 2024-2029 ($ million)
Chart on Global Market: Year-over-year growth 2024-2029 (%)
Data Table on Global Market: Year-over-year growth 2024-2029 (%)

5. Historic Market Size

5.1 Global Consumer Battery Market 2019 - 2023

Historic Market Size - Data Table on Global Consumer Battery Market 2019 - 2023 ($ million)

5.2 Type segment analysis 2019 - 2023

Historic Market Size - Type Segment 2019 - 2023 ($ million)

5.3 End-user segment analysis 2019 - 2023

Historic Market Size - End-user Segment 2019 - 2023 ($ million)

5.4 Technology segment analysis 2019 - 2023

Historic Market Size - Technology Segment 2019 - 2023 ($ million)

5.5 Geography segment analysis 2019 - 2023

Historic Market Size - Geography Segment 2019 - 2023 ($ million)

5.6 Country segment analysis 2019 - 2023

Historic Market Size - Country Segment 2019 - 2023 ($ million)

6. Qualitative Analysis

6.1 Impact of AI in global consumer battery market

7. Five Forces Analysis

7.1 Five forces summary

Five forces analysis - Comparison between 2024 and 2029

7.2 Bargaining power of buyers

Bargaining power of buyers - Impact of key factors 2024 and 2029

7.3 Bargaining power of suppliers

Bargaining power of suppliers - Impact of key factors in 2024 and 2029

7.4 Threat of new entrants

Threat of new entrants - Impact of key factors in 2024 and 2029

7.5 Threat of substitutes

Threat of substitutes - Impact of key factors in 2024 and 2029

7.6 Threat of rivalry

Threat of rivalry - Impact of key factors in 2024 and 2029

7.7 Market condition

Chart on Market condition - Five forces 2024 and 2029

8. Market Segmentation by Type

8.1 Market segments

Chart on Type - Market share 2024-2029 (%)
Data Table on Type - Market share 2024-2029 (%)

8.2 Comparison by Type

Chart on Comparison by Type
Data Table on Comparison by Type

8.3 Primary - Market size and forecast 2024-2029

Chart on Primary - Market size and forecast 2024-2029 ($ million)
Data Table on Primary - Market size and forecast 2024-2029 ($ million)
Chart on Primary - Year-over-year growth 2024-2029 (%)
Data Table on Primary - Year-over-year growth 2024-2029 (%)

8.4 Secondary - Market size and forecast 2024-2029

Chart on Secondary - Market size and forecast 2024-2029 ($ million)
Data Table on Secondary - Market size and forecast 2024-2029 ($ million)
Chart on Secondary - Year-over-year growth 2024-2029 (%)
Data Table on Secondary - Year-over-year growth 2024-2029 (%)

8.5 Market opportunity by Type

Market opportunity by Type ($ million)
Data Table on Market opportunity by Type ($ million)

9. Market Segmentation by End-user

9.1 Market segments

Chart on End-user - Market share 2024-2029 (%)
Data Table on End-user - Market share 2024-2029 (%)

9.2 Comparison by End-user

Chart on Comparison by End-user
Data Table on Comparison by End-user

9.3 Residential - Market size and forecast 2024-2029

Chart on Residential - Market size and forecast 2024-2029 ($ million)
Data Table on Residential - Market size and forecast 2024-2029 ($ million)
Chart on Residential - Year-over-year growth 2024-2029 (%)
Data Table on Residential - Year-over-year growth 2024-2029 (%)

9.4 Commercial - Market size and forecast 2024-2029

Chart on Commercial - Market size and forecast 2024-2029 ($ million)
Data Table on Commercial - Market size and forecast 2024-2029 ($ million)
Chart on Commercial - Year-over-year growth 2024-2029 (%)
Data Table on Commercial - Year-over-year growth 2024-2029 (%)

9.5 Market opportunity by End-user

Market opportunity by End-user ($ million)
Data Table on Market opportunity by End-user ($ million)

10. Market Segmentation by Technology

10.1 Market segments

Chart on Technology - Market share 2024-2029 (%)
Data Table on Technology - Market share 2024-2029 (%)

10.2 Comparison by Technology

Chart on Comparison by Technology
Data Table on Comparison by Technology

10.3 Lithium-ion batteries - Market size and forecast 2024-2029

Chart on Lithium-ion batteries - Market size and forecast 2024-2029 ($ million)
Data Table on Lithium-ion batteries - Market size and forecast 2024-2029 ($ million)
Chart on Lithium-ion batteries - Year-over-year growth 2024-2029 (%)
Data Table on Lithium-ion batteries - Year-over-year growth 2024-2029 (%)

10.4 Alkaline batteries - Market size and forecast 2024-2029

Chart on Alkaline batteries - Market size and forecast 2024-2029 ($ million)
Data Table on Alkaline batteries - Market size and forecast 2024-2029 ($ million)
Chart on Alkaline batteries - Year-over-year growth 2024-2029 (%)
Data Table on Alkaline batteries - Year-over-year growth 2024-2029 (%)

10.5 Nickel metal hydride - Market size and forecast 2024-2029

Chart on Nickel metal hydride - Market size and forecast 2024-2029 ($ million)
Data Table on Nickel metal hydride - Market size and forecast 2024-2029 ($ million)
Chart on Nickel metal hydride - Year-over-year growth 2024-2029 (%)
Data Table on Nickel metal hydride - Year-over-year growth 2024-2029 (%)

10.6 Nickel cadmium - Market size and forecast 2024-2029

Chart on Nickel cadmium - Market size and forecast 2024-2029 ($ million)
Data Table on Nickel cadmium - Market size and forecast 2024-2029 ($ million)
Chart on Nickel cadmium - Year-over-year growth 2024-2029 (%)
Data Table on Nickel cadmium - Year-over-year growth 2024-2029 (%)

10.7 Zinc-carbon batteries - Market size and forecast 2024-2029

Chart on Zinc-carbon batteries - Market size and forecast 2024-2029 ($ million)
Data Table on Zinc-carbon batteries - Market size and forecast 2024-2029 ($ million)
Chart on Zinc-carbon batteries - Year-over-year growth 2024-2029 (%)
Data Table on Zinc-carbon batteries - Year-over-year growth 2024-2029 (%)

10.8 Market opportunity by Technology

Market opportunity by Technology ($ million)
Data Table on Market opportunity by Technology ($ million)

11. Customer Landscape

11.1 Customer landscape overview

Analysis of price sensitivity, lifecycle, customer purchase basket, adoption rates, and purchase criteria

12. Geographic Landscape

12.1 Geographic segmentation

Chart on Market share by geography 2024-2029 (%)
Data Table on Market share by geography 2024-2029 (%)

12.2 Geographic comparison

Chart on Geographic comparison
Data Table on Geographic comparison

12.3 North America - Market size and forecast 2024-2029

Chart on North America - Market size and forecast 2024-2029 ($ million)
Data Table on North America - Market size and forecast 2024-2029 ($ million)
Chart on North America - Year-over-year growth 2024-2029 (%)
Data Table on North America - Year-over-year growth 2024-2029 (%)
Chart on Regional Comparison - North America
Data Table on Regional Comparison - North America

12.3.1 US - Market size and forecast 2024-2029

Chart on US - Market size and forecast 2024-2029 ($ million)
Data Table on US - Market size and forecast 2024-2029 ($ million)
Chart on US - Year-over-year growth 2024-2029 (%)
Data Table on US - Year-over-year growth 2024-2029 (%)

12.3.2 Canada - Market size and forecast 2024-2029

Chart on Canada - Market size and forecast 2024-2029 ($ million)
Data Table on Canada - Market size and forecast 2024-2029 ($ million)
Chart on Canada - Year-over-year growth 2024-2029 (%)
Data Table on Canada - Year-over-year growth 2024-2029 (%)

12.3.3 Mexico - Market size and forecast 2024-2029

Chart on Mexico - Market size and forecast 2024-2029 ($ million)
Data Table on Mexico - Market size and forecast 2024-2029 ($ million)
Chart on Mexico - Year-over-year growth 2024-2029 (%)
Data Table on Mexico - Year-over-year growth 2024-2029 (%)

12.4 APAC - Market size and forecast 2024-2029

Chart on APAC - Market size and forecast 2024-2029 ($ million)
Data Table on APAC - Market size and forecast 2024-2029 ($ million)
Chart on APAC - Year-over-year growth 2024-2029 (%)
Data Table on APAC - Year-over-year growth 2024-2029 (%)
Chart on Regional Comparison - APAC
Data Table on Regional Comparison - APAC

12.4.1 China - Market size and forecast 2024-2029

Chart on China - Market size and forecast 2024-2029 ($ million)
Data Table on China - Market size and forecast 2024-2029 ($ million)
Chart on China - Year-over-year growth 2024-2029 (%)
Data Table on China - Year-over-year growth 2024-2029 (%)

12.4.2 Japan - Market size and forecast 2024-2029

Chart on Japan - Market size and forecast 2024-2029 ($ million)
Data Table on Japan - Market size and forecast 2024-2029 ($ million)
Chart on Japan - Year-over-year growth 2024-2029 (%)
Data Table on Japan - Year-over-year growth 2024-2029 (%)

12.4.3 India - Market size and forecast 2024-2029

Chart on India - Market size and forecast 2024-2029 ($ million)
Data Table on India - Market size and forecast 2024-2029 ($ million)
Chart on India - Year-over-year growth 2024-2029 (%)
Data Table on India - Year-over-year growth 2024-2029 (%)

12.4.4 South Korea - Market size and forecast 2024-2029

Chart on South Korea - Market size and forecast 2024-2029 ($ million)
Data Table on South Korea - Market size and forecast 2024-2029 ($ million)
Chart on South Korea - Year-over-year growth 2024-2029 (%)
Data Table on South Korea - Year-over-year growth 2024-2029 (%)

12.4.5 Australia - Market size and forecast 2024-2029

Chart on Australia - Market size and forecast 2024-2029 ($ million)
Data Table on Australia - Market size and forecast 2024-2029 ($ million)
Chart on Australia - Year-over-year growth 2024-2029 (%)
Data Table on Australia - Year-over-year growth 2024-2029 (%)

12.4.6 Indonesia - Market size and forecast 2024-2029

Chart on Indonesia - Market size and forecast 2024-2029 ($ million)
Data Table on Indonesia - Market size and forecast 2024-2029 ($ million)
Chart on Indonesia - Year-over-year growth 2024-2029 (%)
Data Table on Indonesia - Year-over-year growth 2024-2029 (%)

12.5 Europe - Market size and forecast 2024-2029

Chart on Europe - Market size and forecast 2024-2029 ($ million)
Data Table on Europe - Market size and forecast 2024-2029 ($ million)
Chart on Europe - Year-over-year growth 2024-2029 (%)
Data Table on Europe - Year-over-year growth 2024-2029 (%)
Chart on Regional Comparison - Europe
Data Table on Regional Comparison - Europe

12.5.1 Germany - Market size and forecast 2024-2029

Chart on Germany - Market size and forecast 2024-2029 ($ million)
Data Table on Germany - Market size and forecast 2024-2029 ($ million)
Chart on Germany - Year-over-year growth 2024-2029 (%)
Data Table on Germany - Year-over-year growth 2024-2029 (%)

12.5.2 UK - Market size and forecast 2024-2029

Chart on UK - Market size and forecast 2024-2029 ($ million)
Data Table on UK - Market size and forecast 2024-2029 ($ million)
Chart on UK - Year-over-year growth 2024-2029 (%)
Data Table on UK - Year-over-year growth 2024-2029 (%)

12.5.3 France - Market size and forecast 2024-2029

Chart on France - Market size and forecast 2024-2029 ($ million)
Data Table on France - Market size and forecast 2024-2029 ($ million)
Chart on France - Year-over-year growth 2024-2029 (%)
Data Table on France - Year-over-year growth 2024-2029 (%)

12.5.4 Italy - Market size and forecast 2024-2029

Chart on Italy - Market size and forecast 2024-2029 ($ million)
Data Table on Italy - Market size and forecast 2024-2029 ($ million)
Chart on Italy - Year-over-year growth 2024-2029 (%)
Data Table on Italy - Year-over-year growth 2024-2029 (%)

12.5.5 Spain - Market size and forecast 2024-2029

Chart on Spain - Market size and forecast 2024-2029 ($ million)
Data Table on Spain - Market size and forecast 2024-2029 ($ million)
Chart on Spain - Year-over-year growth 2024-2029 (%)
Data Table on Spain - Year-over-year growth 2024-2029 (%)

12.5.6 The Netherlands - Market size and forecast 2024-2029

Chart on The Netherlands - Market size and forecast 2024-2029 ($ million)
Data Table on The Netherlands - Market size and forecast 2024-2029 ($ million)
Chart on The Netherlands - Year-over-year growth 2024-2029 (%)
Data Table on The Netherlands - Year-over-year growth 2024-2029 (%)

12.6 Middle East and Africa - Market size and forecast 2024-2029

Chart on Middle East and Africa - Market size and forecast 2024-2029 ($ million)
Data Table on Middle East and Africa - Market size and forecast 2024-2029 ($ million)
Chart on Middle East and Africa - Year-over-year growth 2024-2029 (%)
Data Table on Middle East and Africa - Year-over-year growth 2024-2029 (%)
Chart on Regional Comparison - Middle East and Africa
Data Table on Regional Comparison - Middle East and Africa

12.6.1 Saudi Arabia - Market size and forecast 2024-2029

Chart on Saudi Arabia - Market size and forecast 2024-2029 ($ million)
Data Table on Saudi Arabia - Market size and forecast 2024-2029 ($ million)
Chart on Saudi Arabia - Year-over-year growth 2024-2029 (%)
Data Table on Saudi Arabia - Year-over-year growth 2024-2029 (%)

12.6.2 UAE - Market size and forecast 2024-2029

Chart on UAE - Market size and forecast 2024-2029 ($ million)
Data Table on UAE - Market size and forecast 2024-2029 ($ million)
Chart on UAE - Year-over-year growth 2024-2029 (%)
Data Table on UAE - Year-over-year growth 2024-2029 (%)

12.6.3 South Africa - Market size and forecast 2024-2029

Chart on South Africa - Market size and forecast 2024-2029 ($ million)
Data Table on South Africa - Market size and forecast 2024-2029 ($ million)
Chart on South Africa - Year-over-year growth 2024-2029 (%)
Data Table on South Africa - Year-over-year growth 2024-2029 (%)

12.6.4 Israel - Market size and forecast 2024-2029

Chart on Israel - Market size and forecast 2024-2029 ($ million)
Data Table on Israel - Market size and forecast 2024-2029 ($ million)
Chart on Israel - Year-over-year growth 2024-2029 (%)
Data Table on Israel - Year-over-year growth 2024-2029 (%)

12.6.5 Turkey - Market size and forecast 2024-2029

Chart on Turkey - Market size and forecast 2024-2029 ($ million)
Data Table on Turkey - Market size and forecast 2024-2029 ($ million)
Chart on Turkey - Year-over-year growth 2024-2029 (%)
Data Table on Turkey - Year-over-year growth 2024-2029 (%)

12.7 South America - Market size and forecast 2024-2029

Chart on South America - Market size and forecast 2024-2029 ($ million)
Data Table on South America - Market size and forecast 2024-2029 ($ million)
Chart on South America - Year-over-year growth 2024-2029 (%)
Data Table on South America - Year-over-year growth 2024-2029 (%)
Chart on Regional Comparison - South America
Data Table on Regional Comparison - South America

12.7.1 Brazil - Market size and forecast 2024-2029

Chart on Brazil - Market size and forecast 2024-2029 ($ million)
Data Table on Brazil - Market size and forecast 2024-2029 ($ million)
Chart on Brazil - Year-over-year growth 2024-2029 (%)
Data Table on Brazil - Year-over-year growth 2024-2029 (%)

12.7.2 Argentina - Market size and forecast 2024-2029

Chart on Argentina - Market size and forecast 2024-2029 ($ million)
Data Table on Argentina - Market size and forecast 2024-2029 ($ million)
Chart on Argentina - Year-over-year growth 2024-2029 (%)
Data Table on Argentina - Year-over-year growth 2024-2029 (%)

12.7.3 Colombia - Market size and forecast 2024-2029

Chart on Colombia - Market size and forecast 2024-2029 ($ million)
Data Table on Colombia - Market size and forecast 2024-2029 ($ million)
Chart on Colombia - Year-over-year growth 2024-2029 (%)
Data Table on Colombia - Year-over-year growth 2024-2029 (%)

12.8 Market opportunity by geography

Market opportunity by geography ($ million)
Data Tables on Market opportunity by geography ($ million)

13. Drivers, Challenges, and Opportunity

13.1 Market drivers

Supportive government regulations
Growing penetration of consumer electronics
Increasing adoption of lithium-ion (Li-ion) batteries

13.2 Market challenges

Growing environmental concerns
Safety issues associated with using Li-ion batteries
Use of counterfeit consumer batteries

13.3 Impact of drivers and challenges

Impact of drivers and challenges in 2024 and 2029

13.4 Market opportunities

Technological developments in battery performance
Growing use of sustainable and eco-friendly batteries
Emergence of smart batteries

14. Competitive Landscape

14.1 Overview

14.2

Overview on criticality of inputs and factors of differentiation

14.3 Landscape disruption

Overview on factors of disruption

14.4 Industry risks

Impact of key risks on business

15. Competitive Analysis

15.1 Companies profiled

Companies covered

15.2 Company ranking index

15.3 Market positioning of companies

Matrix on companies position and classification

15.4 Electrochem Automation Inc.

Electrochem Automation Inc. - Overview
Electrochem Automation Inc. - Product / Service
Electrochem Automation Inc. - Key offerings
SWOT

15.5 Energizer Holdings Inc.

Energizer Holdings Inc. - Overview
Energizer Holdings Inc. - Business segments
Energizer Holdings Inc. - Key offerings
Energizer Holdings Inc. - Segment focus
SWOT

15.6 EVE Energy Co. Ltd.

EVE Energy Co. Ltd. - Overview
EVE Energy Co. Ltd. - Product / Service
EVE Energy Co. Ltd. - Key offerings
SWOT

15.7 Eveready Industries India Ltd.

Eveready Industries India Ltd. - Overview
Eveready Industries India Ltd. - Product / Service
Eveready Industries India Ltd. - Key offerings
SWOT

15.8 FDK Corp.

FDK Corp. - Overview
FDK Corp. - Product / Service
FDK Corp. - Key offerings
SWOT

15.9 GP Batteries International Ltd.

GP Batteries International Ltd. - Overview
GP Batteries International Ltd. - Product / Service
GP Batteries International Ltd. - Key offerings
SWOT

15.10 Jiangmen TWD Technology Co. Ltd.

Jiangmen TWD Technology Co. Ltd. - Overview
Jiangmen TWD Technology Co. Ltd. - Product / Service
Jiangmen TWD Technology Co. Ltd. - Key offerings
SWOT

15.11 MAXELL EUROPE LTD.

MAXELL EUROPE LTD. - Overview
MAXELL EUROPE LTD. - Product / Service
MAXELL EUROPE LTD. - Key offerings
SWOT

15.12 Murata Manufacturing Co. Ltd.

Murata Manufacturing Co. Ltd. - Overview
Murata Manufacturing Co. Ltd. - Business segments
Murata Manufacturing Co. Ltd. - Key news
Murata Manufacturing Co. Ltd. - Key offerings
Murata Manufacturing Co. Ltd. - Segment focus
SWOT

15.13 Panasonic Holdings Corp.

Panasonic Holdings Corp. - Overview
Panasonic Holdings Corp. - Business segments
Panasonic Holdings Corp. - Key news
Panasonic Holdings Corp. - Key offerings
Panasonic Holdings Corp. - Segment focus
SWOT

15.14 Shenzhen PKCELL Battery Co. Ltd

Shenzhen PKCELL Battery Co. Ltd - Overview
Shenzhen PKCELL Battery Co. Ltd - Product / Service
Shenzhen PKCELL Battery Co. Ltd - Key offerings
SWOT

15.15 The Duracell Co.

The Duracell Co. - Overview
The Duracell Co. - Product / Service
The Duracell Co. - Key offerings
SWOT

15.16 The Swatch Group Ltd.

The Swatch Group Ltd. - Overview
The Swatch Group Ltd. - Business segments
The Swatch Group Ltd. - Key offerings
The Swatch Group Ltd. - Segment focus
SWOT

15.17 Ultralife Corp.

Ultralife Corp. - Overview
Ultralife Corp. - Business segments
Ultralife Corp. - Key news
Ultralife Corp. - Key offerings
Ultralife Corp. - Segment focus
SWOT

15.18 VARTA AG

VARTA AG - Overview
VARTA AG - Business segments
VARTA AG - Key offerings
VARTA AG - Segment focus
SWOT

16. Appendix

16.1 Scope of the report

Market definition
Objectives
Notes and caveats

16.2 Inclusions and exclusions checklist

Inclusions checklist
Exclusions checklist

16.3 Currency conversion rates for US$

16.4 Research methodology

16.5 Data procurement

Information sources

16.6 Data validation

16.7 Validation techniques employed for market sizing

16.8 Data synthesis

16.9 360 degree market analysis

16.10 List of abbreviations

Research Methodology

Technavio presents a detailed picture of the market by way of study, synthesis, and summation of data from multiple sources. The analysts have presented the various facets of the market with a particular focus on identifying the key industry influencers. The data thus presented is comprehensive, reliable, and the result of extensive research, both primary and secondary.

INFORMATION SOURCES

Primary sources

  • Manufacturers and suppliers
  • Channel partners
  • Industry experts
  • Strategic decision makers

Secondary sources

  • Industry journals and periodicals
  • Government data
  • Financial reports of key industry players
  • Historical data
  • Press releases

DATA ANALYSIS

Data Synthesis

  • Collation of data
  • Estimation of key figures
  • Analysis of derived insights

Data Validation

  • Triangulation with data models
  • Reference against proprietary databases
  • Corroboration with industry experts

REPORT WRITING

Qualitative

  • Market drivers
  • Market challenges
  • Market trends
  • Five forces analysis

Quantitative

  • Market size and forecast
  • Market segmentation
  • Geographical insights
  • Competitive landscape

Interested in this report?

Get your sample now to see our research methodology and insights!

Download Now

Frequently Asked Questions

Consumer Battery market growth will increase by USD 7596.8 million during 2025-2029.

The Consumer Battery market is expected to grow at a CAGR of 6.1% during 2025-2029.

Consumer Battery market is segmented by Type (Primary, Secondary) End-user (Residential, Commercial) Technology (Lithium-ion batteries, Alkaline batteries, Nickel metal hydride, Nickel cadmium, Zinc-carbon batteries)

Electrochem Automation Inc., Energizer Holdings Inc., EVE Energy Co. Ltd., Eveready Industries India Ltd., FDK Corp., GP Batteries International Ltd., Jiangmen TWD Technology Co. Ltd., MAXELL EUROPE LTD., Murata Manufacturing Co. Ltd., Panasonic Holdings Corp., Samsung SDI Co. Ltd., Shenzhen PKCELL Battery Co. Ltd, Suzhou South Large Battery Co. Ltd., The Duracell Co., The Swatch Group Ltd., Ultralife Corp., VARTA AG are a few of the key vendors in the Consumer Battery market.

APAC will register the highest growth rate of 39% among the other regions. Therefore, the Consumer Battery market in APAC is expected to garner significant business opportunities for the vendors during the forecast period.

US, Canada, Mexico, China, Japan, India, South Korea, Australia, Indonesia, Germany, UK, France, Italy, Spain, The Netherlands, Saudi Arabia, UAE, South Africa, Israel, Turkey, Brazil, Argentina, Colombia

  • Supportive government regulations is the driving factor this market.

The Consumer Battery market vendors should focus on grabbing business opportunities from the Type segment as it accounted for the largest market share in the base year.