Concentrating Solar Collectors Market Analysis, Size, and Forecast 2026-2030: APAC (China, India, and Japan), North America (US, Canada, and Mexico), Europe (Spain, Italy, and France), South America (Brazil and Argentina), Middle East and Africa (South Africa, Saudi Arabia, and UAE), and Rest of World (ROW)

Concentrating Solar Collectors Market Analysis, Size, and Forecast 2026-2030:
APAC (China, India, and Japan), North America (US, Canada, and Mexico), Europe (Spain, Italy, and France), South America (Brazil and Argentina), Middle East and Africa (South Africa, Saudi Arabia, and UAE), and Rest of World (ROW)

Published: Jan 2026 283 Pages SKU: IRTNTR72489

Market Overview at a Glance

$4.24 B
Market Opportunity
11.2%
CAGR 2025 - 2030
46.3%
APAC Growth
$2.57 B
Industrial segment 2024

Concentrating Solar Collectors Market Size 2026-2030

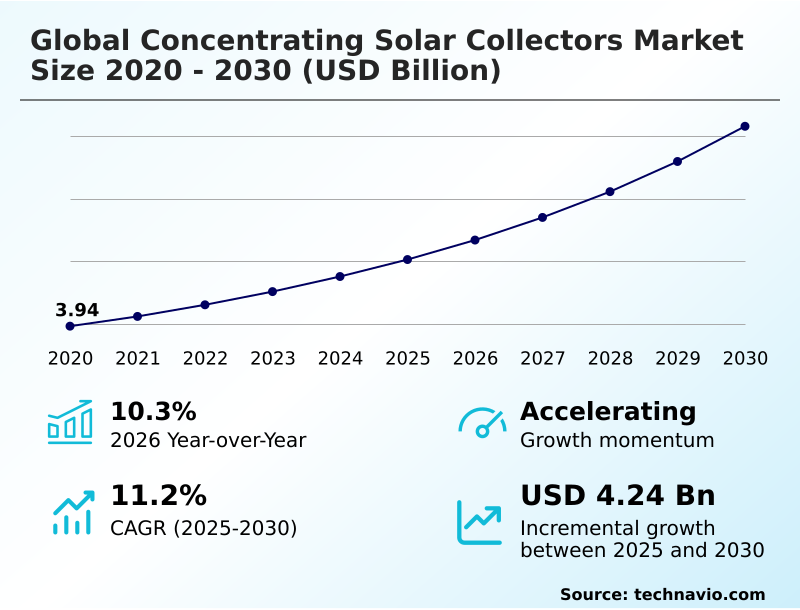
The concentrating solar collectors market size is valued to increase by USD 4.24 billion, at a CAGR of 11.2% from 2025 to 2030. Rising utility-scale solar thermal deployment for dispatchable renewable power will drive the concentrating solar collectors market.

Major Market Trends & Insights

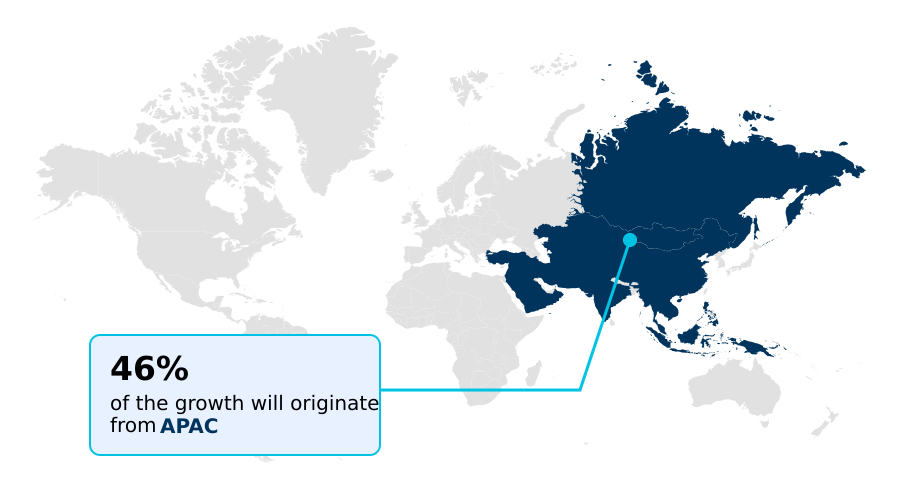
  • APAC dominated the market and accounted for a 46.3% growth during the forecast period.
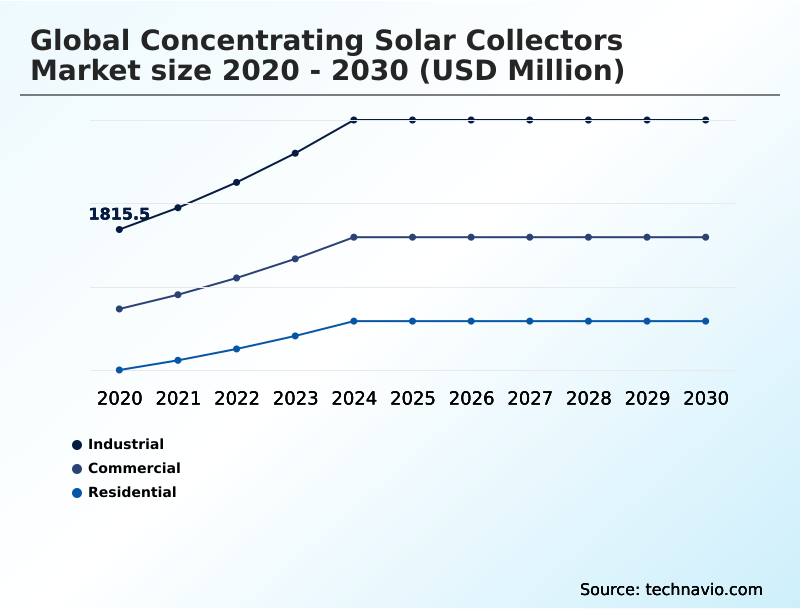
  • By End-user - Industrial segment was valued at USD 2.57 billion in 2024
  • By Type - Parabolic trough segment accounted for the largest market revenue share in 2024

Market Size & Forecast

  • Market Opportunities: USD 6.36 billion
  • Market Future Opportunities: USD 4.24 billion
  • CAGR from 2025 to 2030 : 11.2%

Market Summary

  • The concentrating solar collectors market is expanding as the global energy transition prioritizes dispatchable renewable power sources capable of ensuring grid stability. This technology, particularly systems incorporating thermal energy storage, provides a reliable alternative to intermittent renewables by delivering consistent power.
  • A key market trend is the diversification of applications beyond electricity generation into industrial process heat, where high-temperature heat is essential for sectors like chemicals and mining. For instance, a manufacturing facility can integrate concentrating solar collectors to produce steam for its operations, reducing reliance on fossil fuels and mitigating exposure to volatile energy prices and carbon taxes.
  • However, the market's momentum is constrained by significant challenges, including the high upfront capital investment needed for large-scale projects and long project payback periods. Furthermore, the technology faces intense competition from the falling costs of solar photovoltaics and battery storage, which presents a difficult financial hurdle for project developers and investors to overcome.

What will be the Size of the Concentrating Solar Collectors Market during the forecast period?

Get Key Insights on Market Forecast (PDF) Request Free Sample

How is the Concentrating Solar Collectors Market Segmented?

The concentrating solar collectors industry research report provides comprehensive data (region-wise segment analysis), with forecasts and estimates in "USD million" for the period 2026-2030, as well as historical data from 2020-2024 for the following segments.

  • End-user
    • Industrial
    • Commercial
    • Residential
  • Type
    • Parabolic trough
    • Linear fresnel
    • Others
  • Technology
    • Single-axis tracking systems
    • Fixed tilt systems
    • Dual-axis tracking systems
  • Geography
    • APAC
      • China
      • India
      • Japan
    • North America
      • US
      • Canada
      • Mexico
    • Europe
      • Spain
      • Italy
      • France
    • South America
      • Brazil
      • Argentina
    • Middle East and Africa
      • South Africa
      • Saudi Arabia
      • UAE
    • Rest of World (ROW)

By End-user Insights

The industrial segment is estimated to witness significant growth during the forecast period.

The industrial segment is a critical growth area, driven by the demand for high-temperature heat solutions for applications like industrial process heat and green hydrogen production.

This sector leverages advanced thermal energy storage and parabolic trough systems to secure dispatchable renewable power, aligning with corporate sustainability goals.

As carbon pricing mechanisms expand, adopting low-carbon heat solutions becomes a strategic imperative for manufacturers to meet renewable energy targets. The push for thermal detoxification and enhanced energy independence supports investment in this solar thermal technology.

One key region spearheading this industrial adoption accounts for over 46% of the market's incremental growth, underscoring the geographic concentration of demand and fulfillment of clean energy goals.

Request Free Sample

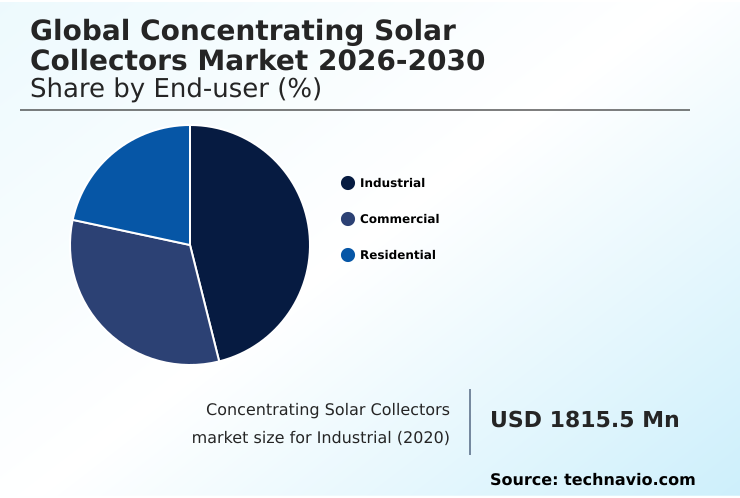
The Industrial segment was valued at USD 2.57 billion in 2024 and showed a gradual increase during the forecast period.

Request Free Sample

Regional Analysis

APAC is estimated to contribute 46.3% to the growth of the global market during the forecast period.Technavio’s analysts have elaborately explained the regional trends and drivers that shape the market during the forecast period.

See How Concentrating Solar Collectors Market Demand is Rising in APAC Request Free Sample

The geographic landscape is primarily defined by direct normal irradiance levels, with regions offering high solar resources leading development.

APAC is a dominant force, projected to contribute nearly 47% of the market's growth, driven by ambitious renewable energy infrastructure programs aimed at reaching peak carbon emissions.

In these areas, large-scale concentrated solar power plants featuring vast solar field installations of heliostats and receiver tube systems are common. These projects often integrate molten salt for thermal storage, ensuring grid connection and the supply of high-temperature heat generation.

The development of a robust solar manufacturing ecosystem further supports this expansion, facilitating the production of components for renewable power generation and solidifying the region's central role in the industry's future.

Market Dynamics

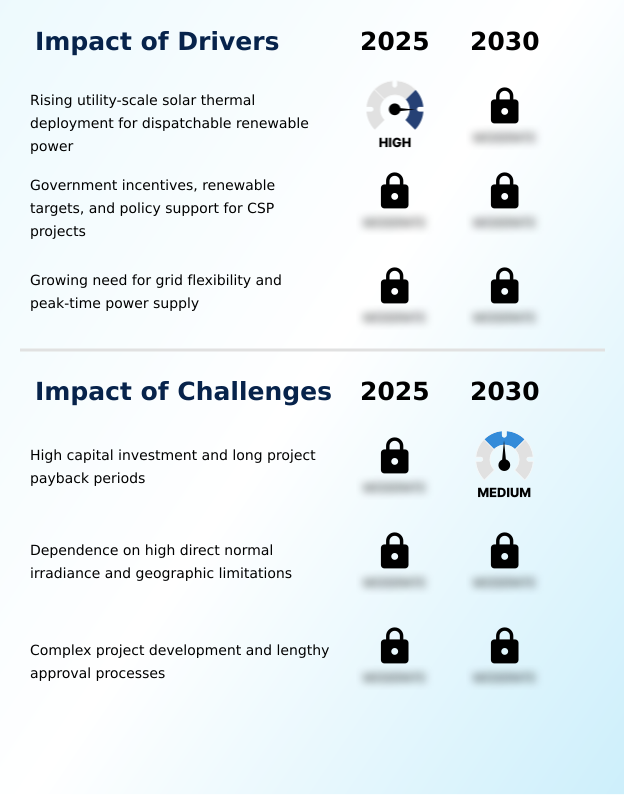
Our researchers analyzed the data with 2025 as the base year, along with the key drivers, trends, and challenges. A holistic analysis of drivers will help companies refine their marketing strategies to gain a competitive advantage.

  • Strategic decisions in the concentrating solar collectors market are increasingly complex, weighing the benefits of solar thermal energy against operational hurdles. A key consideration is the growing viability of concentrating solar for industrial heat, which diversifies revenue beyond electricity sales. When evaluating technologies, the parabolic trough vs linear fresnel debate continues, with choices depending on project scale and cost targets.
  • The integration of CSP with thermal energy storage is becoming standard for ensuring dispatchable power from solar thermal, a critical factor for grid integration of CSP plants. This capability is particularly vital for high-DNI concentrating solar projects, where maximizing output is paramount.
  • Applications are also expanding, with significant interest in the solar thermal for desalination process and the potential for CSP for green hydrogen production. However, challenges in CSP plant operation, such as water consumption in CSP plants, require innovative solutions.
  • The future of concentrating solar power will depend on reducing the levelized cost of electricity for CSP, which remains higher than some alternatives. Optimizing tracking systems for solar collectors and developing viable CSP project financing models are crucial for improving concentrating solar collector efficiency and market competitiveness.
  • Other emerging areas include hybrid CSP-PV plant design and solar thermal district heating systems, which reflect the broadening industrial applications of solar thermal and the continuous innovation in molten salt technology in CSP.

What are the key market drivers leading to the rise in the adoption of Concentrating Solar Collectors Industry?

  • The growing deployment of utility-scale solar thermal systems for generating dispatchable renewable power serves as a primary driver for market expansion.

  • The primary market driver is the critical need for dispatchable power to ensure grid stability and energy security, a demand that utility-scale solar thermal plants are uniquely positioned to meet.
  • Large-scale solar thermal plants equipped with molten salt storage systems can provide continuous electricity for over eight hours after sunset, a capability that intermittent renewables lack.
  • This feature enhances grid flexibility and supports reliable power delivery, with advanced thermal systems achieving over 99% operational uptime.
  • The deployment of solar power tower projects using molten salt receiver technology in regions with high direct solar irradiation is accelerating, driven by government policies promoting dispatchable power generation.
  • This focus on utility-scale CSP projects is central to expanding the role of solar thermal in the global energy mix.

What are the market trends shaping the Concentrating Solar Collectors Industry?

  • The increasing utilization of concentrating solar collectors for industrial process heat applications is a significant emerging trend. This development addresses the industrial sector's need for reliable, low-carbon thermal energy solutions.

  • An emergent trend is the expanded use of concentrating solar technologies for industrial process heat applications, moving beyond traditional power generation. Industries are adopting these systems as renewable heat sources to achieve decarbonization commitments, with some pilot projects demonstrating a reduction in fossil fuel reliance by over 50%.
  • This shift leverages concentrating solar collectors' ability to deliver consistent, high-temperature thermal energy, which is essential for sectors like mining and chemicals. Deployments of linear fresnel and solar air heating systems are increasing, valued for their efficient thermal absorption.
  • This trend is creating new opportunities for csp project development and strengthening the solar value chain, supported by long-term power purchase agreements that secure project financing and promote sustainable fuel production.

What challenges does the Concentrating Solar Collectors Industry face during its growth?

  • High capital investment requirements and extended project payback periods present a key challenge that can impede the market's growth trajectory.

  • A significant challenge remains the high capital investment required for concentrated solar power projects, which directly impacts the levelized cost of electricity. Upfront costs for concentrated solar thermal systems can be more than double those of solar photovoltaic installations, creating substantial financial hurdles and extending payback periods.
  • This cost disparity complicates efforts to secure financing, especially when competing with cheaper alternatives. While solar thermal solutions offer unique benefits, the solar thermal energy market must innovate to lower costs. The industry faces pressure from the rapid price declines in hybrid renewable portfolios combining PV with battery storage.
  • Consequently, developers are exploring water-efficient and dry cooling technologies to improve project economics and compete effectively under renewable portfolio standards.

Exclusive Technavio Analysis on Customer Landscape

The concentrating solar collectors market forecasting report includes the adoption lifecycle of the market, covering from the innovator’s stage to the laggard’s stage. It focuses on adoption rates in different regions based on penetration. Furthermore, the concentrating solar collectors market report also includes key purchase criteria and drivers of price sensitivity to help companies evaluate and develop their market growth analysis strategies.

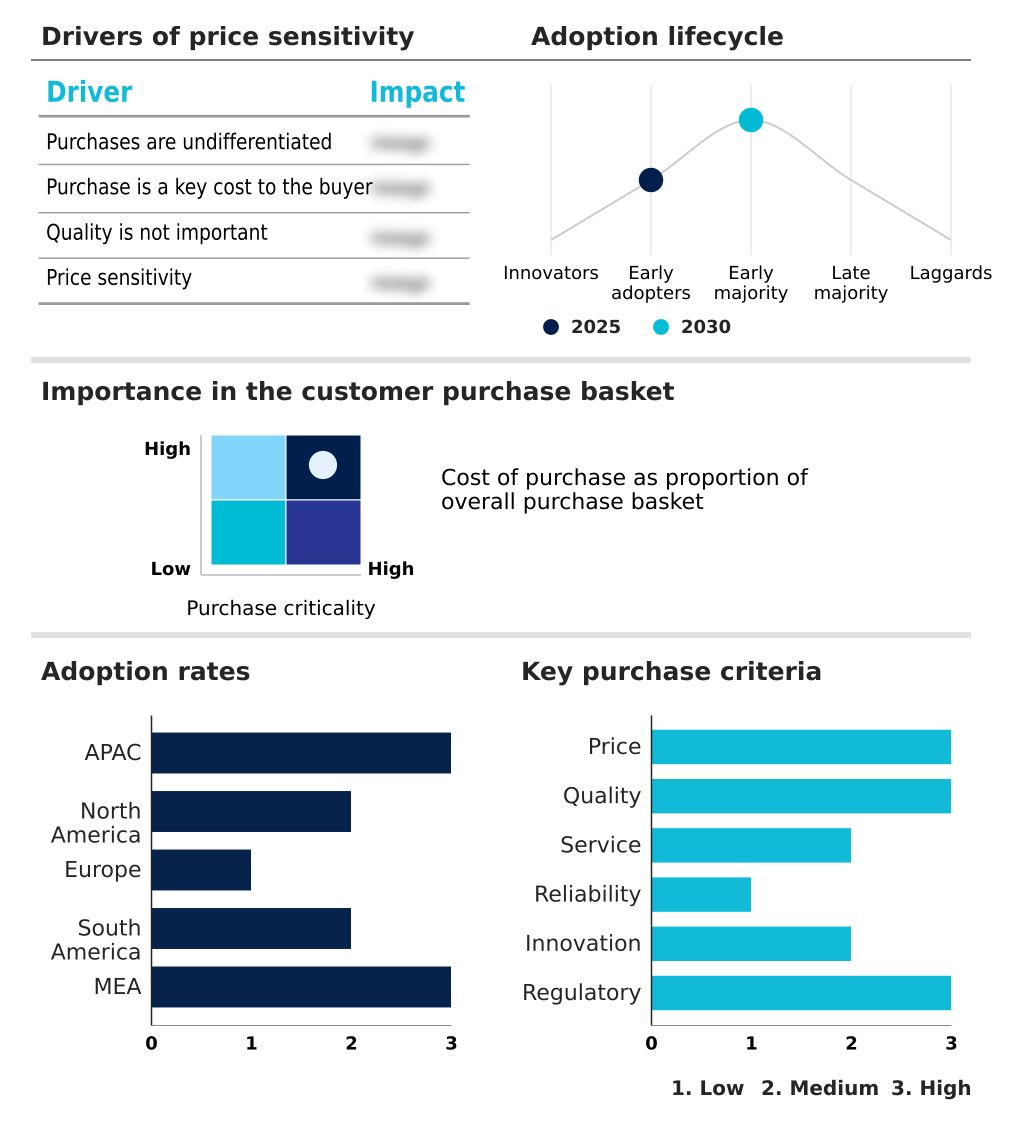
Customer Landscape of Concentrating Solar Collectors Industry

Competitive Landscape

Companies are implementing various strategies, such as strategic alliances, concentrating solar collectors market forecast, partnerships, mergers and acquisitions, geographical expansion, and product/service launches, to enhance their presence in the industry.

Ariston Holding NV - Offerings center on high-performance flat plate, evacuated tube, and concentrating solar collector systems designed for residential, commercial, and industrial thermal applications, including space heating and hot water production.

The industry research and growth report includes detailed analyses of the competitive landscape of the market and information about key companies, including:

  • Ariston Holding NV
  • Canadian Solar Inc.
  • Conserval Engineering Inc.
  • DIMAS SA
  • Grammer Solar
  • GREENoneTEC Solarindustrie
  • Himin Solar Co. Ltd.
  • Kingspan Group Plc
  • Nobel International EAD
  • Ritter Energiem
  • Sharp Corp.
  • Sunrain Group Co. Ltd
  • Sunshore Solar Energy Co Ltd
  • Trina Solar Co. Ltd.
  • Viessmann Climate Solutions

Qualitative and quantitative analysis of companies has been conducted to help clients understand the wider business environment as well as the strengths and weaknesses of key industry players. Data is qualitatively analyzed to categorize companies as pure play, category-focused, industry-focused, and diversified; it is quantitatively analyzed to categorize companies as dominant, leading, strong, tentative, and weak.

Recent Development and News in Concentrating solar collectors market

  • In March, 2025, the Xinjiang Tower Concentrated Solar Power project in China successfully passed a critical pre-commissioning hydraulic pressure test for its thermal system, marking a major milestone toward grid connection and commissioning.
  • In April, 2025, Vast Renewables' South Australia Solar Fuels project received USD 470,000 in funding through the Australia-Singapore Low Emissions Technologies initiative to advance the production of green methanol for decarbonizing the shipping sector.
  • In May, 2025, the Dubai Electricity and Water Authority announced that its Mohammed bin Rashid Al Maktoum Solar Park set a new world record for operating the highest-capacity single-operator concentrated solar power plant at 700 megawatts.
  • In April, 2025, TotalEnergies and the Oman Convention and Exhibition Centre commissioned a landmark rooftop solar PV project in Muscat, which is now operational and supplies approximately 25% of the venue's electricity needs.

Dive into Technavio’s robust research methodology, blending expert interviews, extensive data synthesis, and validated models for unparalleled Concentrating Solar Collectors Market insights. See full methodology.

Market Scope
Page number 283
Base year 2025
Historic period 2020-2024
Forecast period 2026-2030
Growth momentum & CAGR Accelerate at a CAGR of 11.2%
Market growth 2026-2030 USD 4237.8 million
Market structure Fragmented
YoY growth 2025-2026(%) 10.3%
Key countries China, India, Japan, South Korea, Australia, Indonesia, US, Canada, Mexico, Spain, Italy, France, Germany, Portugal, The Netherlands, Brazil, Chile, Argentina, South Africa, Saudi Arabia, UAE, Egypt and Morocco
Competitive landscape Leading Companies, Market Positioning of Companies, Competitive Strategies, and Industry Risks

Request Free Sample

Research Analyst Overview

  • The concentrating solar collectors market is defined by a continuous push toward improving the levelized cost of electricity and ensuring grid stability. Core technologies such as parabolic trough and linear fresnel systems, enhanced with single-axis tracking or dual-axis tracking, remain central to utility-scale solar thermal projects.
  • The strategic integration of thermal energy storage, often using molten salt in a dedicated thermal system, enables the delivery of dispatchable power, a key advantage over other renewables. This is achieved in a solar power tower or a solar field of heliostats, which concentrate energy onto a receiver tube containing heat transfer fluid.
  • One operational project successfully generates 25% of its host facility's energy needs, demonstrating viability. The market is also expanding into industrial process heat and process heat applications like thermal detoxification and green hydrogen production.
  • Advances in flat plate collectors and evacuated tube systems support these efforts, while deployments in areas with high direct solar irradiation, such as gobi desert land, underscore the importance of geography for achieving grid connection and peak-time power supply within hybrid renewable portfolios.

What are the Key Data Covered in this Concentrating Solar Collectors Market Research and Growth Report?

  • What is the expected growth of the Concentrating Solar Collectors Market between 2026 and 2030?

    • USD 4.24 billion, at a CAGR of 11.2%

  • What segmentation does the market report cover?

    • The report is segmented by End-user (Industrial, Commercial, and Residential), Type (Parabolic trough, Linear fresnel, and Others), Technology (Single-axis tracking systems, Fixed tilt systems, and Dual-axis tracking systems) and Geography (APAC, North America, Europe, South America, Middle East and Africa)

  • Which regions are analyzed in the report?

    • APAC, North America, Europe, South America and Middle East and Africa

  • What are the key growth drivers and market challenges?

    • Rising utility-scale solar thermal deployment for dispatchable renewable power, High capital investment and long project payback periods

  • Who are the major players in the Concentrating Solar Collectors Market?

    • Ariston Holding NV, Canadian Solar Inc., Conserval Engineering Inc., DIMAS SA, Grammer Solar, GREENoneTEC Solarindustrie, Himin Solar Co. Ltd., Kingspan Group Plc, Nobel International EAD, Ritter Energiem, Sharp Corp., Sunrain Group Co. Ltd, Sunshore Solar Energy Co Ltd, Trina Solar Co. Ltd. and Viessmann Climate Solutions

Market Research Insights

  • Market dynamics are increasingly shaped by the pursuit of dispatchable power generation and energy security, which favors concentrating solar technologies. The performance of these systems is influenced by regional factors, with certain geographic areas contributing over 45% of incremental growth, a rate almost double that of other key regions.
  • This disparity highlights the importance of local policy support and climate conditions. In project bidding environments, price sensitivity remains a high-impact factor for buyers, influencing technology selection and vendor negotiations.
  • At the same time, the integration of advanced thermal energy storage can improve project viability, enabling facilities to supply power for over eight hours post-sunset and enhancing their value proposition for grid operators.

We can help! Our analysts can customize this concentrating solar collectors market research report to meet your requirements.

Get in touch

1. Executive Summary

1.1 Market overview

Executive Summary - Chart on Market Overview
Executive Summary - Data Table on Market Overview
Executive Summary - Chart on Global Market Characteristics
Executive Summary - Chart on Market by Geography
Executive Summary - Chart on Market Segmentation by End-user
Executive Summary - Chart on Market Segmentation by Type
Executive Summary - Chart on Market Segmentation by Technology
Executive Summary - Chart on Incremental Growth
Executive Summary - Data Table on Incremental Growth
Executive Summary - Chart on Company Market Positioning

2. Technavio Analysis

2.1 Analysis of price sensitivity, lifecycle, customer purchase basket, adoption rates, and purchase criteria

2.2 Criticality of inputs and Factors of differentiation

Chart on Overview on criticality of inputs and factors of differentiation

2.3 Factors of disruption

Chart on Overview on factors of disruption

2.4 Impact of drivers and challenges

Chart on Impact of drivers and challenges in 2025 and 2030

3. Market Landscape

3.1 Market ecosystem

Chart on Parent Market
Data Table on - Parent Market

3.2 Market characteristics

Chart on Market characteristics analysis

3.3 Value chain analysis

Chart on Value chain analysis

4. Market Sizing

4.1 Market definition

Data Table on Offerings of companies included in the market definition

4.2 Market segment analysis

Market segments

4.3 Market size 2025

4.4 Market outlook: Forecast for 2025-2030

Chart on Global - Market size and forecast 2025-2030 ($ million)
Data Table on Global - Market size and forecast 2025-2030 ($ million)
Chart on Global Market: Year-over-year growth 2025-2030 (%)
Data Table on Global Market: Year-over-year growth 2025-2030 (%)

5. Historic Market Size

5.1 Global Concentrating Solar Collectors Market 2020 - 2024

Historic Market Size - Data Table on Global Concentrating Solar Collectors Market 2020 - 2024 ($ million)

5.2 End-user segment analysis 2020 - 2024

Historic Market Size - End-user Segment 2020 - 2024 ($ million)

5.3 Type segment analysis 2020 - 2024

Historic Market Size - Type Segment 2020 - 2024 ($ million)

5.4 Technology segment analysis 2020 - 2024

Historic Market Size - Technology Segment 2020 - 2024 ($ million)

5.5 Geography segment analysis 2020 - 2024

Historic Market Size - Geography Segment 2020 - 2024 ($ million)

5.6 Country segment analysis 2020 - 2024

Historic Market Size - Country Segment 2020 - 2024 ($ million)

6. Qualitative Analysis

6.1 The AI impact on Global Concentrating Solar Collectors Market

7. Five Forces Analysis

7.1 Five forces summary

Five forces analysis - Comparison between 2025 and 2030

7.2 Bargaining power of buyers

Bargaining power of buyers - Impact of key factors 2025 and 2030

7.3 Bargaining power of suppliers

Bargaining power of suppliers - Impact of key factors in 2025 and 2030

7.4 Threat of new entrants

Threat of new entrants - Impact of key factors in 2025 and 2030

7.5 Threat of substitutes

Threat of substitutes - Impact of key factors in 2025 and 2030

7.6 Threat of rivalry

Threat of rivalry - Impact of key factors in 2025 and 2030

7.7 Market condition

Chart on Market condition - Five forces 2025 and 2030

8. Market Segmentation by End-user

8.1 Market segments

Chart on End-user - Market share 2025-2030 (%)
Data Table on End-user - Market share 2025-2030 (%)

8.2 Comparison by End-user

Chart on Comparison by End-user
Data Table on Comparison by End-user

8.3 Industrial - Market size and forecast 2025-2030

Chart on Industrial - Market size and forecast 2025-2030 ($ million)
Data Table on Industrial - Market size and forecast 2025-2030 ($ million)
Chart on Industrial - Year-over-year growth 2025-2030 (%)
Data Table on Industrial - Year-over-year growth 2025-2030 (%)

8.4 Commercial - Market size and forecast 2025-2030

Chart on Commercial - Market size and forecast 2025-2030 ($ million)
Data Table on Commercial - Market size and forecast 2025-2030 ($ million)
Chart on Commercial - Year-over-year growth 2025-2030 (%)
Data Table on Commercial - Year-over-year growth 2025-2030 (%)

8.5 Residential - Market size and forecast 2025-2030

Chart on Residential - Market size and forecast 2025-2030 ($ million)
Data Table on Residential - Market size and forecast 2025-2030 ($ million)
Chart on Residential - Year-over-year growth 2025-2030 (%)
Data Table on Residential - Year-over-year growth 2025-2030 (%)

8.6 Market opportunity by End-user

Market opportunity by End-user ($ million)
Data Table on Market opportunity by End-user ($ million)

9. Market Segmentation by Type

9.1 Market segments

Chart on Type - Market share 2025-2030 (%)
Data Table on Type - Market share 2025-2030 (%)

9.2 Comparison by Type

Chart on Comparison by Type
Data Table on Comparison by Type

9.3 Parabolic trough - Market size and forecast 2025-2030

Chart on Parabolic trough - Market size and forecast 2025-2030 ($ million)
Data Table on Parabolic trough - Market size and forecast 2025-2030 ($ million)
Chart on Parabolic trough - Year-over-year growth 2025-2030 (%)
Data Table on Parabolic trough - Year-over-year growth 2025-2030 (%)

9.4 Linear fresnel - Market size and forecast 2025-2030

Chart on Linear fresnel - Market size and forecast 2025-2030 ($ million)
Data Table on Linear fresnel - Market size and forecast 2025-2030 ($ million)
Chart on Linear fresnel - Year-over-year growth 2025-2030 (%)
Data Table on Linear fresnel - Year-over-year growth 2025-2030 (%)

9.5 Others - Market size and forecast 2025-2030

Chart on Others - Market size and forecast 2025-2030 ($ million)
Data Table on Others - Market size and forecast 2025-2030 ($ million)
Chart on Others - Year-over-year growth 2025-2030 (%)
Data Table on Others - Year-over-year growth 2025-2030 (%)

9.6 Market opportunity by Type

Market opportunity by Type ($ million)
Data Table on Market opportunity by Type ($ million)

10. Market Segmentation by Technology

10.1 Market segments

Chart on Technology - Market share 2025-2030 (%)
Data Table on Technology - Market share 2025-2030 (%)

10.2 Comparison by Technology

Chart on Comparison by Technology
Data Table on Comparison by Technology

10.3 Single-axis tracking systems - Market size and forecast 2025-2030

Chart on Single-axis tracking systems - Market size and forecast 2025-2030 ($ million)
Data Table on Single-axis tracking systems - Market size and forecast 2025-2030 ($ million)
Chart on Single-axis tracking systems - Year-over-year growth 2025-2030 (%)
Data Table on Single-axis tracking systems - Year-over-year growth 2025-2030 (%)

10.4 Fixed tilt systems - Market size and forecast 2025-2030

Chart on Fixed tilt systems - Market size and forecast 2025-2030 ($ million)
Data Table on Fixed tilt systems - Market size and forecast 2025-2030 ($ million)
Chart on Fixed tilt systems - Year-over-year growth 2025-2030 (%)
Data Table on Fixed tilt systems - Year-over-year growth 2025-2030 (%)

10.5 Dual-axis tracking systems - Market size and forecast 2025-2030

Chart on Dual-axis tracking systems - Market size and forecast 2025-2030 ($ million)
Data Table on Dual-axis tracking systems - Market size and forecast 2025-2030 ($ million)
Chart on Dual-axis tracking systems - Year-over-year growth 2025-2030 (%)
Data Table on Dual-axis tracking systems - Year-over-year growth 2025-2030 (%)

10.6 Market opportunity by Technology

Market opportunity by Technology ($ million)
Data Table on Market opportunity by Technology ($ million)

11. Customer Landscape

11.1 Customer landscape overview

Analysis of price sensitivity, lifecycle, customer purchase basket, adoption rates, and purchase criteria

12. Geographic Landscape

12.1 Geographic segmentation

Chart on Market share by geography 2025-2030 (%)
Data Table on Market share by geography 2025-2030 (%)

12.2 Geographic comparison

Chart on Geographic comparison
Data Table on Geographic comparison

12.3 APAC - Market size and forecast 2025-2030

Chart on APAC - Market size and forecast 2025-2030 ($ million)
Data Table on APAC - Market size and forecast 2025-2030 ($ million)
Chart on APAC - Year-over-year growth 2025-2030 (%)
Data Table on APAC - Year-over-year growth 2025-2030 (%)
Chart on Regional Comparison - APAC
Data Table on Regional Comparison - APAC

12.3.1 China - Market size and forecast 2025-2030

Chart on China - Market size and forecast 2025-2030 ($ million)
Data Table on China - Market size and forecast 2025-2030 ($ million)
Chart on China - Year-over-year growth 2025-2030 (%)
Data Table on China - Year-over-year growth 2025-2030 (%)

12.3.2 India - Market size and forecast 2025-2030

Chart on India - Market size and forecast 2025-2030 ($ million)
Data Table on India - Market size and forecast 2025-2030 ($ million)
Chart on India - Year-over-year growth 2025-2030 (%)
Data Table on India - Year-over-year growth 2025-2030 (%)

12.3.3 Japan - Market size and forecast 2025-2030

Chart on Japan - Market size and forecast 2025-2030 ($ million)
Data Table on Japan - Market size and forecast 2025-2030 ($ million)
Chart on Japan - Year-over-year growth 2025-2030 (%)
Data Table on Japan - Year-over-year growth 2025-2030 (%)

12.3.4 South Korea - Market size and forecast 2025-2030

Chart on South Korea - Market size and forecast 2025-2030 ($ million)
Data Table on South Korea - Market size and forecast 2025-2030 ($ million)
Chart on South Korea - Year-over-year growth 2025-2030 (%)
Data Table on South Korea - Year-over-year growth 2025-2030 (%)

12.3.5 Australia - Market size and forecast 2025-2030

Chart on Australia - Market size and forecast 2025-2030 ($ million)
Data Table on Australia - Market size and forecast 2025-2030 ($ million)
Chart on Australia - Year-over-year growth 2025-2030 (%)
Data Table on Australia - Year-over-year growth 2025-2030 (%)

12.3.6 Indonesia - Market size and forecast 2025-2030

Chart on Indonesia - Market size and forecast 2025-2030 ($ million)
Data Table on Indonesia - Market size and forecast 2025-2030 ($ million)
Chart on Indonesia - Year-over-year growth 2025-2030 (%)
Data Table on Indonesia - Year-over-year growth 2025-2030 (%)

12.4 North America - Market size and forecast 2025-2030

Chart on North America - Market size and forecast 2025-2030 ($ million)
Data Table on North America - Market size and forecast 2025-2030 ($ million)
Chart on North America - Year-over-year growth 2025-2030 (%)
Data Table on North America - Year-over-year growth 2025-2030 (%)
Chart on Regional Comparison - North America
Data Table on Regional Comparison - North America

12.4.1 US - Market size and forecast 2025-2030

Chart on US - Market size and forecast 2025-2030 ($ million)
Data Table on US - Market size and forecast 2025-2030 ($ million)
Chart on US - Year-over-year growth 2025-2030 (%)
Data Table on US - Year-over-year growth 2025-2030 (%)

12.4.2 Canada - Market size and forecast 2025-2030

Chart on Canada - Market size and forecast 2025-2030 ($ million)
Data Table on Canada - Market size and forecast 2025-2030 ($ million)
Chart on Canada - Year-over-year growth 2025-2030 (%)
Data Table on Canada - Year-over-year growth 2025-2030 (%)

12.4.3 Mexico - Market size and forecast 2025-2030

Chart on Mexico - Market size and forecast 2025-2030 ($ million)
Data Table on Mexico - Market size and forecast 2025-2030 ($ million)
Chart on Mexico - Year-over-year growth 2025-2030 (%)
Data Table on Mexico - Year-over-year growth 2025-2030 (%)

12.5 Europe - Market size and forecast 2025-2030

Chart on Europe - Market size and forecast 2025-2030 ($ million)
Data Table on Europe - Market size and forecast 2025-2030 ($ million)
Chart on Europe - Year-over-year growth 2025-2030 (%)
Data Table on Europe - Year-over-year growth 2025-2030 (%)
Chart on Regional Comparison - Europe
Data Table on Regional Comparison - Europe

12.5.1 Spain - Market size and forecast 2025-2030

Chart on Spain - Market size and forecast 2025-2030 ($ million)
Data Table on Spain - Market size and forecast 2025-2030 ($ million)
Chart on Spain - Year-over-year growth 2025-2030 (%)
Data Table on Spain - Year-over-year growth 2025-2030 (%)

12.5.2 Italy - Market size and forecast 2025-2030

Chart on Italy - Market size and forecast 2025-2030 ($ million)
Data Table on Italy - Market size and forecast 2025-2030 ($ million)
Chart on Italy - Year-over-year growth 2025-2030 (%)
Data Table on Italy - Year-over-year growth 2025-2030 (%)

12.5.3 France - Market size and forecast 2025-2030

Chart on France - Market size and forecast 2025-2030 ($ million)
Data Table on France - Market size and forecast 2025-2030 ($ million)
Chart on France - Year-over-year growth 2025-2030 (%)
Data Table on France - Year-over-year growth 2025-2030 (%)

12.5.4 Germany - Market size and forecast 2025-2030

Chart on Germany - Market size and forecast 2025-2030 ($ million)
Data Table on Germany - Market size and forecast 2025-2030 ($ million)
Chart on Germany - Year-over-year growth 2025-2030 (%)
Data Table on Germany - Year-over-year growth 2025-2030 (%)

12.5.5 Portugal - Market size and forecast 2025-2030

Chart on Portugal - Market size and forecast 2025-2030 ($ million)
Data Table on Portugal - Market size and forecast 2025-2030 ($ million)
Chart on Portugal - Year-over-year growth 2025-2030 (%)
Data Table on Portugal - Year-over-year growth 2025-2030 (%)

12.5.6 The Netherlands - Market size and forecast 2025-2030

Chart on The Netherlands - Market size and forecast 2025-2030 ($ million)
Data Table on The Netherlands - Market size and forecast 2025-2030 ($ million)
Chart on The Netherlands - Year-over-year growth 2025-2030 (%)
Data Table on The Netherlands - Year-over-year growth 2025-2030 (%)

12.6 South America - Market size and forecast 2025-2030

Chart on South America - Market size and forecast 2025-2030 ($ million)
Data Table on South America - Market size and forecast 2025-2030 ($ million)
Chart on South America - Year-over-year growth 2025-2030 (%)
Data Table on South America - Year-over-year growth 2025-2030 (%)
Chart on Regional Comparison - South America
Data Table on Regional Comparison - South America

12.6.1 Brazil - Market size and forecast 2025-2030

Chart on Brazil - Market size and forecast 2025-2030 ($ million)
Data Table on Brazil - Market size and forecast 2025-2030 ($ million)
Chart on Brazil - Year-over-year growth 2025-2030 (%)
Data Table on Brazil - Year-over-year growth 2025-2030 (%)

12.6.2 Chile - Market size and forecast 2025-2030

Chart on Chile - Market size and forecast 2025-2030 ($ million)
Data Table on Chile - Market size and forecast 2025-2030 ($ million)
Chart on Chile - Year-over-year growth 2025-2030 (%)
Data Table on Chile - Year-over-year growth 2025-2030 (%)

12.6.3 Argentina - Market size and forecast 2025-2030

Chart on Argentina - Market size and forecast 2025-2030 ($ million)
Data Table on Argentina - Market size and forecast 2025-2030 ($ million)
Chart on Argentina - Year-over-year growth 2025-2030 (%)
Data Table on Argentina - Year-over-year growth 2025-2030 (%)

12.7 Middle East and Africa - Market size and forecast 2025-2030

Chart on Middle East and Africa - Market size and forecast 2025-2030 ($ million)
Data Table on Middle East and Africa - Market size and forecast 2025-2030 ($ million)
Chart on Middle East and Africa - Year-over-year growth 2025-2030 (%)
Data Table on Middle East and Africa - Year-over-year growth 2025-2030 (%)
Chart on Regional Comparison - Middle East and Africa
Data Table on Regional Comparison - Middle East and Africa

12.7.1 South Africa - Market size and forecast 2025-2030

Chart on South Africa - Market size and forecast 2025-2030 ($ million)
Data Table on South Africa - Market size and forecast 2025-2030 ($ million)
Chart on South Africa - Year-over-year growth 2025-2030 (%)
Data Table on South Africa - Year-over-year growth 2025-2030 (%)

12.7.2 Saudi Arabia - Market size and forecast 2025-2030

Chart on Saudi Arabia - Market size and forecast 2025-2030 ($ million)
Data Table on Saudi Arabia - Market size and forecast 2025-2030 ($ million)
Chart on Saudi Arabia - Year-over-year growth 2025-2030 (%)
Data Table on Saudi Arabia - Year-over-year growth 2025-2030 (%)

12.7.3 UAE - Market size and forecast 2025-2030

Chart on UAE - Market size and forecast 2025-2030 ($ million)
Data Table on UAE - Market size and forecast 2025-2030 ($ million)
Chart on UAE - Year-over-year growth 2025-2030 (%)
Data Table on UAE - Year-over-year growth 2025-2030 (%)

12.7.4 Egypt - Market size and forecast 2025-2030

Chart on Egypt - Market size and forecast 2025-2030 ($ million)
Data Table on Egypt - Market size and forecast 2025-2030 ($ million)
Chart on Egypt - Year-over-year growth 2025-2030 (%)
Data Table on Egypt - Year-over-year growth 2025-2030 (%)

12.7.5 Morocco - Market size and forecast 2025-2030

Chart on Morocco - Market size and forecast 2025-2030 ($ million)
Data Table on Morocco - Market size and forecast 2025-2030 ($ million)
Chart on Morocco - Year-over-year growth 2025-2030 (%)
Data Table on Morocco - Year-over-year growth 2025-2030 (%)

12.8 Market opportunity by geography

Market opportunity by geography ($ million)
Data Tables on Market opportunity by geography ($ million)

13. Drivers, Challenges, and Opportunity

13.1 Market drivers

Rising utility-scale solar thermal deployment for dispatchable renewable power
Government incentives, renewable targets, and policy support for CSP projects
Growing need for grid flexibility and peak-time power supply

13.2 Market challenges

High capital investment and long project payback periods
Dependence on high direct normal irradiance and geographic limitations
Complex project development and lengthy approval processes

13.3 Impact of drivers and challenges

Impact of drivers and challenges in 2025 and 2030

13.4 Market opportunities

Rising use of concentrating solar collectors for industrial process heat applications
Increased focus on dry cooling and water-efficient CSP technologies
Expansion of CSP projects in high-DNI emerging and developing regions

14. Competitive Landscape

14.1 Overview

14.2

Overview on criticality of inputs and factors of differentiation

14.3 Landscape disruption

Overview on factors of disruption

14.4 Industry risks

Impact of key risks on business

15. Competitive Analysis

15.1 Companies profiled

Companies covered

15.2 Company ranking index

15.3 Market positioning of companies

Matrix on companies position and classification

15.4 Ariston Holding NV

Ariston Holding NV - Overview
Ariston Holding NV - Business segments
Ariston Holding NV - Key offerings
Ariston Holding NV - Segment focus
SWOT

15.5 Canadian Solar Inc.

Canadian Solar Inc. - Overview
Canadian Solar Inc. - Business segments
Canadian Solar Inc. - Key news
Canadian Solar Inc. - Key offerings
Canadian Solar Inc. - Segment focus
SWOT

15.6 Conserval Engineering Inc.

Conserval Engineering Inc. - Overview
Conserval Engineering Inc. - Product / Service
Conserval Engineering Inc. - Key offerings
SWOT

15.7 DIMAS SA

DIMAS SA - Overview
DIMAS SA - Product / Service
DIMAS SA - Key offerings
SWOT

15.8 Grammer Solar

Grammer Solar - Overview
Grammer Solar - Product / Service
Grammer Solar - Key offerings
SWOT

15.9 GREENoneTEC Solarindustrie

GREENoneTEC Solarindustrie - Overview
GREENoneTEC Solarindustrie - Product / Service
GREENoneTEC Solarindustrie - Key offerings
SWOT

15.10 Himin Solar Co. Ltd.

Himin Solar Co. Ltd. - Overview
Himin Solar Co. Ltd. - Product / Service
Himin Solar Co. Ltd. - Key offerings
SWOT

15.11 Kingspan Group Plc

Kingspan Group Plc - Overview
Kingspan Group Plc - Business segments
Kingspan Group Plc - Key offerings
Kingspan Group Plc - Segment focus
SWOT

15.12 Nobel International EAD

Nobel International EAD - Overview
Nobel International EAD - Product / Service
Nobel International EAD - Key offerings
SWOT

15.13 Ritter Energiem

Ritter Energiem - Overview
Ritter Energiem - Product / Service
Ritter Energiem - Key offerings
SWOT

15.14 Sharp Corp.

Sharp Corp. - Overview
Sharp Corp. - Business segments
Sharp Corp. - Key news
Sharp Corp. - Key offerings
Sharp Corp. - Segment focus
SWOT

15.15 Sunrain Group Co. Ltd

Sunrain Group Co. Ltd - Overview
Sunrain Group Co. Ltd - Product / Service
Sunrain Group Co. Ltd - Key offerings
SWOT

15.16 Sunshore Solar Energy Co Ltd

Sunshore Solar Energy Co Ltd - Overview
Sunshore Solar Energy Co Ltd - Product / Service
Sunshore Solar Energy Co Ltd - Key offerings
SWOT

15.17 Trina Solar Co. Ltd.

Trina Solar Co. Ltd. - Overview
Trina Solar Co. Ltd. - Product / Service
Trina Solar Co. Ltd. - Key news
Trina Solar Co. Ltd. - Key offerings
SWOT

15.18 Viessmann Climate Solutions

Viessmann Climate Solutions - Overview
Viessmann Climate Solutions - Product / Service
Viessmann Climate Solutions - Key offerings
SWOT

16. Appendix

16.1 Scope of the report

Market definition
Objectives
Notes and caveats

16.2 Inclusions and exclusions checklist

Inclusions checklist
Exclusions checklist

16.3 Currency conversion rates for US$

16.4 Research methodology

16.5 Data procurement

Information sources

16.6 Data validation

16.7 Validation techniques employed for market sizing

16.8 Data synthesis

16.9 360 degree market analysis

16.10 List of abbreviations

Research Methodology

Technavio presents a detailed picture of the market by way of study, synthesis, and summation of data from multiple sources. The analysts have presented the various facets of the market with a particular focus on identifying the key industry influencers. The data thus presented is comprehensive, reliable, and the result of extensive research, both primary and secondary.

INFORMATION SOURCES

Primary sources

  • Manufacturers and suppliers
  • Channel partners
  • Industry experts
  • Strategic decision makers

Secondary sources

  • Industry journals and periodicals
  • Government data
  • Financial reports of key industry players
  • Historical data
  • Press releases

DATA ANALYSIS

Data Synthesis

  • Collation of data
  • Estimation of key figures
  • Analysis of derived insights

Data Validation

  • Triangulation with data models
  • Reference against proprietary databases
  • Corroboration with industry experts

REPORT WRITING

Qualitative

  • Market drivers
  • Market challenges
  • Market trends
  • Five forces analysis

Quantitative

  • Market size and forecast
  • Market segmentation
  • Geographical insights
  • Competitive landscape

Interested in this report?

Get your sample now to see our research methodology and insights!

Download Now

Frequently Asked Questions

Concentrating Solar Collectors market growth will increase by USD 4237.8 million during 2026-2030.

The Concentrating Solar Collectors market is expected to grow at a CAGR of 11.2% during 2026-2030.

Concentrating Solar Collectors market is segmented by End-user (Industrial, Commercial, Residential) Type (Parabolic trough, Linear fresnel, Others) Technology (Single-axis tracking systems, Fixed tilt systems, Dual-axis tracking systems)

Ariston Holding NV, Canadian Solar Inc., Conserval Engineering Inc., DIMAS SA, Grammer Solar, GREENoneTEC Solarindustrie, Himin Solar Co. Ltd., Kingspan Group Plc, Nobel International EAD, Ritter Energiem, Sharp Corp., Sunrain Group Co. Ltd, Sunshore Solar Energy Co Ltd, Trina Solar Co. Ltd., Viessmann Climate Solutions are a few of the key vendors in the Concentrating Solar Collectors market.

APAC will register the highest growth rate of 46.3% among the other regions. Therefore, the Concentrating Solar Collectors market in APAC is expected to garner significant business opportunities for the vendors during the forecast period.

China, India, Japan, South Korea, Australia, Indonesia, US, Canada, Mexico, Spain, Italy, France, Germany, Portugal, The Netherlands, Brazil, Chile, Argentina, South Africa, Saudi Arabia, UAE, Egypt, Morocco

  • Rising utility-scale solar thermal deployment for dispatchable renewable power is the driving factor this market.

The Concentrating Solar Collectors market vendors should focus on grabbing business opportunities from the End-user segment as it accounted for the largest market share in the base year.