Cloud Kitchen Market Analysis APAC, North America, Europe, South America, Middle East and Africa - China, US, Japan, India, South Korea, Canada, UK, Germany, France, Brazil - Size and Forecast 2025-2029

Cloud Kitchen Market Analysis APAC, North America, Europe, South America, Middle East and Africa - China, US, Japan, India, South Korea, Canada, UK, Germany, France, Brazil - Size and Forecast 2025-2029

Published: Mar 2025 216 Pages SKU: IRTNTR45475

Market Overview at a Glance

$97.15 B
Market Opportunity
20.5%
CAGR
16.6
YoY growth 2024-2025(%)

Cloud Kitchen Market Size 2025-2029

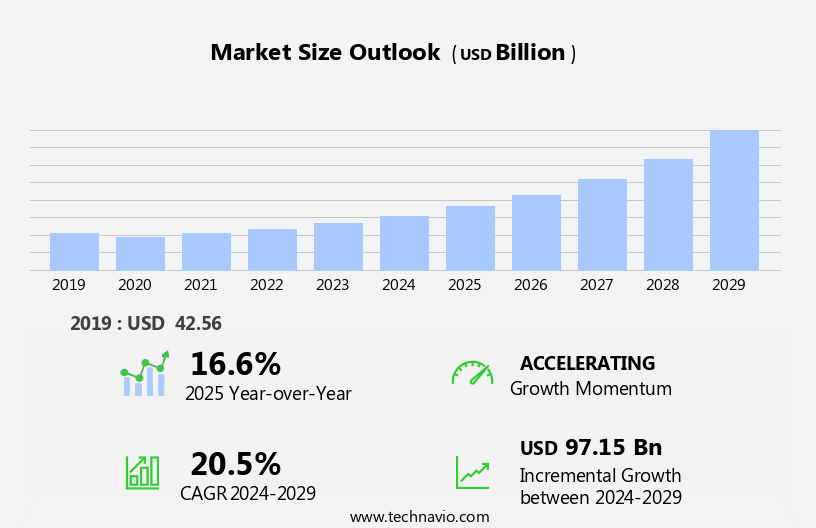
The cloud kitchen market size is forecast to increase by USD 97.15 billion, at a CAGR of 20.5% between 2024 and 2029.

  • The market is experiencing significant growth, driven by the advantages it offers over traditional restaurants. One of the key factors fueling this trend is the increasing demand for home-cooked food, which cloud kitchens cater to effectively by focusing solely on delivery. Another significant driver is the new packaging solutions designed specifically for food delivery, ensuring that meals arrive at customers' doors in optimal condition. However, the market also faces challenges. Regulations and permits for setting up and operating cloud kitchens vary widely, posing operational complexities. Additionally, ensuring consistent food quality across multiple delivery orders can be a challenge due to the lack of direct interaction with customers.
  • To navigate these obstacles, companies must stay informed of local regulations and invest in robust quality control systems. By capitalizing on the market's growth potential and addressing these challenges effectively, players in the cloud kitchen industry can successfully cater to the increasing demand for convenient, high-quality meal options.

What will be the Size of the Cloud Kitchen Market during the forecast period?

Cloud Kitchen Market Size

Explore in-depth regional segment analysis with market size data - historical 2019-2023 and forecasts 2025-2029 - in the full report.  
Request Free Sample

Cloud kitchens, an innovative business model in the food industry, continue to evolve and adapt to market dynamics. These kitchens, designed for preparing meals for delivery and takeout orders, integrate various components to ensure operational efficiency and customer satisfaction. Food costing is a critical aspect, requiring constant monitoring to maintain profitability. Packaging solutions, sustainable and hygienic, protect food during transportation and enhance the brand image. Data analytics and online ordering systems facilitate sales forecasting and inventory management, while POS systems streamline order fulfillment. Kitchen equipment leasing and kitchen design are essential for operational efficiency, with shared commercial kitchens offering cost savings.

Marketing strategies, including social media marketing and food delivery platforms, expand customer reach. Insurance coverage, a necessary component, mitigates risks. Food preparation adheres to health inspections and food safety regulations, while brand loyalty is fostered through customer service and brand development. Delivery optimization, including driver management and delivery packaging, ensures timely and quality delivery. Food waste reduction is a continuous focus, achieved through ingredient sourcing and supply chain management. Staffing solutions, from kitchen staff training to permitting and licensing, ensure a skilled workforce. Menu optimization, pricing strategies, and review management maintain customer satisfaction and brand reputation. Technology integration, including AI-powered order prediction and kitchen automation, enhances operational efficiency and customer experience.

Hygiene standards, energy efficiency, and risk management are ongoing concerns, addressed through continuous improvement and innovation.

How is this Cloud Kitchen Industry segmented?

The cloud kitchen industry research report provides comprehensive data (region-wise segment analysis), with forecasts and estimates in "USD billion" for the period 2025-2029, as well as historical data from 2019-2023 for the following segments.

  • Type
    • Franchised
    • Standalone
  • Product
    • Independent cloud kitchen
    • Commissary/shared kitchen
    • Kitchen pods
  • End-user
    • B2B
    • B2C
    • Food delivery platforms
  • Geography
    • North America
      • US
      • Canada
    • Europe
      • France
      • Germany
      • UK
    • APAC
      • China
      • India
      • Japan
      • South Korea
    • South America
      • Brazil
    • Rest of World (ROW)

By Type Insights

The franchised segment is estimated to witness significant growth during the forecast period.

Cloud kitchens, commercial facilities designed for food production solely for delivery, have gained traction due to the increasing popularity of online food ordering. These kitchens accommodate various food brands under one roof, expanding their reach without the necessity of investing in costly real estate and traditional dining arrangements. Franchise agreements between major restaurant operators and cloud kitchens enable the sale of food products from multiple brands. The cloud kitchen model offers operational efficiency through shared commercial kitchen spaces and inventory management systems. Kitchen staff training, customer service, and menu engineering are crucial for maintaining brand loyalty and positive customer feedback.

Food safety regulations, health inspections, and insurance coverage ensure the quality and safety of the food products. Local sourcing and sustainable packaging align with consumer preferences for eco-friendly practices. Sales forecasting and AI-powered order prediction optimize delivery and reduce food waste. The integration of restaurant management software, permitting and licensing, and technology solutions streamline operations and enhance brand reputation. Virtual and delivery-only kitchens, risk management, and menu optimization are key trends in the evolving the market.

Cloud Kitchen Market Size

Request Free Sample

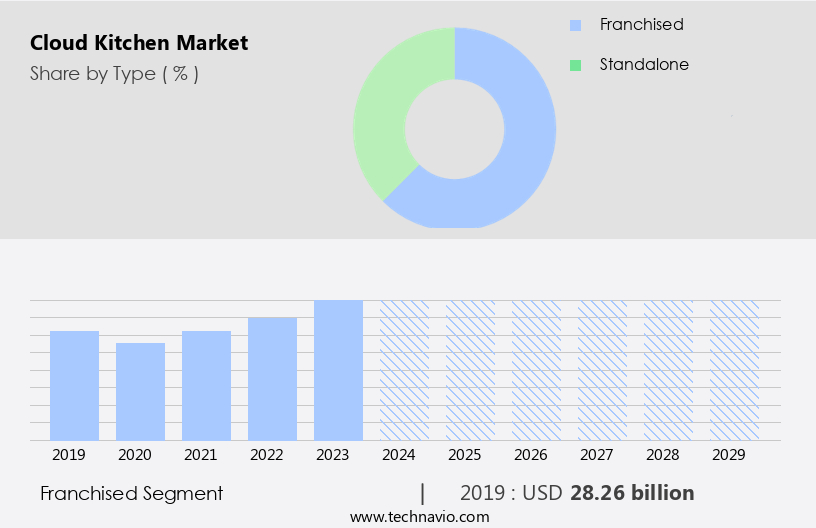
The Franchised segment was valued at USD 28.26 billion in 2019 and showed a gradual increase during the forecast period.

Regional Analysis

APAC is estimated to contribute 63% to the growth of the global market during the forecast period.Technavio's analysts have elaborately explained the regional trends and drivers that shape the market during the forecast period.

Cloud Kitchen Market Share by Geography

 Request Free Sample

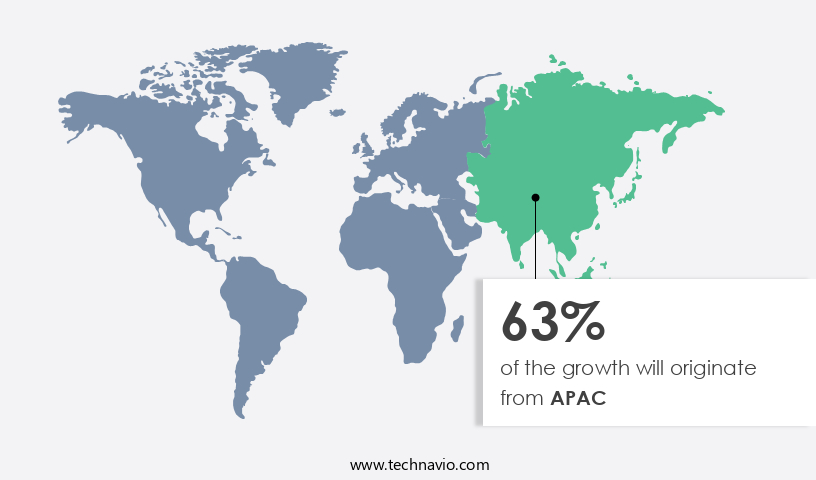
In the dynamic food industry, cloud kitchens are gaining significant traction, particularly in the Asia Pacific (APAC) region. The rise of busy lifestyles and urbanization has led to an increasing preference for convenience and speed, driving the demand for ready-to-eat meals. Traditional cuisines such as Indian, Thai, Japanese, and Chinese, as well as regional fast food, continue to be popular in APAC. However, the popularity of fast food is surging, leading to a growing demand for cloud kitchens. These centralized kitchens enable restaurants to prepare and deliver meals directly to customers, optimizing operational efficiency and reducing food waste.

Kitchen design plays a crucial role in cloud kitchens, with a focus on space utilization and food preparation technology. Inventory management is essential to ensure fresh ingredients and minimize spoilage. Food safety regulations are stringently enforced to maintain hygiene standards. Local sourcing and supply chain management are vital for maintaining quality and reducing delivery times. Franchise models and brand loyalty are essential for scaling up operations. Social media marketing and food delivery platforms are effective marketing strategies to reach a wider audience and increase customer acquisition. Sales forecasting and profitability analysis are critical for making informed business decisions.

Real estate acquisition and lease negotiations are essential for securing commercial kitchen space. Brand development and reputation are crucial for customer retention and repeat business. Customer feedback and review management are essential for continuous improvement and menu optimization. Menu engineering and food costing are critical for maintaining profitability. Packaging solutions and sustainable practices are essential for reducing waste and minimizing environmental impact. Risk management, kitchen automation, and delivery optimization are essential for ensuring operational efficiency and effective order fulfillment. Insurance coverage and driver management are crucial for mitigating risks and ensuring reliable delivery. Food quality control and customer service are essential for maintaining customer satisfaction and loyalty.

In conclusion, the market is witnessing significant growth in APAC due to changing consumer preferences and lifestyles. The market's evolution is driven by various factors, including kitchen design, inventory management, food safety regulations, franchise models, local sourcing, and marketing strategies. Profitability analysis, brand development, and operational efficiency are essential for success in this competitive market.

Market Dynamics

Our researchers analyzed the data with 2024 as the base year, along with the key drivers, trends, and challenges. A holistic analysis of drivers will help companies refine their marketing strategies to gain a competitive advantage.

In the dynamic and evolving food industry, the market has emerged as a game-changer. This innovative business model allows restaurants to prepare and deliver meals directly to customers without the need for a traditional brick-and-mortar location. Cloud kitchens, also known as ghost or dark kitchens, leverage technology to streamline operations and optimize delivery. They offer cost savings through reduced overhead, increased efficiency, and the ability to cater to multiple virtual brands under one roof. The market is fueled by the growing demand for convenience, affordability, and personalized food experiences. It also benefits from advancements in food delivery apps, contactless ordering, and the rise of third-party delivery services. This market trend continues to disrupt the traditional restaurant landscape, offering opportunities for entrepreneurs, investors, and food industry professionals.

What are the key market drivers leading to the rise in the adoption of Cloud Kitchen Industry?

  • The primary factor fueling market growth is the advantages that cloud kitchens hold over traditional restaurants, including lower operational costs, increased efficiency, and the ability to cater to the growing demand for food delivery services
  • Cloud kitchens, also known as delivery-only kitchens or ghost kitchens, are gaining popularity in the food industry due to the growing demand for convenient and contactless food solutions. These kitchens are designed specifically for preparing meals for online food delivery services, lacking a traditional dining area. The business model offers several advantages, making it an attractive option for entrepreneurs. One significant advantage is the reduced operating costs. Opening a cloud kitchen incurs lower expenses than starting a traditional restaurant, with monthly rent ranging from USD2,000 to USD4,000, depending on the market. By eliminating the need for a dining area and focusing solely on food preparation, businesses can save on rent, utilities, and labor costs associated with front-of-house operations.
  • Another advantage is the increased efficiency in customer acquisition and delivery optimization. Social media marketing and partnerships with food delivery platforms are effective marketing strategies for reaching a target audience. Insurance coverage, staffing solutions, and supply chain management are essential aspects that can be streamlined through shared commercial kitchens. Food waste reduction is also a priority, with recipe development and ingredient sourcing playing crucial roles in minimizing waste and maintaining profitability. Lease negotiations and shared kitchen spaces enable businesses to focus on their core competencies while reducing overhead costs. Overall, cloud kitchens offer a profitable business model for entrepreneurs looking to capitalize on the growing demand for food delivery services.

What are the market trends shaping the Cloud Kitchen Industry?

  • The emerging market trend involves the adoption of new packaging for food delivery services. This innovation aims to enhance the consumer experience and ensure the safe transportation of foods.
  • In the market, packaging plays a crucial role in enhancing brand value. Innovative packaging solutions, such as biodegradable and compostable options, are gaining traction due to their sustainability. Corrugated packaging, specifically, has been successful in generating interest with its thermal properties, which keep food hot during delivery, and its protected fluting material that maintains food freshness and prevents spills. Recyclable corrugated layered board trays are increasingly popular for items like fish sticks and French fries. Restaurant management software is essential for managing permitting and licensing, cooking technology, food cost control, energy efficiency, technology integration, online reputation, hygiene standards, and risk management in cloud kitchens.
  • Menu engineering and brand development are also critical aspects of cloud kitchen operations, emphasizing the importance of a delivery network and efficient brand reputation management.

What challenges does the Cloud Kitchen Industry face during its growth?

  • The rising demand for home-cooked meals poses a significant challenge to the growth of the food industry. 
  • Cloud kitchens, also known as virtual or ghost kitchens, have emerged as a viable business model in the food industry, catering to the growing demand for convenient, affordable, and healthier food options. These kitchens operate solely for delivery and takeout, eliminating the need for dine-in facilities, which reduces overhead costs. Key components of cloud kitchens include advanced food costing systems, packaging solutions to maintain food quality during transit, data analytics for customer segmentation and menu optimization, online ordering systems and POS systems for seamless transactions, and kitchen equipment leasing for flexible investments. Additionally, waste management strategies, driver management systems, and food quality control measures ensure efficient operations.
  • Online advertising and review management platforms help attract and retain customers, while pricing strategies and menu optimization cater to diverse preferences. Customer feedback is essential for continuous improvement and growth. With the increasing importance of data-driven decision-making, cloud kitchens can leverage data analytics to gain insights into consumer behavior and trends, enabling expansion strategies and targeted marketing efforts. The delivery packaging plays a crucial role in maintaining food quality and presentation, enhancing the overall customer experience. Proper planning and execution of these aspects can lead to a successful cloud kitchen business.

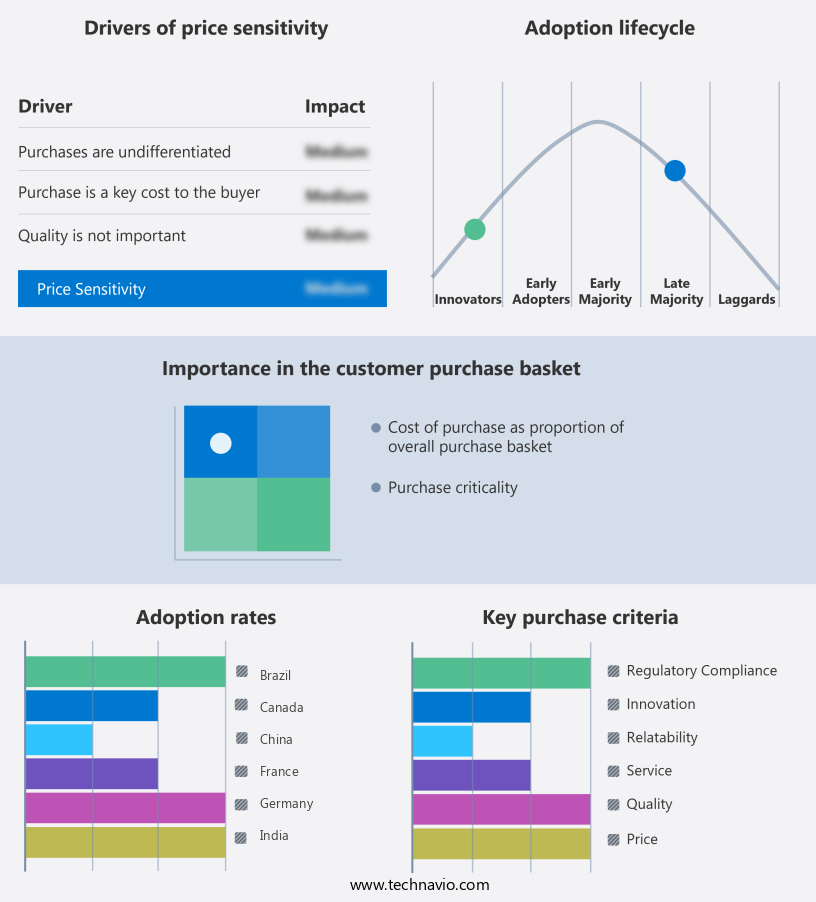
Exclusive Customer Landscape

The cloud kitchen market forecasting report includes the adoption lifecycle of the market, covering from the innovator's stage to the laggard's stage. It focuses on adoption rates in different regions based on penetration. Furthermore, the cloud kitchen market report also includes key purchase criteria and drivers of price sensitivity to help companies evaluate and develop their market growth analysis strategies.

Cloud Kitchen Market Share by Geography

 Customer Landscape

Key Companies & Market Insights

Companies are implementing various strategies, such as strategic alliances, cloud kitchen market forecast, partnerships, mergers and acquisitions, geographical expansion, and product/service launches, to enhance their presence in the industry.

All Day Technologies Inc. - Through strategic partnerships with esteemed restaurants such as Paulie Gees, China Live, and Jerk 48, the company provides cloud kitchen services, enabling culinary innovations and streamlined operations. 

The industry research and growth report includes detailed analyses of the competitive landscape of the market and information about key companies, including:

  • All Day Technologies Inc.
  • CloudKitchens
  • DoorDash Inc.
  • Dropkaffe Food and Beverages Pvt. Ltd.
  • Farm To Fork Sdn. Bhd.
  • Food Haven Technologies Inc.
  • Franklin Junction
  • Ghost Kitchen Orlando
  • Kitchen United
  • Kitopi
  • Kouzina Food Tech Pvt Ltd.
  • Nextbite Brands LLC
  • PAR Technology Corp
  • Rebel Foods Pvt. Ltd.
  • Salted
  • Starbucks Corp.
  • The Kroger Co.
  • Toast Inc.
  • Uber Technologies Inc.
  • Wingstop Inc.

Qualitative and quantitative analysis of companies has been conducted to help clients understand the wider business environment as well as the strengths and weaknesses of key industry players. Data is qualitatively analyzed to categorize companies as pure play, category-focused, industry-focused, and diversified; it is quantitatively analyzed to categorize companies as dominant, leading, strong, tentative, and weak.

Recent Development and News in Cloud Kitchen Market

  • In January 2024, Grubhub, a leading online and mobile food ordering company, announced the launch of its CloudKitchens business unit, aiming to build and operate kitchen facilities dedicated to third-party delivery and pick-up orders (Grubhub Press Release, 2024). These kitchens, designed exclusively for delivery and pick-up, would help reduce food preparation and delivery times for consumers.
  • In March 2024, Uber Eats, a prominent food delivery platform, announced a strategic partnership with Reef Technology, a company specializing in transforming underutilized urban spaces into kitchen and retail centers (Uber Eats Press Release, 2024). This collaboration aimed to create a network of cloud kitchens, allowing Uber Eats to expand its restaurant offerings and improve delivery times for customers.
  • In May 2024, DoorDash, another major food delivery platform, raised USD1.35 billion in a Series G funding round, bringing its valuation to over USD 16 billion (DoorDash SEC Filing, 2024). The funds would be used to invest in technology, expand its delivery network, and develop cloud kitchens to increase efficiency and reduce delivery times.
  • In February 2025, Amazon announced the acquisition of Bite Squad, a food delivery and cloud kitchen company, for approximately USD 115 million (Amazon Press Release, 2025). This acquisition would strengthen Amazon's position in the food delivery market and provide the company with a network of cloud kitchens to enhance its Prime Now and AmazonFresh services.

Research Analyst Overview

  • In the dynamic food industry, cloud kitchens have emerged as a profitable business model, offering commercial kitchen rental solutions to food tech brands and restaurant franchises. This market trend is driven by the need for a competitive advantage in the digital transformation of food service management. Franchise development and restaurant consulting firms are increasingly turning to cloud kitchens as a means to optimize their business intelligence and profit margins. Shared kitchen spaces and dark kitchens, facilitated by cloud computing, enable efficient kitchen operations and reduce overhead costs. Food tech companies, seeking to expand their reach and customer lifetime value, are leveraging technology adoption and digital transformation to penetrate new markets.
  • Business intelligence tools and data-driven decision making are essential for growth strategies, requiring extensive due diligence and financial modeling for investment analysis and risk assessment. Profitability and return on investment are key considerations for businesses in this market. Kitchen operations and restaurant technology are crucial components of a successful business strategy, with big data playing a significant role in market penetration and financial projections. As the market for cloud kitchens continues to evolve, understanding the competitive landscape and differentiation strategies will be essential for success. Cash flow analysis and technology adoption are critical factors in the financial modeling and strategic planning process.

Dive into Technavio's robust research methodology, blending expert interviews, extensive data synthesis, and validated models for unparalleled Cloud Kitchen Market insights. See full methodology.

Market Scope

Report Coverage

Details

Page number

216

Base year

2024

Historic period

2019-2023

Forecast period

2025-2029

Growth momentum & CAGR

Accelerate at a CAGR of 20.5%

Market growth 2025-2029

USD 97.15 billion

Market structure

Fragmented

YoY growth 2024-2025(%)

16.6

Key countries

China, US, Japan, India, South Korea, Canada, UK, Germany, France, and Brazil

Competitive landscape

Leading Companies, Market Positioning of Companies, Competitive Strategies, and Industry Risks

Request Free Sample

What are the Key Data Covered in this Cloud Kitchen Market Research and Growth Report?

  • CAGR of the Cloud Kitchen industry during the forecast period
  • Detailed information on factors that will drive the growth and forecasting between 2025 and 2029
  • Precise estimation of the size of the market and its contribution of the industry in focus to the parent market
  • Accurate predictions about upcoming growth and trends and changes in consumer behaviour
  • Growth of the market across APAC, North America, Europe, South America, and Middle East and Africa
  • Thorough analysis of the market's competitive landscape and detailed information about companies
  • Comprehensive analysis of factors that will challenge the cloud kitchen market growth of industry companies

We can help! Our analysts can customize this cloud kitchen market research report to meet your requirements.

Get in touch

1 Executive Summary

  • 1.1 Market overview
    • Executive Summary - Chart on Market Overview
    • Executive Summary - Data Table on Market Overview
    • Executive Summary - Chart on Global Market Characteristics
    • Executive Summary - Chart on Market by Geography
    • Executive Summary - Chart on Market Segmentation by Type
    • Executive Summary - Chart on Market Segmentation by Product
    • Executive Summary - Chart on Market Segmentation by End-user
    • Executive Summary - Chart on Incremental Growth
    • Executive Summary - Data Table on Incremental Growth
    • Executive Summary - Chart on Company Market Positioning

2 Technavio Analysis

  • 2.1 Analysis of price sensitivity, lifecycle, customer purchase basket, adoption rates, and purchase criteria
    • Analysis of price sensitivity, lifecycle, customer purchase basket, adoption rates, and purchase criteria
  • 2.2 Criticality of inputs and Factors of differentiation
    • Overview on criticality of inputs and factors of differentiation
  • 2.3 Factors of disruption
    • Overview on factors of disruption
  • 2.4 Impact of drivers and challenges
    • Impact of drivers and challenges in 2024 and 2029

3 Market Landscape

  • 3.1 Market ecosystem
    • Parent Market
    • Data Table on - Parent Market
  • 3.2 Market characteristics
    • Market characteristics analysis
  • 3.3 Value chain analysis
    • Value chain analysis

4 Market Sizing

  • 4.1 Market definition
    • Offerings of companies included in the market definition
  • 4.2 Market segment analysis
    • Market segments
  • 4.3 Market size 2024
    • 4.4 Market outlook: Forecast for 2024-2029
      • Chart on Global - Market size and forecast 2024-2029 ($ million)
      • Data Table on Global - Market size and forecast 2024-2029 ($ million)
      • Chart on Global Market: Year-over-year growth 2024-2029 (%)
      • Data Table on Global Market: Year-over-year growth 2024-2029 (%)

    5 Historic Market Size

    • 5.1 Global Cloud Kitchen Market 2019 - 2023
      • Historic Market Size - Data Table on Global Cloud Kitchen Market 2019 - 2023 ($ million)
    • 5.2 Type segment analysis 2019 - 2023
      • Historic Market Size - Type Segment 2019 - 2023 ($ million)
    • 5.3 Product segment analysis 2019 - 2023
      • Historic Market Size - Product Segment 2019 - 2023 ($ million)
    • 5.4 End-user segment analysis 2019 - 2023
      • Historic Market Size - End-user Segment 2019 - 2023 ($ million)
    • 5.5 Geography segment analysis 2019 - 2023
      • Historic Market Size - Geography Segment 2019 - 2023 ($ million)
    • 5.6 Country segment analysis 2019 - 2023
      • Historic Market Size - Country Segment 2019 - 2023 ($ million)

    6 Qualitative Analysis

    • 6.1 Impact of AI in global cloud kitchen market

      7 Five Forces Analysis

      • 7.1 Five forces summary
        • Five forces analysis - Comparison between 2024 and 2029
      • 7.2 Bargaining power of buyers
        • Bargaining power of buyers - Impact of key factors 2024 and 2029
      • 7.3 Bargaining power of suppliers
        • Bargaining power of suppliers - Impact of key factors in 2024 and 2029
      • 7.4 Threat of new entrants
        • Threat of new entrants - Impact of key factors in 2024 and 2029
      • 7.5 Threat of substitutes
        • Threat of substitutes - Impact of key factors in 2024 and 2029
      • 7.6 Threat of rivalry
        • Threat of rivalry - Impact of key factors in 2024 and 2029
      • 7.7 Market condition
        • Chart on Market condition - Five forces 2024 and 2029

      8 Market Segmentation by Type

      • 8.1 Market segments
        • Chart on Type - Market share 2024-2029 (%)
        • Data Table on Type - Market share 2024-2029 (%)
      • 8.2 Comparison by Type
        • Chart on Comparison by Type
        • Data Table on Comparison by Type
      • 8.3 Franchised - Market size and forecast 2024-2029
        • Chart on Franchised - Market size and forecast 2024-2029 ($ million)
        • Data Table on Franchised - Market size and forecast 2024-2029 ($ million)
        • Chart on Franchised - Year-over-year growth 2024-2029 (%)
        • Data Table on Franchised - Year-over-year growth 2024-2029 (%)
      • 8.4 Standalone - Market size and forecast 2024-2029
        • Chart on Standalone - Market size and forecast 2024-2029 ($ million)
        • Data Table on Standalone - Market size and forecast 2024-2029 ($ million)
        • Chart on Standalone - Year-over-year growth 2024-2029 (%)
        • Data Table on Standalone - Year-over-year growth 2024-2029 (%)
      • 8.5 Market opportunity by Type
        • Market opportunity by Type ($ million)
        • Data Table on Market opportunity by Type ($ million)

      9 Market Segmentation by Product

      • 9.1 Market segments
        • Chart on Product - Market share 2024-2029 (%)
        • Data Table on Product - Market share 2024-2029 (%)
      • 9.2 Comparison by Product
        • Chart on Comparison by Product
        • Data Table on Comparison by Product
      • 9.3 Independent cloud kitchen - Market size and forecast 2024-2029
        • Chart on Independent cloud kitchen - Market size and forecast 2024-2029 ($ million)
        • Data Table on Independent cloud kitchen - Market size and forecast 2024-2029 ($ million)
        • Chart on Independent cloud kitchen - Year-over-year growth 2024-2029 (%)
        • Data Table on Independent cloud kitchen - Year-over-year growth 2024-2029 (%)
      • 9.4 Commissary/shared kitchen - Market size and forecast 2024-2029
        • Chart on Commissary/shared kitchen - Market size and forecast 2024-2029 ($ million)
        • Data Table on Commissary/shared kitchen - Market size and forecast 2024-2029 ($ million)
        • Chart on Commissary/shared kitchen - Year-over-year growth 2024-2029 (%)
        • Data Table on Commissary/shared kitchen - Year-over-year growth 2024-2029 (%)
      • 9.5 Kitchen pods - Market size and forecast 2024-2029
        • Chart on Kitchen pods - Market size and forecast 2024-2029 ($ million)
        • Data Table on Kitchen pods - Market size and forecast 2024-2029 ($ million)
        • Chart on Kitchen pods - Year-over-year growth 2024-2029 (%)
        • Data Table on Kitchen pods - Year-over-year growth 2024-2029 (%)
      • 9.6 Market opportunity by Product
        • Market opportunity by Product ($ million)
        • Data Table on Market opportunity by Product ($ million)

      10 Market Segmentation by End-user

      • 10.1 Market segments
        • Chart on End-user - Market share 2024-2029 (%)
        • Data Table on End-user - Market share 2024-2029 (%)
      • 10.2 Comparison by End-user
        • Chart on Comparison by End-user
        • Data Table on Comparison by End-user
      • 10.3 Food delivery platforms - Market size and forecast 2024-2029
        • Chart on Food delivery platforms - Market size and forecast 2024-2029 ($ million)
        • Data Table on Food delivery platforms - Market size and forecast 2024-2029 ($ million)
        • Chart on Food delivery platforms - Year-over-year growth 2024-2029 (%)
        • Data Table on Food delivery platforms - Year-over-year growth 2024-2029 (%)
      • 10.4 B2B - Market size and forecast 2024-2029
        • Chart on B2B - Market size and forecast 2024-2029 ($ million)
        • Data Table on B2B - Market size and forecast 2024-2029 ($ million)
        • Chart on B2B - Year-over-year growth 2024-2029 (%)
        • Data Table on B2B - Year-over-year growth 2024-2029 (%)
      • 10.5 B2C - Market size and forecast 2024-2029
        • Chart on B2C - Market size and forecast 2024-2029 ($ million)
        • Data Table on B2C - Market size and forecast 2024-2029 ($ million)
        • Chart on B2C - Year-over-year growth 2024-2029 (%)
        • Data Table on B2C - Year-over-year growth 2024-2029 (%)
      • 10.6 Market opportunity by End-user
        • Market opportunity by End-user ($ million)
        • Data Table on Market opportunity by End-user ($ million)

      11 Customer Landscape

      • 11.1 Customer landscape overview
        • Analysis of price sensitivity, lifecycle, customer purchase basket, adoption rates, and purchase criteria

      12 Geographic Landscape

      • 12.1 Geographic segmentation
        • Chart on Market share by geography 2024-2029 (%)
        • Data Table on Market share by geography 2024-2029 (%)
      • 12.2 Geographic comparison
        • Chart on Geographic comparison
        • Data Table on Geographic comparison
      • 12.3 APAC - Market size and forecast 2024-2029
        • Chart on APAC - Market size and forecast 2024-2029 ($ million)
        • Data Table on APAC - Market size and forecast 2024-2029 ($ million)
        • Chart on APAC - Year-over-year growth 2024-2029 (%)
        • Data Table on APAC - Year-over-year growth 2024-2029 (%)
      • 12.4 North America - Market size and forecast 2024-2029
        • Chart on North America - Market size and forecast 2024-2029 ($ million)
        • Data Table on North America - Market size and forecast 2024-2029 ($ million)
        • Chart on North America - Year-over-year growth 2024-2029 (%)
        • Data Table on North America - Year-over-year growth 2024-2029 (%)
      • 12.5 Europe - Market size and forecast 2024-2029
        • Chart on Europe - Market size and forecast 2024-2029 ($ million)
        • Data Table on Europe - Market size and forecast 2024-2029 ($ million)
        • Chart on Europe - Year-over-year growth 2024-2029 (%)
        • Data Table on Europe - Year-over-year growth 2024-2029 (%)
      • 12.6 South America - Market size and forecast 2024-2029
        • Chart on South America - Market size and forecast 2024-2029 ($ million)
        • Data Table on South America - Market size and forecast 2024-2029 ($ million)
        • Chart on South America - Year-over-year growth 2024-2029 (%)
        • Data Table on South America - Year-over-year growth 2024-2029 (%)
      • 12.7 Middle East and Africa - Market size and forecast 2024-2029
        • Chart on Middle East and Africa - Market size and forecast 2024-2029 ($ million)
        • Data Table on Middle East and Africa - Market size and forecast 2024-2029 ($ million)
        • Chart on Middle East and Africa - Year-over-year growth 2024-2029 (%)
        • Data Table on Middle East and Africa - Year-over-year growth 2024-2029 (%)
      • 12.8 China - Market size and forecast 2024-2029
        • Chart on China - Market size and forecast 2024-2029 ($ million)
        • Data Table on China - Market size and forecast 2024-2029 ($ million)
        • Chart on China - Year-over-year growth 2024-2029 (%)
        • Data Table on China - Year-over-year growth 2024-2029 (%)
      • 12.9 US - Market size and forecast 2024-2029
        • Chart on US - Market size and forecast 2024-2029 ($ million)
        • Data Table on US - Market size and forecast 2024-2029 ($ million)
        • Chart on US - Year-over-year growth 2024-2029 (%)
        • Data Table on US - Year-over-year growth 2024-2029 (%)
      • 12.10 Japan - Market size and forecast 2024-2029
        • Chart on Japan - Market size and forecast 2024-2029 ($ million)
        • Data Table on Japan - Market size and forecast 2024-2029 ($ million)
        • Chart on Japan - Year-over-year growth 2024-2029 (%)
        • Data Table on Japan - Year-over-year growth 2024-2029 (%)
      • 12.11 India - Market size and forecast 2024-2029
        • Chart on India - Market size and forecast 2024-2029 ($ million)
        • Data Table on India - Market size and forecast 2024-2029 ($ million)
        • Chart on India - Year-over-year growth 2024-2029 (%)
        • Data Table on India - Year-over-year growth 2024-2029 (%)
      • 12.12 South Korea - Market size and forecast 2024-2029
        • Chart on South Korea - Market size and forecast 2024-2029 ($ million)
        • Data Table on South Korea - Market size and forecast 2024-2029 ($ million)
        • Chart on South Korea - Year-over-year growth 2024-2029 (%)
        • Data Table on South Korea - Year-over-year growth 2024-2029 (%)
      • 12.13 Canada - Market size and forecast 2024-2029
        • Chart on Canada - Market size and forecast 2024-2029 ($ million)
        • Data Table on Canada - Market size and forecast 2024-2029 ($ million)
        • Chart on Canada - Year-over-year growth 2024-2029 (%)
        • Data Table on Canada - Year-over-year growth 2024-2029 (%)
      • 12.14 UK - Market size and forecast 2024-2029
        • Chart on UK - Market size and forecast 2024-2029 ($ million)
        • Data Table on UK - Market size and forecast 2024-2029 ($ million)
        • Chart on UK - Year-over-year growth 2024-2029 (%)
        • Data Table on UK - Year-over-year growth 2024-2029 (%)
      • 12.15 Germany - Market size and forecast 2024-2029
        • Chart on Germany - Market size and forecast 2024-2029 ($ million)
        • Data Table on Germany - Market size and forecast 2024-2029 ($ million)
        • Chart on Germany - Year-over-year growth 2024-2029 (%)
        • Data Table on Germany - Year-over-year growth 2024-2029 (%)
      • 12.16 France - Market size and forecast 2024-2029
        • Chart on France - Market size and forecast 2024-2029 ($ million)
        • Data Table on France - Market size and forecast 2024-2029 ($ million)
        • Chart on France - Year-over-year growth 2024-2029 (%)
        • Data Table on France - Year-over-year growth 2024-2029 (%)
      • 12.17 Brazil - Market size and forecast 2024-2029
        • Chart on Brazil - Market size and forecast 2024-2029 ($ million)
        • Data Table on Brazil - Market size and forecast 2024-2029 ($ million)
        • Chart on Brazil - Year-over-year growth 2024-2029 (%)
        • Data Table on Brazil - Year-over-year growth 2024-2029 (%)
      • 12.18 Market opportunity by geography
        • Market opportunity by geography ($ million)
        • Data Tables on Market opportunity by geography ($ million)

      13 Drivers, Challenges, and Opportunity/Restraints

      • 13.1 Market drivers
        • 13.2 Market challenges
          • 13.3 Impact of drivers and challenges
            • Impact of drivers and challenges in 2024 and 2029
          • 13.4 Market opportunities/restraints

            14 Competitive Landscape

            • 14.1 Overview
              • 14.2 Competitive Landscape
                • Overview on criticality of inputs and factors of differentiation
              • 14.3 Landscape disruption
                • Overview on factors of disruption
              • 14.4 Industry risks
                • Impact of key risks on business

              15 Competitive Analysis

              • 15.1 Companies profiled
                • Companies covered
              • 15.2 Company ranking index
                • Company ranking index
              • 15.3 Market positioning of companies
                • Matrix on companies position and classification
              • 15.4 All Day Technologies Inc.
                • All Day Technologies Inc. - Overview
                • All Day Technologies Inc. - Product / Service
                • All Day Technologies Inc. - Key offerings
                • SWOT
              • 15.5 CloudKitchens
                • CloudKitchens - Overview
                • CloudKitchens - Product / Service
                • CloudKitchens - Key offerings
                • SWOT
              • 15.6 DoorDash Inc.
                • DoorDash Inc. - Overview
                • DoorDash Inc. - Product / Service
                • DoorDash Inc. - Key offerings
                • SWOT
              • 15.7 Farm To Fork Sdn. Bhd.
                • Farm To Fork Sdn. Bhd. - Overview
                • Farm To Fork Sdn. Bhd. - Product / Service
                • Farm To Fork Sdn. Bhd. - Key offerings
                • SWOT
              • 15.8 Food Haven Technologies Inc.
                • Food Haven Technologies Inc. - Overview
                • Food Haven Technologies Inc. - Product / Service
                • Food Haven Technologies Inc. - Key offerings
                • SWOT
              • 15.9 Ghost Kitchen Orlando
                • Ghost Kitchen Orlando - Overview
                • Ghost Kitchen Orlando - Product / Service
                • Ghost Kitchen Orlando - Key offerings
                • SWOT
              • 15.10 Kitchen United
                • Kitchen United - Overview
                • Kitchen United - Product / Service
                • Kitchen United - Key offerings
                • SWOT
              • 15.11 Kitopi
                • Kitopi - Overview
                • Kitopi - Product / Service
                • Kitopi - Key offerings
                • SWOT
              • 15.12 PAR Technology Corp
                • PAR Technology Corp - Overview
                • PAR Technology Corp - Business segments
                • PAR Technology Corp - Key offerings
                • PAR Technology Corp - Segment focus
                • SWOT
              • 15.13 Rebel Foods Pvt. Ltd.
                • Rebel Foods Pvt. Ltd. - Overview
                • Rebel Foods Pvt. Ltd. - Product / Service
                • Rebel Foods Pvt. Ltd. - Key offerings
                • SWOT
              • 15.14 Salted
                • Salted - Overview
                • Salted - Product / Service
                • Salted - Key offerings
                • SWOT
              • 15.15 Starbucks Corp.
                • Starbucks Corp. - Overview
                • Starbucks Corp. - Business segments
                • Starbucks Corp. - Key news
                • Starbucks Corp. - Key offerings
                • Starbucks Corp. - Segment focus
                • SWOT
              • 15.16 The Kroger Co.
                • The Kroger Co. - Overview
                • The Kroger Co. - Product / Service
                • The Kroger Co. - Key news
                • The Kroger Co. - Key offerings
                • SWOT
              • 15.17 Uber Technologies Inc.
                • Uber Technologies Inc. - Overview
                • Uber Technologies Inc. - Business segments
                • Uber Technologies Inc. - Key offerings
                • Uber Technologies Inc. - Segment focus
                • SWOT
              • 15.18 Wingstop Inc.
                • Wingstop Inc. - Overview
                • Wingstop Inc. - Product / Service
                • Wingstop Inc. - Key offerings
                • SWOT

              16 Appendix

              • 16.1 Scope of the report
                • 16.2 Inclusions and exclusions checklist
                  • Inclusions checklist
                  • Exclusions checklist
                • 16.3 Currency conversion rates for US$
                  • Currency conversion rates for US$
                • 16.4 Research methodology
                  • Research methodology
                • 16.5 Data procurement
                  • Information sources
                • 16.6 Data validation
                  • Data validation
                • 16.7 Validation techniques employed for market sizing
                  • Validation techniques employed for market sizing
                • 16.8 Data synthesis
                  • Data synthesis
                • 16.9 360 degree market analysis
                  • 360 degree market analysis
                • 16.10 List of abbreviations
                  • List of abbreviations

                Research Methodology

                Technavio presents a detailed picture of the market by way of study, synthesis, and summation of data from multiple sources. The analysts have presented the various facets of the market with a particular focus on identifying the key industry influencers. The data thus presented is comprehensive, reliable, and the result of extensive research, both primary and secondary.

                INFORMATION SOURCES

                Primary sources

                • Manufacturers and suppliers
                • Channel partners
                • Industry experts
                • Strategic decision makers

                Secondary sources

                • Industry journals and periodicals
                • Government data
                • Financial reports of key industry players
                • Historical data
                • Press releases

                DATA ANALYSIS

                Data Synthesis

                • Collation of data
                • Estimation of key figures
                • Analysis of derived insights

                Data Validation

                • Triangulation with data models
                • Reference against proprietary databases
                • Corroboration with industry experts

                REPORT WRITING

                Qualitative

                • Market drivers
                • Market challenges
                • Market trends
                • Five forces analysis

                Quantitative

                • Market size and forecast
                • Market segmentation
                • Geographical insights
                • Competitive landscape

                Interested in this report?

                Get your sample now to see our research methodology and insights!

                Download Now

                Frequently Asked Questions

                Cloud Kitchen market growth will increase by $ 97.15 bn during 2025-2029.

                The Cloud Kitchen market is expected to grow at a CAGR of 20.5% during 2025-2029.

                Cloud Kitchen market is segmented by Type( Franchised, Standalone) Product( Independent cloud kitchen, Commissary/shared kitchen, Kitchen pods, South America, Middle East and Africa) End-user( B2B, B2C, Food delivery platforms, South America, Middle East and Africa)

                All Day Technologies Inc., CloudKitchens, DoorDash Inc., Dropkaffe Food and Beverages Pvt. Ltd., Farm To Fork Sdn. Bhd., Food Haven Technologies Inc., Franklin Junction, Ghost Kitchen Orlando, Kitchen United, Kitopi, Kouzina Food Tech Pvt Ltd., Nextbite Brands LLC, PAR Technology Corp, Rebel Foods Pvt. Ltd., Salted, Starbucks Corp., The Kroger Co., Toast Inc., Uber Technologies Inc., Wingstop Inc. are a few of the key vendors in the Cloud Kitchen market.

                APAC will register the highest growth rate of 63% among the other regions. Therefore, the Cloud Kitchen market in APAC is expected to garner significant business opportunities for the vendors during the forecast period.

                China, US, Japan, India, South Korea, Canada, UK, Germany, France, Brazil

                • Advantages of cloud kitchens over traditional restaurantsCloud kitchens produce food for online delivery. These kitchens are equipped with kitchen equipment and facilities needed for the preparation of food but have no dining area. Cloud kitchens have emerged as a promising business model due to the rapid increase in consumer demand for food delivery. There is a rise in the number of online food orders owing to the emergence of new online platforms. Some of the major advantages of opening a cloud kitchen are: Low operating cost: The cost of opening a cloud kitchen is low when compared to traditional restaurants. Cloud kitchens cost roughly $2 is the driving factor this market.
                • 000-4 is the driving factor this market.
                • 000 a month is the driving factor this market.
                • depending on the market. Limited staff: In such kitchens is the driving factor this market.
                • the staff is limited is the driving factor this market.
                • depending on the scale of operation. Improved sales with multiple brands: Cloud kitchens can serve multiple cuisines while benefiting from economies of scale across brands. With the increase in penetration of the Internet and the use of mobile applications is the driving factor this market.
                • many people prefer ordering food through mobile applications and online portals. The adoption of cloud kitchens helps reduce the rent and labor costs incurred by restaurants. Many major food service establishments across the world are focusing on setting up ghost kitchens to provide superior customer service The use of cloud kitchens allows established restaurants to expand their delivery operations at a low cost. Therefore is the driving factor this market.
                • the advantages of cloud kitchens and the rising demand for online food delivery services are likely to drive the growth of the market during the forecast period. is the driving factor this market.

                The Cloud Kitchen market vendors should focus on grabbing business opportunities from the Franchised segment as it accounted for the largest market share in the base year.