Cleaning Services Market Analysis, Size, and Forecast 2026-2030: North America (US, Canada, and Mexico), Europe (Germany, UK, and France), APAC (China, Japan, and India), South America (Brazil and Argentina), Middle East and Africa (Saudi Arabia, UAE, and South Africa), and Rest of World (ROW)

Cleaning Services Market Analysis, Size, and Forecast 2026-2030:
North America (US, Canada, and Mexico), Europe (Germany, UK, and France), APAC (China, Japan, and India), South America (Brazil and Argentina), Middle East and Africa (Saudi Arabia, UAE, and South Africa), and Rest of World (ROW)

Published: Jan 2026 291 Pages SKU: IRTNTR74636

Market Overview at a Glance

$24.93 B
Market Opportunity
6.5%
CAGR 2025 - 2030
40.2%
North America Growth
$49.17 B
Commercial segment 2024

Cleaning Services Market Size 2026-2030

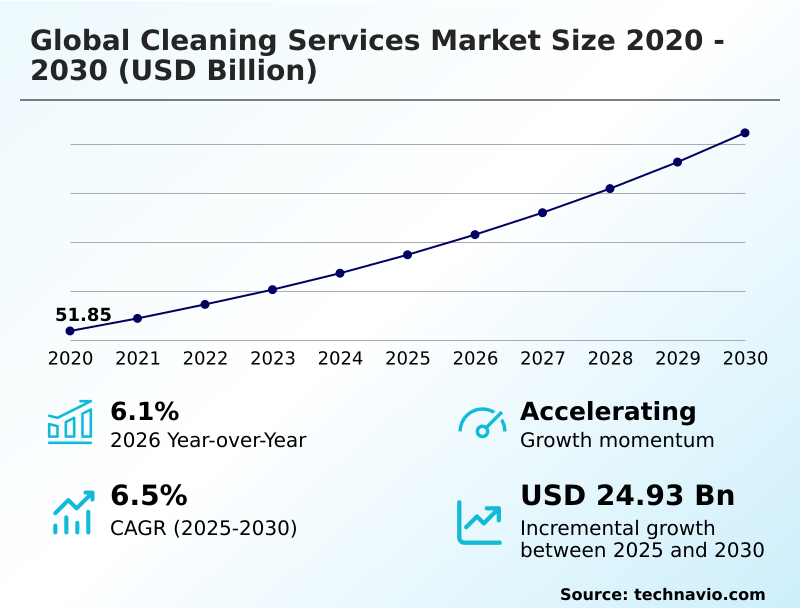
The cleaning services market size is valued to increase by USD 24.93 billion, at a CAGR of 6.5% from 2025 to 2030. Heightened focus on health, hygiene, and workplace safety will drive the cleaning services market.

Major Market Trends & Insights

  • North America dominated the market and accounted for a 40.2% growth during the forecast period.
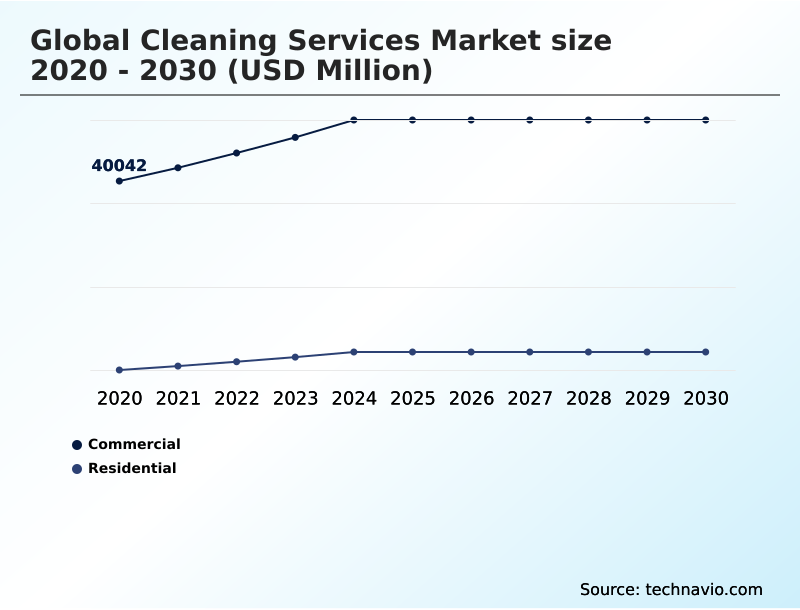
  • By End-user - Commercial segment was valued at USD 49.17 billion in 2024
  • By Type - Floor care segment accounted for the largest market revenue share in 2024

Market Size & Forecast

  • Market Opportunities: USD 40.52 billion
  • Market Future Opportunities: USD 24.93 billion
  • CAGR from 2025 to 2030 : 6.5%

Market Summary

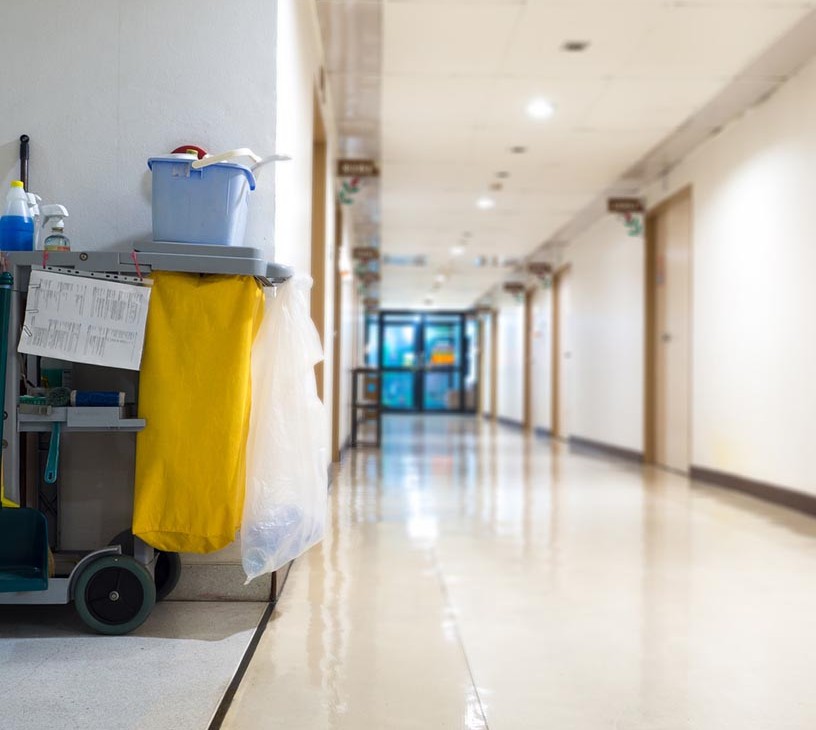
  • The cleaning services market is undergoing a significant transformation, evolving from a labor-intensive industry to a sophisticated, technology-driven sector. This shift is propelled by a heightened emphasis on health and hygiene, making professional cleaning a critical component of risk management for businesses.
  • Key drivers include the sustained demand for specialized services like high-touch surface disinfection and a growing trend toward outsourcing non-core functions to achieve operational efficiency. For instance, a multi-site retail corporation can leverage an integrated facility management provider to standardize cleaning protocols across all locations, ensuring brand consistency and compliance while reducing administrative overhead.
  • The industry is also shaped by the mainstreaming of sustainability, with increasing pressure to adopt green cleaning solutions and environmentally friendly practices. Technology, particularly robotics and IoT, is reshaping service delivery, enabling data-driven, on-demand cleaning models that optimize resource allocation.
  • Despite challenges like persistent labor shortages and intense price competition, the market's trajectory remains positive, driven by innovation and its essential role in maintaining safe and functional public and private spaces.

What will be the Size of the Cleaning Services Market during the forecast period?

Get Key Insights on Market Forecast (PDF) Request Free Sample

How is the Cleaning Services Market Segmented?

The cleaning services industry research report provides comprehensive data (region-wise segment analysis), with forecasts and estimates in "USD million" for the period 2026-2030, as well as historical data from 2020-2024 for the following segments.

  • End-user
    • Commercial
    • Residential
  • Type
    • Floor care
    • Vacuuming
    • Maid service
    • Window cleaning
    • Others
  • Product type
    • Services
    • Equipment and accessories
  • Geography
    • North America
      • US
      • Canada
      • Mexico
    • Europe
      • Germany
      • UK
      • France
    • APAC
      • China
      • Japan
      • India
    • South America
      • Brazil
      • Argentina
    • Middle East and Africa
      • Saudi Arabia
      • UAE
      • South Africa
    • Rest of World (ROW)

By End-user Insights

The commercial segment is estimated to witness significant growth during the forecast period.

The commercial segment is driven by a non-negotiable need for professional environments that prioritize health and safety. Organizations are increasingly outsourcing commercial janitorial services as part of a broader integrated facility management strategy, enabling them to focus on core operations.

Service requirements now extend beyond aesthetics to include rigorous high-touch surface disinfection and infection prevention and control protocols, particularly in healthcare environmental services and educational facility cleaning.

Providers are expected to implement certified green cleaning solutions using biodegradable chemicals to meet client ESG corporate mandates and standards like LEED building certification.

The provision of day porter services and specialized night cleaning operations ensures operational continuity for corporate offices and other real estate facility services, with providers acting as strategic partners in maintaining brand reputation and occupant well-being.

Request Free Sample

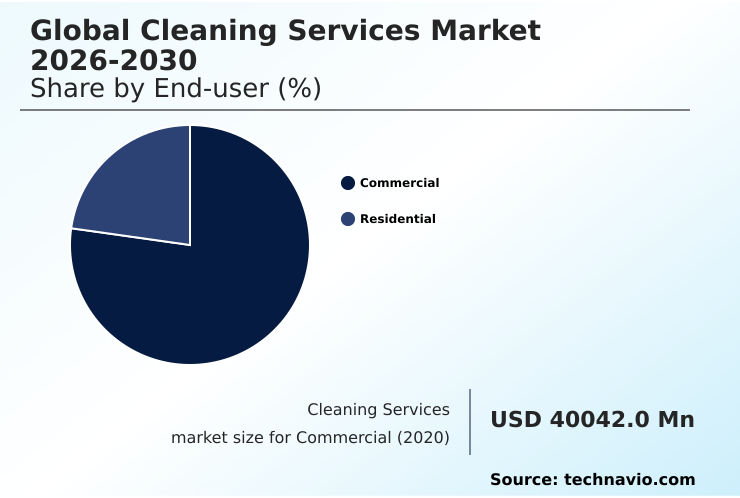
The Commercial segment was valued at USD 49.17 billion in 2024 and showed a gradual increase during the forecast period.

Request Free Sample

Regional Analysis

North America is estimated to contribute 40.2% to the growth of the global market during the forecast period.Technavio’s analysts have elaborately explained the regional trends and drivers that shape the market during the forecast period.

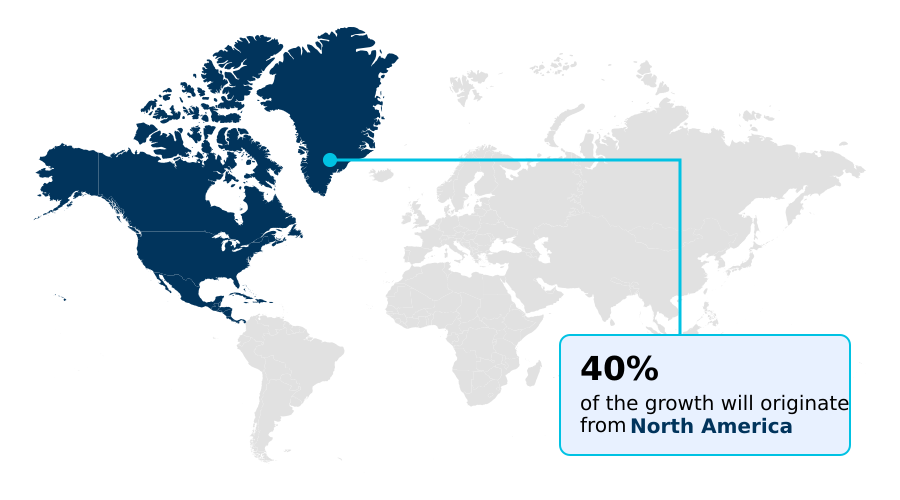
See How Cleaning Services Market Demand is Rising in North America Request Free Sample

The global market exhibits significant regional disparities in maturity and technological adoption. North America leads in deploying advanced automation, with an adoption rate for robotics in large facilities that is nearly double that of some developing regions.

This is driven by high labor costs and demand for predictive maintenance analytics.

In Europe, stringent environmental certification standards are paramount, with over 80% of new commercial contracts requiring certified green products, driving a focus on outcome-based cleaning services that guarantee specific hygiene levels.

The APAC market is characterized by rapid growth in aviation cleaning services and sports venue cleaning, fueled by infrastructure development.

Across all regions, the trend is toward providing unified facility services that bundle cleaning with landscaping and groundskeeping and asset compliance solutions. Companies specializing in niche areas like moving-related cleaning services and cleanroom cleaning standards are finding opportunities globally.

Market Dynamics

Our researchers analyzed the data with 2025 as the base year, along with the key drivers, trends, and challenges. A holistic analysis of drivers will help companies refine their marketing strategies to gain a competitive advantage.

  • The strategic direction of the cleaning services market is increasingly shaped by technology and specialization. The deployment of autonomous floor care for retail is becoming a competitive differentiator, while the use of iot for restroom supply management optimizes labor and material costs. Clients now demand data-driven disinfection verification reporting to ensure compliance and safety.
  • For businesses targeting premium contracts, offering green cleaning for leed certified buildings is essential. The hospitality sector, in particular, is expanding its use of robotic vacuums in hospitality sector to address labor challenges. The future lies in ai-powered predictive cleaning schedules and offering integrated facility services for healthcare to provide holistic solutions.
  • This includes focusing on sustainable waste management in commercial properties and leveraging workforce optimization software for janitorial staff. Niche expertise in specialized cleaning for manufacturing facilities and creating viable franchise models for commercial cleaning businesses are proven growth avenues. Furthermore, demonstrating capabilities in infection control cleaning for educational institutions is crucial for public sector contracts.
  • A key consideration for corporate clients is the efficiency gained from outsourcing janitorial services for corporate offices. However, the entire industry must navigate the impact of labor shortages on cleaning industry. The high rate of technology adoption in commercial cleaning services is a direct response, with businesses closely analyzing the roi of robotic cleaning equipment.
  • Successful smart building integration with cleaning operations can reduce energy consumption by over 10% compared to non-integrated systems. The market is also responding to the demand for certified green cleaning products, stringent compliance with health and safety regulations, and the growth of residential cleaning service booking platforms.

What are the key market drivers leading to the rise in the adoption of Cleaning Services Industry?

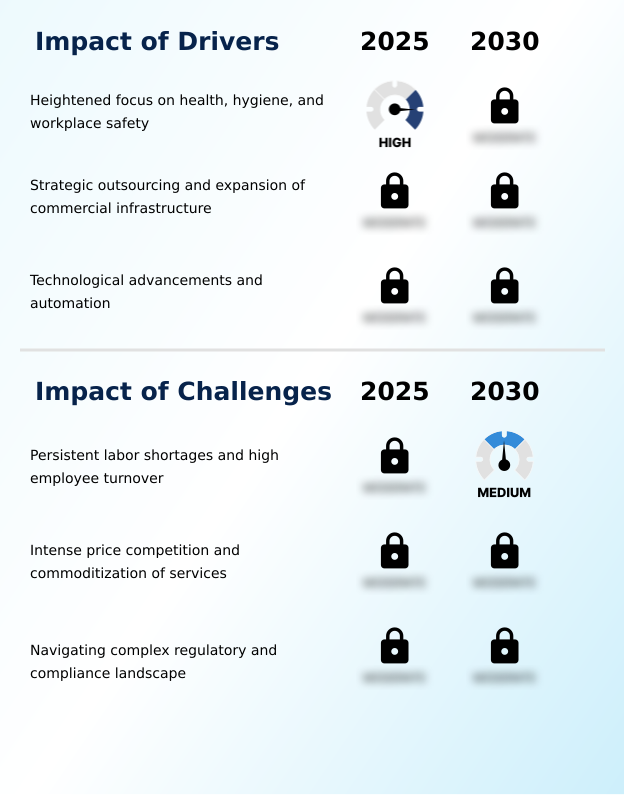
  • A heightened focus on health, hygiene, and workplace safety is a primary driver, repositioning professional cleaning as an essential component of risk management and public health infrastructure.

  • A profound shift in attitudes toward health has repositioned professional cleaning as an essential service. There is sustained demand for advanced specialized hygiene services, including virucidal deep cleaning and proactive indoor air quality management.
  • Providers are expected to use hospital-grade disinfectants and possess expertise in sterile environment maintenance, which is critical for healthcare facilities. The scope of work now frequently includes complex tasks like post-construction cleanup, hazardous material handling, and environmental site decontamination services.
  • In specialized sectors, services like disaster restoration cleaning and mold remediation services have seen a surge, with certified firms demonstrating a 50% faster response time.
  • This elevated expectation transforms cleaning companies into vital partners for foodservice-related sanitation, where adherence to protocols can reduce cross-contamination incidents by over 90%, justifying investment in premium property restoration services.

What are the market trends shaping the Cleaning Services Industry?

  • The accelerated adoption of smart cleaning solutions, including robotics and IoT-enabled systems, is a defining trend. This shift is fundamentally reshaping operational models and service delivery across the industry.

  • The industry's digital transformation is driven by the integration of technology to boost efficiency and service quality. The adoption of robotic process automation and fleets of autonomous floor scrubbers is becoming standard, with some advanced systems improving floor coverage consistency by over 40% compared to manual methods.
  • This shift to demand-driven cleaning models is enabled by internet of things sensors that monitor facility usage, reducing unnecessary labor costs by up to 25%. Workforce management software and digital quality inspections provide unprecedented operational transparency.
  • Innovations like surface-adaptive ai technology are now entering the market, allowing a single machine to service multiple environments from high-tech manufacturing cleaning areas to office spaces. These on-demand cleaning platforms and smart building integration capabilities are defining the next generation of service delivery, enhancing everything from routine tasks to specialized bioremediation services.

What challenges does the Cleaning Services Industry face during its growth?

  • Persistent labor shortages and high employee turnover represent a fundamental challenge, impacting service quality, operational costs, and overall industry growth.

  • The industry grapples with intense price competition, often driven by the fragmented nature of franchise-based commercial cleaning and the low barrier to entry for residential maid service. This puts pressure on margins, making it difficult to invest in technology.
  • Providers must balance client cost expectations with the need for effective restroom sanitation protocols and sustainable practices like comprehensive waste diversion rate reporting and carbon footprint reduction.
  • Executing specialized tasks such as industrial degreasing, floor stripping and waxing, or carpet hot water extraction requires skilled labor, which remains scarce, leading to project delays that affect up to 20% of specialized contracts.
  • Some providers mitigate this by offering bundled services, such as pest control integration, which can improve contract retention by 15% and offer a more holistic solution for communal area maintenance and end-of-tenancy cleaning.

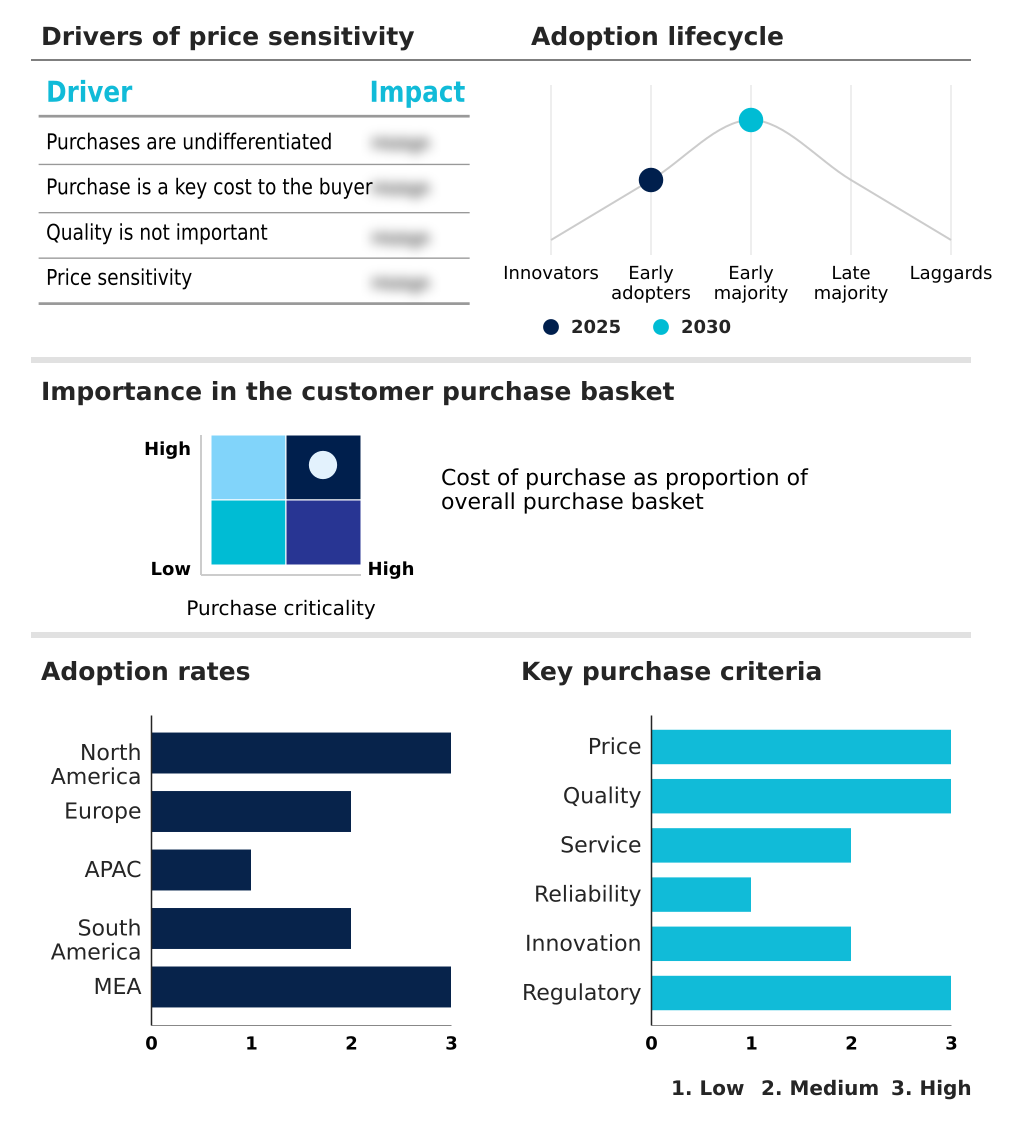
Exclusive Technavio Analysis on Customer Landscape

The cleaning services market forecasting report includes the adoption lifecycle of the market, covering from the innovator’s stage to the laggard’s stage. It focuses on adoption rates in different regions based on penetration. Furthermore, the cleaning services market report also includes key purchase criteria and drivers of price sensitivity to help companies evaluate and develop their market growth analysis strategies.

Customer Landscape of Cleaning Services Industry

Competitive Landscape

Companies are implementing various strategies, such as strategic alliances, cleaning services market forecast, partnerships, mergers and acquisitions, geographical expansion, and product/service launches, to enhance their presence in the industry.

ABM Industries Inc. - Vendors offer integrated solutions, from janitorial services to specialized disinfection, focusing on hygiene, safety, and operational efficiency for commercial and residential clients.

The industry research and growth report includes detailed analyses of the competitive landscape of the market and information about key companies, including:

  • ABM Industries Inc.
  • Aden Group
  • Anago Cleaning Systems Inc.
  • Atlas Facilities Management
  • BELFOR Holdings Inc.
  • Cleaning Services Group Inc.
  • Compass Group Plc
  • Crest Licensing Systems Ltd.
  • Cushman and Wakefield Plc
  • ecoserv
  • Extra Clean Inc.
  • GSN Property Services Co. Ltd.
  • Harvard Service Group
  • ISS AS
  • Jani King International Inc.
  • Jones Lang LaSalle Inc.
  • Nugent Contract Cleaning
  • Sodexo SA
  • The ServiceMaster Co. LLC

Qualitative and quantitative analysis of companies has been conducted to help clients understand the wider business environment as well as the strengths and weaknesses of key industry players. Data is qualitatively analyzed to categorize companies as pure play, category-focused, industry-focused, and diversified; it is quantitatively analyzed to categorize companies as dominant, leading, strong, tentative, and weak.

Recent Development and News in Cleaning services market

  • In September 2024, ISS A/S announced the full-scale rollout of its PureSpace offering, a new outcome-based cleaning model that contractually guarantees specific environmental quality outcomes, such as defined levels of airborne particulate matter, verified by a proprietary AI platform and sensor network.
  • In November 2024, Tennant Company launched its new T-series autonomous floor care system, the industry's first to feature Surface-Adaptive AI technology, enabling a single robotic unit to identify different floor types and automatically adjust its cleaning tools and chemical dispensing.
  • In March 2025, JLL unveiled its Sustainable Workplace Initiative, a new operational standard mandating that all contracted janitorial providers use cleaning solutions with top environmental certifications and provide quarterly reports on water usage, waste diversion, and carbon footprint.
  • In April 2025, Amazon mandated through its Project Clean Core initiative that a minimum of 75% of floor space in its fulfillment and data centers must be maintained by autonomous robotic systems integrated with its internal facility management software for real-time hygiene data reporting.

Dive into Technavio’s robust research methodology, blending expert interviews, extensive data synthesis, and validated models for unparalleled Cleaning Services Market insights. See full methodology.

Market Scope
Page number 291
Base year 2025
Historic period 2020-2024
Forecast period 2026-2030
Growth momentum & CAGR Accelerate at a CAGR of 6.5%
Market growth 2026-2030 USD 24933.6 million
Market structure Fragmented
YoY growth 2025-2026(%) 6.1%
Key countries US, Canada, Mexico, Germany, UK, France, Italy, Spain, The Netherlands, China, Japan, India, South Korea, Australia, Indonesia, Brazil, Argentina, Chile, Saudi Arabia, UAE, South Africa, Israel and Turkey
Competitive landscape Leading Companies, Market Positioning of Companies, Competitive Strategies, and Industry Risks

Request Free Sample

Research Analyst Overview

  • The market's evolution is defined by a strategic shift from basic janitorial work to sophisticated integrated facility management, where outcome-based cleaning services are paramount. A key boardroom focus is the implementation of robust data-driven cleaning protocols and robotic process automation, including the deployment of autonomous floor scrubbers with surface-adaptive ai technology.
  • This is driven by the need for verifiable infection prevention and control, utilizing hospital-grade disinfectants for high-touch surface disinfection and virucidal deep cleaning. Modern contracts demand excellence in indoor air quality management and adherence to restroom sanitation protocols.
  • Sustainability is no longer optional, with clients mandating green cleaning solutions, the use of biodegradable chemicals, and comprehensive water conservation techniques to meet LEED building certification and other environmental certification standards. Providers must now deliver detailed waste diversion rate reporting and demonstrate carbon footprint reduction to satisfy corporate ESG corporate mandates.
  • Workforce management software and digital quality inspections are critical for optimizing operations, which now include specialized hygiene services for sterile environment maintenance and cleanroom cleaning standards. The service scope has expanded to cover post-construction cleanup, industrial degreasing, hazardous material handling, and even commercial kitchen cleaning. Expertise in floor stripping and waxing and carpet hot water extraction remains fundamental.
  • The use of internet of things sensors, environmental sensor networks, and predictive maintenance analytics enables proactive, demand-driven cleaning models, with leading firms showing a 20% improvement in resource allocation.

What are the Key Data Covered in this Cleaning Services Market Research and Growth Report?

  • What is the expected growth of the Cleaning Services Market between 2026 and 2030?

    • USD 24.93 billion, at a CAGR of 6.5%

  • What segmentation does the market report cover?

    • The report is segmented by End-user (Commercial, and Residential), Type (Floor care, Vacuuming, Maid service, Window cleaning, and Others), Product Type (Services, and Equipment and accessories) and Geography (North America, Europe, APAC, South America, Middle East and Africa)

  • Which regions are analyzed in the report?

    • North America, Europe, APAC, South America and Middle East and Africa

  • What are the key growth drivers and market challenges?

    • Heightened focus on health, hygiene, and workplace safety, Persistent labor shortages and high employee turnover

  • Who are the major players in the Cleaning Services Market?

    • ABM Industries Inc., Aden Group, Anago Cleaning Systems Inc., Atlas Facilities Management, BELFOR Holdings Inc., Cleaning Services Group Inc., Compass Group Plc, Crest Licensing Systems Ltd., Cushman and Wakefield Plc, ecoserv, Extra Clean Inc., GSN Property Services Co. Ltd., Harvard Service Group, ISS AS, Jani King International Inc., Jones Lang LaSalle Inc., Nugent Contract Cleaning, Sodexo SA and The ServiceMaster Co. LLC

Market Research Insights

  • The market is defined by a shift toward integrated and technology-enabled service delivery. Unified facility services models that combine commercial window washing, day porter services, and pest control integration are gaining traction, with providers reporting a 15% increase in client retention for bundled contracts.
  • The rise of on-demand cleaning platforms has revolutionized the residential sector, while franchise-based commercial cleaning networks leverage standardized processes to serve national accounts. Specialized segments like disaster restoration cleaning and healthcare environmental services command higher margins due to rigorous certification requirements.
  • Firms offering expertise in niche areas such as aviation cleaning services or high-tech manufacturing cleaning can achieve profitability rates up to 20% higher than those offering only general janitorial services, demonstrating the value of specialization in a competitive landscape.

We can help! Our analysts can customize this cleaning services market research report to meet your requirements.

Get in touch

1. Executive Summary

1.1 Market overview

Executive Summary - Chart on Market Overview
Executive Summary - Data Table on Market Overview
Executive Summary - Chart on Global Market Characteristics
Executive Summary - Chart on Market by Geography
Executive Summary - Chart on Market Segmentation by End-user
Executive Summary - Chart on Market Segmentation by Type
Executive Summary - Chart on Market Segmentation by Product Type
Executive Summary - Chart on Incremental Growth
Executive Summary - Data Table on Incremental Growth
Executive Summary - Chart on Company Market Positioning

2. Technavio Analysis

2.1 Analysis of price sensitivity, lifecycle, customer purchase basket, adoption rates, and purchase criteria

2.2 Criticality of inputs and Factors of differentiation

Chart on Overview on criticality of inputs and factors of differentiation

2.3 Factors of disruption

Chart on Overview on factors of disruption

2.4 Impact of drivers and challenges

Chart on Impact of drivers and challenges in 2025 and 2030

3. Market Landscape

3.1 Market ecosystem

Chart on Parent Market
Data Table on - Parent Market

3.2 Market characteristics

Chart on Market characteristics analysis

3.3 Value chain analysis

Chart on Value chain analysis

4. Market Sizing

4.1 Market definition

Data Table on Offerings of companies included in the market definition

4.2 Market segment analysis

Market segments

4.3 Market size 2025

4.4 Market outlook: Forecast for 2025-2030

Chart on Global - Market size and forecast 2025-2030 ($ million)
Data Table on Global - Market size and forecast 2025-2030 ($ million)
Chart on Global Market: Year-over-year growth 2025-2030 (%)
Data Table on Global Market: Year-over-year growth 2025-2030 (%)

5. Historic Market Size

5.1 Global Cleaning Services Market 2020 - 2024

Historic Market Size - Data Table on Global Cleaning Services Market 2020 - 2024 ($ million)

5.2 End-user segment analysis 2020 - 2024

Historic Market Size - End-user Segment 2020 - 2024 ($ million)

5.3 Type segment analysis 2020 - 2024

Historic Market Size - Type Segment 2020 - 2024 ($ million)

5.4 Product Type segment analysis 2020 - 2024

Historic Market Size - Product Type Segment 2020 - 2024 ($ million)

5.5 Geography segment analysis 2020 - 2024

Historic Market Size - Geography Segment 2020 - 2024 ($ million)

5.6 Country segment analysis 2020 - 2024

Historic Market Size - Country Segment 2020 - 2024 ($ million)

6. Qualitative Analysis

6.1 The AI impact on global cleaning services market

7. Five Forces Analysis

7.1 Five forces summary

Five forces analysis - Comparison between 2025 and 2030

7.2 Bargaining power of buyers

Bargaining power of buyers - Impact of key factors 2025 and 2030

7.3 Bargaining power of suppliers

Bargaining power of suppliers - Impact of key factors in 2025 and 2030

7.4 Threat of new entrants

Threat of new entrants - Impact of key factors in 2025 and 2030

7.5 Threat of substitutes

Threat of substitutes - Impact of key factors in 2025 and 2030

7.6 Threat of rivalry

Threat of rivalry - Impact of key factors in 2025 and 2030

7.7 Market condition

Chart on Market condition - Five forces 2025 and 2030

8. Market Segmentation by End-user

8.1 Market segments

Chart on End-user - Market share 2025-2030 (%)
Data Table on End-user - Market share 2025-2030 (%)

8.2 Comparison by End-user

Chart on Comparison by End-user
Data Table on Comparison by End-user

8.3 Commercial - Market size and forecast 2025-2030

Chart on Commercial - Market size and forecast 2025-2030 ($ million)
Data Table on Commercial - Market size and forecast 2025-2030 ($ million)
Chart on Commercial - Year-over-year growth 2025-2030 (%)
Data Table on Commercial - Year-over-year growth 2025-2030 (%)

8.4 Residential - Market size and forecast 2025-2030

Chart on Residential - Market size and forecast 2025-2030 ($ million)
Data Table on Residential - Market size and forecast 2025-2030 ($ million)
Chart on Residential - Year-over-year growth 2025-2030 (%)
Data Table on Residential - Year-over-year growth 2025-2030 (%)

8.5 Market opportunity by End-user

Market opportunity by End-user ($ million)
Data Table on Market opportunity by End-user ($ million)

9. Market Segmentation by Type

9.1 Market segments

Chart on Type - Market share 2025-2030 (%)
Data Table on Type - Market share 2025-2030 (%)

9.2 Comparison by Type

Chart on Comparison by Type
Data Table on Comparison by Type

9.3 Floor care - Market size and forecast 2025-2030

Chart on Floor care - Market size and forecast 2025-2030 ($ million)
Data Table on Floor care - Market size and forecast 2025-2030 ($ million)
Chart on Floor care - Year-over-year growth 2025-2030 (%)
Data Table on Floor care - Year-over-year growth 2025-2030 (%)

9.4 Vacuuming - Market size and forecast 2025-2030

Chart on Vacuuming - Market size and forecast 2025-2030 ($ million)
Data Table on Vacuuming - Market size and forecast 2025-2030 ($ million)
Chart on Vacuuming - Year-over-year growth 2025-2030 (%)
Data Table on Vacuuming - Year-over-year growth 2025-2030 (%)

9.5 Maid service - Market size and forecast 2025-2030

Chart on Maid service - Market size and forecast 2025-2030 ($ million)
Data Table on Maid service - Market size and forecast 2025-2030 ($ million)
Chart on Maid service - Year-over-year growth 2025-2030 (%)
Data Table on Maid service - Year-over-year growth 2025-2030 (%)

9.6 Window cleaning - Market size and forecast 2025-2030

Chart on Window cleaning - Market size and forecast 2025-2030 ($ million)
Data Table on Window cleaning - Market size and forecast 2025-2030 ($ million)
Chart on Window cleaning - Year-over-year growth 2025-2030 (%)
Data Table on Window cleaning - Year-over-year growth 2025-2030 (%)

9.7 Others - Market size and forecast 2025-2030

Chart on Others - Market size and forecast 2025-2030 ($ million)
Data Table on Others - Market size and forecast 2025-2030 ($ million)
Chart on Others - Year-over-year growth 2025-2030 (%)
Data Table on Others - Year-over-year growth 2025-2030 (%)

9.8 Market opportunity by Type

Market opportunity by Type ($ million)
Data Table on Market opportunity by Type ($ million)

10. Market Segmentation by Product Type

10.1 Market segments

Chart on Product Type - Market share 2025-2030 (%)
Data Table on Product Type - Market share 2025-2030 (%)

10.2 Comparison by Product Type

Chart on Comparison by Product Type
Data Table on Comparison by Product Type

10.3 Services - Market size and forecast 2025-2030

Chart on Services - Market size and forecast 2025-2030 ($ million)
Data Table on Services - Market size and forecast 2025-2030 ($ million)
Chart on Services - Year-over-year growth 2025-2030 (%)
Data Table on Services - Year-over-year growth 2025-2030 (%)

10.4 Equipment and accessories - Market size and forecast 2025-2030

Chart on Equipment and accessories - Market size and forecast 2025-2030 ($ million)
Data Table on Equipment and accessories - Market size and forecast 2025-2030 ($ million)
Chart on Equipment and accessories - Year-over-year growth 2025-2030 (%)
Data Table on Equipment and accessories - Year-over-year growth 2025-2030 (%)

10.5 Market opportunity by Product Type

Market opportunity by Product Type ($ million)
Data Table on Market opportunity by Product Type ($ million)

11. Customer Landscape

11.1 Customer landscape overview

Analysis of price sensitivity, lifecycle, customer purchase basket, adoption rates, and purchase criteria

12. Geographic Landscape

12.1 Geographic segmentation

Chart on Market share by geography 2025-2030 (%)
Data Table on Market share by geography 2025-2030 (%)

12.2 Geographic comparison

Chart on Geographic comparison
Data Table on Geographic comparison

12.3 North America - Market size and forecast 2025-2030

Chart on North America - Market size and forecast 2025-2030 ($ million)
Data Table on North America - Market size and forecast 2025-2030 ($ million)
Chart on North America - Year-over-year growth 2025-2030 (%)
Data Table on North America - Year-over-year growth 2025-2030 (%)
Chart on Regional Comparison - North America
Data Table on Regional Comparison - North America

12.3.1 US - Market size and forecast 2025-2030

Chart on US - Market size and forecast 2025-2030 ($ million)
Data Table on US - Market size and forecast 2025-2030 ($ million)
Chart on US - Year-over-year growth 2025-2030 (%)
Data Table on US - Year-over-year growth 2025-2030 (%)

12.3.2 Canada - Market size and forecast 2025-2030

Chart on Canada - Market size and forecast 2025-2030 ($ million)
Data Table on Canada - Market size and forecast 2025-2030 ($ million)
Chart on Canada - Year-over-year growth 2025-2030 (%)
Data Table on Canada - Year-over-year growth 2025-2030 (%)

12.3.3 Mexico - Market size and forecast 2025-2030

Chart on Mexico - Market size and forecast 2025-2030 ($ million)
Data Table on Mexico - Market size and forecast 2025-2030 ($ million)
Chart on Mexico - Year-over-year growth 2025-2030 (%)
Data Table on Mexico - Year-over-year growth 2025-2030 (%)

12.4 Europe - Market size and forecast 2025-2030

Chart on Europe - Market size and forecast 2025-2030 ($ million)
Data Table on Europe - Market size and forecast 2025-2030 ($ million)
Chart on Europe - Year-over-year growth 2025-2030 (%)
Data Table on Europe - Year-over-year growth 2025-2030 (%)
Chart on Regional Comparison - Europe
Data Table on Regional Comparison - Europe

12.4.1 Germany - Market size and forecast 2025-2030

Chart on Germany - Market size and forecast 2025-2030 ($ million)
Data Table on Germany - Market size and forecast 2025-2030 ($ million)
Chart on Germany - Year-over-year growth 2025-2030 (%)
Data Table on Germany - Year-over-year growth 2025-2030 (%)

12.4.2 UK - Market size and forecast 2025-2030

Chart on UK - Market size and forecast 2025-2030 ($ million)
Data Table on UK - Market size and forecast 2025-2030 ($ million)
Chart on UK - Year-over-year growth 2025-2030 (%)
Data Table on UK - Year-over-year growth 2025-2030 (%)

12.4.3 France - Market size and forecast 2025-2030

Chart on France - Market size and forecast 2025-2030 ($ million)
Data Table on France - Market size and forecast 2025-2030 ($ million)
Chart on France - Year-over-year growth 2025-2030 (%)
Data Table on France - Year-over-year growth 2025-2030 (%)

12.4.4 Italy - Market size and forecast 2025-2030

Chart on Italy - Market size and forecast 2025-2030 ($ million)
Data Table on Italy - Market size and forecast 2025-2030 ($ million)
Chart on Italy - Year-over-year growth 2025-2030 (%)
Data Table on Italy - Year-over-year growth 2025-2030 (%)

12.4.5 Spain - Market size and forecast 2025-2030

Chart on Spain - Market size and forecast 2025-2030 ($ million)
Data Table on Spain - Market size and forecast 2025-2030 ($ million)
Chart on Spain - Year-over-year growth 2025-2030 (%)
Data Table on Spain - Year-over-year growth 2025-2030 (%)

12.4.6 The Netherlands - Market size and forecast 2025-2030

Chart on The Netherlands - Market size and forecast 2025-2030 ($ million)
Data Table on The Netherlands - Market size and forecast 2025-2030 ($ million)
Chart on The Netherlands - Year-over-year growth 2025-2030 (%)
Data Table on The Netherlands - Year-over-year growth 2025-2030 (%)

12.5 APAC - Market size and forecast 2025-2030

Chart on APAC - Market size and forecast 2025-2030 ($ million)
Data Table on APAC - Market size and forecast 2025-2030 ($ million)
Chart on APAC - Year-over-year growth 2025-2030 (%)
Data Table on APAC - Year-over-year growth 2025-2030 (%)
Chart on Regional Comparison - APAC
Data Table on Regional Comparison - APAC

12.5.1 China - Market size and forecast 2025-2030

Chart on China - Market size and forecast 2025-2030 ($ million)
Data Table on China - Market size and forecast 2025-2030 ($ million)
Chart on China - Year-over-year growth 2025-2030 (%)
Data Table on China - Year-over-year growth 2025-2030 (%)

12.5.2 Japan - Market size and forecast 2025-2030

Chart on Japan - Market size and forecast 2025-2030 ($ million)
Data Table on Japan - Market size and forecast 2025-2030 ($ million)
Chart on Japan - Year-over-year growth 2025-2030 (%)
Data Table on Japan - Year-over-year growth 2025-2030 (%)

12.5.3 India - Market size and forecast 2025-2030

Chart on India - Market size and forecast 2025-2030 ($ million)
Data Table on India - Market size and forecast 2025-2030 ($ million)
Chart on India - Year-over-year growth 2025-2030 (%)
Data Table on India - Year-over-year growth 2025-2030 (%)

12.5.4 South Korea - Market size and forecast 2025-2030

Chart on South Korea - Market size and forecast 2025-2030 ($ million)
Data Table on South Korea - Market size and forecast 2025-2030 ($ million)
Chart on South Korea - Year-over-year growth 2025-2030 (%)
Data Table on South Korea - Year-over-year growth 2025-2030 (%)

12.5.5 Australia - Market size and forecast 2025-2030

Chart on Australia - Market size and forecast 2025-2030 ($ million)
Data Table on Australia - Market size and forecast 2025-2030 ($ million)
Chart on Australia - Year-over-year growth 2025-2030 (%)
Data Table on Australia - Year-over-year growth 2025-2030 (%)

12.5.6 Indonesia - Market size and forecast 2025-2030

Chart on Indonesia - Market size and forecast 2025-2030 ($ million)
Data Table on Indonesia - Market size and forecast 2025-2030 ($ million)
Chart on Indonesia - Year-over-year growth 2025-2030 (%)
Data Table on Indonesia - Year-over-year growth 2025-2030 (%)

12.6 South America - Market size and forecast 2025-2030

Chart on South America - Market size and forecast 2025-2030 ($ million)
Data Table on South America - Market size and forecast 2025-2030 ($ million)
Chart on South America - Year-over-year growth 2025-2030 (%)
Data Table on South America - Year-over-year growth 2025-2030 (%)
Chart on Regional Comparison - South America
Data Table on Regional Comparison - South America

12.6.1 Brazil - Market size and forecast 2025-2030

Chart on Brazil - Market size and forecast 2025-2030 ($ million)
Data Table on Brazil - Market size and forecast 2025-2030 ($ million)
Chart on Brazil - Year-over-year growth 2025-2030 (%)
Data Table on Brazil - Year-over-year growth 2025-2030 (%)

12.6.2 Argentina - Market size and forecast 2025-2030

Chart on Argentina - Market size and forecast 2025-2030 ($ million)
Data Table on Argentina - Market size and forecast 2025-2030 ($ million)
Chart on Argentina - Year-over-year growth 2025-2030 (%)
Data Table on Argentina - Year-over-year growth 2025-2030 (%)

12.6.3 Chile - Market size and forecast 2025-2030

Chart on Chile - Market size and forecast 2025-2030 ($ million)
Data Table on Chile - Market size and forecast 2025-2030 ($ million)
Chart on Chile - Year-over-year growth 2025-2030 (%)
Data Table on Chile - Year-over-year growth 2025-2030 (%)

12.7 Middle East and Africa - Market size and forecast 2025-2030

Chart on Middle East and Africa - Market size and forecast 2025-2030 ($ million)
Data Table on Middle East and Africa - Market size and forecast 2025-2030 ($ million)
Chart on Middle East and Africa - Year-over-year growth 2025-2030 (%)
Data Table on Middle East and Africa - Year-over-year growth 2025-2030 (%)
Chart on Regional Comparison - Middle East and Africa
Data Table on Regional Comparison - Middle East and Africa

12.7.1 Saudi Arabia - Market size and forecast 2025-2030

Chart on Saudi Arabia - Market size and forecast 2025-2030 ($ million)
Data Table on Saudi Arabia - Market size and forecast 2025-2030 ($ million)
Chart on Saudi Arabia - Year-over-year growth 2025-2030 (%)
Data Table on Saudi Arabia - Year-over-year growth 2025-2030 (%)

12.7.2 UAE - Market size and forecast 2025-2030

Chart on UAE - Market size and forecast 2025-2030 ($ million)
Data Table on UAE - Market size and forecast 2025-2030 ($ million)
Chart on UAE - Year-over-year growth 2025-2030 (%)
Data Table on UAE - Year-over-year growth 2025-2030 (%)

12.7.3 South Africa - Market size and forecast 2025-2030

Chart on South Africa - Market size and forecast 2025-2030 ($ million)
Data Table on South Africa - Market size and forecast 2025-2030 ($ million)
Chart on South Africa - Year-over-year growth 2025-2030 (%)
Data Table on South Africa - Year-over-year growth 2025-2030 (%)

12.7.4 Israel - Market size and forecast 2025-2030

Chart on Israel - Market size and forecast 2025-2030 ($ million)
Data Table on Israel - Market size and forecast 2025-2030 ($ million)
Chart on Israel - Year-over-year growth 2025-2030 (%)
Data Table on Israel - Year-over-year growth 2025-2030 (%)

12.7.5 Turkey - Market size and forecast 2025-2030

Chart on Turkey - Market size and forecast 2025-2030 ($ million)
Data Table on Turkey - Market size and forecast 2025-2030 ($ million)
Chart on Turkey - Year-over-year growth 2025-2030 (%)
Data Table on Turkey - Year-over-year growth 2025-2030 (%)

12.8 Market opportunity by geography

Market opportunity by geography ($ million)
Data Tables on Market opportunity by geography ($ million)

13. Drivers, Challenges, and Opportunity

13.1 Market drivers

Heightened focus on health, hygiene, and workplace safety
Strategic outsourcing and expansion of commercial infrastructure
Technological advancements and automation

13.2 Market challenges

Persistent labor shortages and high employee turnover
Intense price competition and commoditization of services
Navigating complex regulatory and compliance landscape

13.3 Impact of drivers and challenges

Impact of drivers and challenges in 2025 and 2030

13.4 Market opportunities

Growth of smart cleaning solutions
Mainstreaming of sustainability and green cleaning practices
Increasing demand for specialized and integrated facility services

14. Competitive Landscape

14.1 Overview

14.2

Overview on criticality of inputs and factors of differentiation

14.3 Landscape disruption

Overview on factors of disruption

14.4 Industry risks

Impact of key risks on business

15. Competitive Analysis

15.1 Companies profiled

Companies covered

15.2 Company ranking index

15.3 Market positioning of companies

Matrix on companies position and classification

15.4 ABM Industries Inc.

ABM Industries Inc. - Overview
ABM Industries Inc. - Business segments
ABM Industries Inc. - Key offerings
ABM Industries Inc. - Segment focus
SWOT

15.5 Atlas Facilities Management

Atlas Facilities Management - Overview
Atlas Facilities Management - Product / Service
Atlas Facilities Management - Key offerings
SWOT

15.6 BELFOR Holdings Inc.

BELFOR Holdings Inc. - Overview
BELFOR Holdings Inc. - Product / Service
BELFOR Holdings Inc. - Key offerings
SWOT

15.7 Cleaning Services Group Inc.

Cleaning Services Group Inc. - Overview
Cleaning Services Group Inc. - Product / Service
Cleaning Services Group Inc. - Key offerings
SWOT

15.8 Compass Group Plc

Compass Group Plc - Overview
Compass Group Plc - Business segments
Compass Group Plc - Key offerings
Compass Group Plc - Segment focus
SWOT

15.9 Crest Licensing Systems Ltd.

Crest Licensing Systems Ltd. - Overview
Crest Licensing Systems Ltd. - Product / Service
Crest Licensing Systems Ltd. - Key offerings
SWOT

15.10 Cushman and Wakefield Plc

Cushman and Wakefield Plc - Overview
Cushman and Wakefield Plc - Business segments
Cushman and Wakefield Plc - Key offerings
Cushman and Wakefield Plc - Segment focus
SWOT

15.11 ecoserv

ecoserv - Overview
ecoserv - Product / Service
ecoserv - Key offerings
SWOT

15.12 Extra Clean Inc.

Extra Clean Inc. - Overview
Extra Clean Inc. - Product / Service
Extra Clean Inc. - Key offerings
SWOT

15.13 GSN Property Services Co. Ltd.

GSN Property Services Co. Ltd. - Overview
GSN Property Services Co. Ltd. - Product / Service
GSN Property Services Co. Ltd. - Key offerings
SWOT

15.14 ISS AS

ISS AS - Overview
ISS AS - Business segments
ISS AS - Key offerings
ISS AS - Segment focus
SWOT

15.15 Jani King International Inc.

Jani King International Inc. - Overview
Jani King International Inc. - Product / Service
Jani King International Inc. - Key offerings
SWOT

15.16 Jones Lang LaSalle Inc.

Jones Lang LaSalle Inc. - Overview
Jones Lang LaSalle Inc. - Business segments
Jones Lang LaSalle Inc. - Key offerings
Jones Lang LaSalle Inc. - Segment focus
SWOT

15.17 Sodexo SA

Sodexo SA - Overview
Sodexo SA - Business segments
Sodexo SA - Key news
Sodexo SA - Key offerings
Sodexo SA - Segment focus
SWOT

15.18 The ServiceMaster Co. LLC

The ServiceMaster Co. LLC - Overview
The ServiceMaster Co. LLC - Product / Service
The ServiceMaster Co. LLC - Key offerings
SWOT

16. Appendix

16.1 Scope of the report

Market definition
Objectives
Notes and caveats

16.2 Inclusions and exclusions checklist

Inclusions checklist
Exclusions checklist

16.3 Currency conversion rates for US$

16.4 Research methodology

16.5 Data procurement

Information sources

16.6 Data validation

16.7 Validation techniques employed for market sizing

16.8 Data synthesis

16.9 360 degree market analysis

16.10 List of abbreviations

Research Methodology

Technavio presents a detailed picture of the market by way of study, synthesis, and summation of data from multiple sources. The analysts have presented the various facets of the market with a particular focus on identifying the key industry influencers. The data thus presented is comprehensive, reliable, and the result of extensive research, both primary and secondary.

INFORMATION SOURCES

Primary sources

  • Manufacturers and suppliers
  • Channel partners
  • Industry experts
  • Strategic decision makers

Secondary sources

  • Industry journals and periodicals
  • Government data
  • Financial reports of key industry players
  • Historical data
  • Press releases

DATA ANALYSIS

Data Synthesis

  • Collation of data
  • Estimation of key figures
  • Analysis of derived insights

Data Validation

  • Triangulation with data models
  • Reference against proprietary databases
  • Corroboration with industry experts

REPORT WRITING

Qualitative

  • Market drivers
  • Market challenges
  • Market trends
  • Five forces analysis

Quantitative

  • Market size and forecast
  • Market segmentation
  • Geographical insights
  • Competitive landscape

Interested in this report?

Get your sample now to see our research methodology and insights!

Download Now

Frequently Asked Questions

Cleaning Services market growth will increase by USD 24933.6 million during 2026-2030.

The Cleaning Services market is expected to grow at a CAGR of 6.5% during 2026-2030.

Cleaning Services market is segmented by End-user (Commercial, Residential) Type (Floor care, Vacuuming, Maid service, Window cleaning, Others) Product type (Services, Equipment and accessories)

ABM Industries Inc., Aden Group, Anago Cleaning Systems Inc., Atlas Facilities Management, BELFOR Holdings Inc., Cleaning Services Group Inc., Compass Group Plc, Crest Licensing Systems Ltd., Cushman and Wakefield Plc, ecoserv, Extra Clean Inc., GSN Property Services Co. Ltd., Harvard Service Group, ISS AS, Jani King International Inc., Jones Lang LaSalle Inc., Nugent Contract Cleaning, Sodexo SA, The ServiceMaster Co. LLC are a few of the key vendors in the Cleaning Services market.

North America will register the highest growth rate of 40.2% among the other regions. Therefore, the Cleaning Services market in North America is expected to garner significant business opportunities for the vendors during the forecast period.

US, Canada, Mexico, Germany, UK, France, Italy, Spain, The Netherlands, China, Japan, India, South Korea, Australia, Indonesia, Brazil, Argentina, Chile, Saudi Arabia, UAE, South Africa, Israel, Turkey

  • Heightened focus on health, hygiene, and workplace safety is the driving factor this market.

The Cleaning Services market vendors should focus on grabbing business opportunities from the End-user segment as it accounted for the largest market share in the base year.