Clean Energy Technologies Market Analysis, Size, and Forecast 2025-2029: North America (US and Canada), Europe (France, Germany, Spain, and UK), Middle East and Africa (South Africa), APAC (China and India), South America (Brazil), and Rest of World (ROW)

Clean Energy Technologies Market Analysis, Size, and Forecast 2025-2029:
North America (US and Canada), Europe (France, Germany, Spain, and UK), Middle East and Africa (South Africa), APAC (China and India), South America (Brazil), and Rest of World (ROW)

Published: Jul 2025 228 Pages SKU: IRTNTR71945

Market Overview at a Glance

$99.40 B
Market Opportunity
5.6%
CAGR
5.3
YoY growth 2024-2025(%)

Clean Energy Technologies Market Size 2025-2029

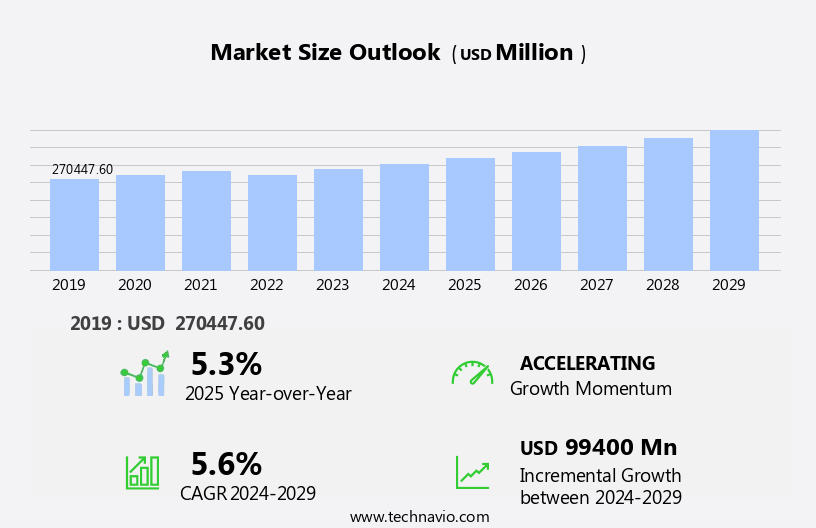
The clean energy technologies market size is forecast to increase by USD 99.4 billion, at a CAGR of 5.6% between 2024 and 2029.

  • The market is experiencing significant growth, fueled by increasing investments in renewable energy solutions. This trend is driven by the global shift towards sustainable energy sources and the need to reduce carbon emissions. A notable development in the market is the growing popularity of hybrid power projects, which combine multiple renewable energy sources to ensure a consistent power supply and improve overall efficiency. However, the market faces challenges as well. Similarly, smart grids, which rely on supervisory control and data acquisition (SCADA) systems for monitoring and controlling infrastructure, are increasingly vulnerable to cyber-attacks.
  • Additionally, regulatory frameworks and infrastructure development vary across regions, creating complexities for market players. To capitalize on opportunities and navigate challenges effectively, companies in the market must focus on technological advancements, cost competitiveness, and strategic partnerships. Competition from other sources of energy, such as fossil fuels, remains strong, necessitating continuous innovation and cost competitiveness for clean energy technologies to gain market share. To mitigate this, advancements in energy storage technology are being explored to ensure a consistent power supply.

What will be the Size of the Clean Energy Technologies Market during the forecast period?

Clean Energy Technologies Market Size

Explore in-depth regional segment analysis with market size data - historical 2019-2023 and forecasts 2025-2029 - in the full report.  
Request Free Sample

The market continues to evolve, driven by advancements in various sectors. Nuclear fusion research promises a potential game-changer in the energy landscape, while electric vehicle charging stations proliferate, enabling the mass adoption of zero-emission transportation. Tidal energy converters and waste-to-energy plants are making strides in harnessing untapped renewable resources, contributing to a more sustainable energy mix. Building integrated PV systems and concentrated solar power installations are transforming architecture and energy production, merging aesthetics and efficiency. Renewable energy integration and distributed generation are becoming the norm, with solar photovoltaic cells and grid-scale batteries leading the charge. Energy efficiency audits and energy modeling software help businesses optimize their energy usage, reducing costs and carbon footprints.

Renewable energy credits, thermal energy storage, and offshore wind farms are key components of the evolving energy landscape. Hydrogen fuel production, biomass energy conversion, and fuel cell technology offer promising alternatives to traditional fossil fuels. Carbon capture methods, smart home energy, and energy auditing tools are essential in the transition to a low-carbon economy. Demand response programs and wave energy technology are innovative solutions addressing energy demand flexibility and harnessing the power of the oceans. Energy management systems, solar thermal power, and smart grid technologies are essential in ensuring a reliable and efficient energy infrastructure. Microgrid infrastructure and energy storage solutions are crucial in ensuring energy security and resilience.

According to industry reports, the market is expected to grow by over 10% annually, driven by increasing global energy demand and the need for sustainable solutions. For instance, a leading European utility reported a 25% increase in renewable energy capacity in the last five years. The continuous dynamism of the market underscores the importance of staying informed and adaptable in this ever-changing landscape.

How is this Clean Energy Technologies Industry segmented?

The clean energy technologies industry research report provides comprehensive data (region-wise segment analysis), with forecasts and estimates in "USD million" for the period 2025-2029, as well as historical data from 2019-2023 for the following segments.

  • Technology
    • Hydropower
    • Clean coal
    • Wind
    • Solar
    • Others
  • End-user
    • Industrial
    • Residential
    • Commercial
  • Deployment
    • On-grid
    • Off-grid
    • Hybrid systems
  • Geography
    • North America
      • US
      • Canada
    • Europe
      • France
      • Germany
      • Spain
      • UK
    • Middle East and Africa
      • South Africa
    • APAC
      • China
      • India
    • South America
      • Brazil
    • Rest of World (ROW)

By Technology Insights

The Hydropower segment is estimated to witness significant growth during the forecast period. The market is witnessing significant advancements in various sectors, including hydropower, nuclear fusion research, electric vehicle charging, tidal energy converters, waste-to-energy plants, building integrated photovoltaics, concentrated solar power, green building design, energy storage solutions, hydroelectric power plants, wind turbine efficiency, and power electronics devices. Hydropower, as a mature and reliable renewable energy source, continues to play a crucial role in the market. This technology harnesses the kinetic energy of flowing water, typically from rivers, dams, or reservoirs, to generate electricity with minimal greenhouse gas emissions. Hydropower's ability to provide baseload power, unlike intermittent sources like solar and wind, makes it essential for stabilizing energy grids and ensuring energy security. Furthermore, pumped-storage hydropower systems enable energy storage, enhancing grid flexibility and facilitating the integration of variable renewables.

Advancements in small-scale and run-of-river hydropower systems are expanding clean energy access to remote and underserved regions. Innovations in turbine design and environmental mitigation measures are also reducing ecological impacts, making hydropower a sustainable and attractive energy solution. Meanwhile, nuclear fusion research holds immense potential for future clean energy generation, with ongoing efforts to develop this technology as a viable alternative to traditional nuclear power. Electric vehicle charging infrastructure is growing rapidly, driven by the increasing adoption of electric vehicles and the need for sustainable transportation. Tidal energy converters, waste-to-energy plants, and geothermal energy systems are also gaining traction in the market, offering unique solutions for clean energy generation and waste management. Building integrated photovoltaics, concentrated solar power, and solar thermal power are essential components of the solar energy sector, driving innovation and efficiency in solar energy production.

Clean Energy Technologies Market Size

Request Free Sample

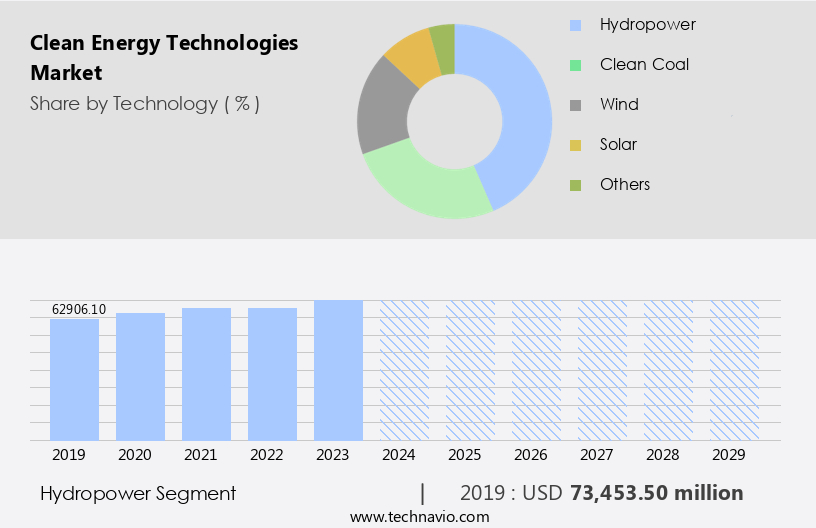
The Hydropower segment was valued at USD 73.45 billion in 2019 and showed a gradual increase during the forecast period.

The Clean Energy Technologies Market is rapidly evolving, driven by a global push for carbon footprint reduction and sustainable development. Analyzing energy consumption patterns helps optimize resource usage and identify key sectors for improvement. The widespread smart meter deployment empowers consumers to monitor and manage energy use in real-time. Accelerating electric vehicle adoption contributes significantly to emissions reduction and urban air quality. Government and private sector initiatives are ramping up energy innovation funding, fostering breakthrough technologies in solar, wind, and battery storage. Renewable energy integration, energy modeling software, energy efficiency audits, and energy management systems are crucial for optimizing energy usage and integrating renewable energy sources into existing energy grids.

Grid-scale batteries, thermal energy storage, and hydroelectric power plants are essential for energy storage and grid flexibility. Advancements in offshore wind farms, hydrogen fuel production, biomass energy conversion, fuel cell technology, carbon capture methods, and smart grid technologies are addressing the challenges of intermittent renewable energy sources and reducing greenhouse gas emissions. Wave energy technology, demand response programs, and microgrid infrastructure are further expanding the scope of clean energy solutions. Energy storage solutions, such as batteries and thermal energy storage, are essential for grid flexibility and the integration of renewable energy sources. Wind turbine efficiency improvements and power electronics devices are enhancing the performance and reliability of wind energy systems.

The market is witnessing a balanced blend of technological advancements, innovative solutions, and growing demand for sustainable energy sources. The integration of various clean energy technologies, from hydropower and nuclear fusion research to electric vehicle charging and renewable energy integration, is creating a more sustainable and efficient energy landscape.

Regional Analysis

APAC is estimated to contribute 36% to the growth of the global market during the forecast period. Technavio's analysts have elaborately explained the regional trends and drivers that shape the market during the forecast period.

Clean Energy Technologies Market Share by Geography

 Request Free Sample

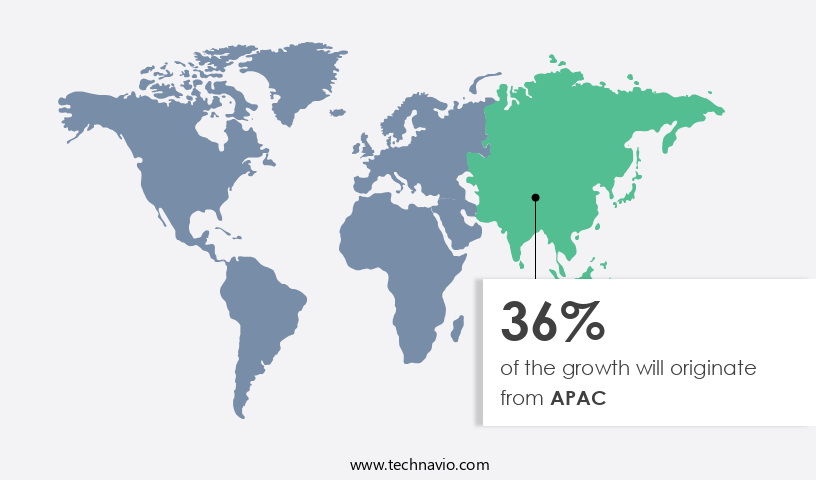
In the global energy landscape, the Asia-Pacific region, spearheaded by China, India, and Japan, remains a significant contributor to the world's energy demand, fueled by economic expansion and population growth. Simultaneously, energy-related carbon dioxide emissions reached an unprecedented 37.8 gigatonnes in 2024, with a considerable portion originating from APAC countries due to the continued reliance on coal and natural gas. Despite international efforts to shift towards cleaner energy sources, global emissions rose by 0.8% compared to the previous year, underscoring the complexity of striking a balance between development and sustainability. In response to this challenge, many Asian nations have expedited the implementation of renewable energy technologies, with varying degrees of success.

Solar photovoltaic (PV) cells, a key component of this transition, are projected to experience ongoing price declines through 2030, fueled by intensifying global competition and escalating manufacturing capacity, particularly in China, which dominates over 80% of the global solar PV supply chain. Meanwhile, the integration of renewable energy into existing power grids poses another significant hurdle. Innovations in energy storage solutions, such as grid-scale batteries, thermal energy storage, and pumped hydroelectric storage, are crucial to addressing the intermittency issues associated with solar and wind energy. Furthermore, the adoption of smart grid technologies, microgrids, and demand response programs is essential for optimizing energy consumption and ensuring grid stability.

Beyond solar PV, other clean energy technologies, such as concentrated solar power, wind turbines, hydroelectric power, geothermal energy systems, and biomass energy conversion, are gaining traction. Fuel cell technology, carbon capture methods, and hydrogen fuel production are also emerging as promising solutions to decarbonize various industries. Moreover, the shift towards green building design and energy efficiency audits is essential for reducing energy consumption in the building sector. Energy modeling software, energy auditing tools, and energy management systems are instrumental in optimizing energy usage and identifying potential savings. Tidal energy converters, wave energy technology, and offshore wind farms represent the next frontier in renewable energy, offering immense potential to diversify the energy mix and reduce dependence on fossil fuels.

The ongoing collaboration between governments, industry players, and research institutions will be instrumental in accelerating the transition to a clean energy economy.

Market Dynamics

Our researchers analyzed the data with 2024 as the base year, along with the key drivers, trends, and challenges. A holistic analysis of drivers will help companies refine their marketing strategies to gain a competitive advantage.

What are the key market drivers leading to the rise in the adoption of Clean Energy Technologies Industry?

  • The significant growth in investments towards clean energy technologies serves as the primary catalyst for market expansion. The global meal replacement market is witnessing notable expansion, fueled by several key factors. Consumers' increasing health consciousness and busy lifestyles have led to a growing demand for convenient, nutritious meal alternatives. Moreover, the rising trend of veganism and vegetarianism is further boosting market growth. According to a recent report, the meal replacement market is projected to expand at a significant rate, reaching a value of over USD7 billion by 2027. One notable example of market growth can be seen in the plant-based meal replacement sector. In 2020, sales of plant-based meal replacement products increased by 45% compared to the previous year.
  • This trend is expected to continue as consumers seek more sustainable and ethical food options. Furthermore, advancements in technology have enabled the development of meal replacement products with improved taste, texture, and nutritional value, making them increasingly appealing to a wider audience. Additionally, the meal replacement market is benefiting from the increasing investment in research and development. According to a survey, over 60% of companies operating in the meal replacement industry plan to increase their R&D spending in the next five years. This investment is expected to lead to the launch of innovative products and improved manufacturing processes, further driving market growth.

What are the market trends shaping the Clean Energy Technologies Industry?

  • The rising preference for hybrid power projects represents a significant market trend in the energy sector. Hybrid power projects, which combine renewable energy sources with traditional power generation methods, are increasingly being adopted due to their efficiency and environmental benefits. The market is experiencing notable growth as hybrid power projects gain popularity. These systems, which integrate multiple renewable energy sources like solar, wind, hydro, and energy storage, address intermittency issues and optimize energy generation in varying conditions.
  • According to recent studies, sales of hybrid power systems are projected to increase by 25% annually, reflecting the market's dynamic nature. The market is poised for significant expansion, driven by the need for sustainable, efficient, and resilient energy solutions. This integration enhances grid stability, lessens reliance on fossil fuels, and supports the shift towards low-carbon economies. Technological advancements, cost reductions in renewable components, and supportive government policies are fueling this trend. In regions with unreliable grid infrastructure or remote locations, hybrid systems offer a dependable and cost-effective alternative to traditional energy sources.

What challenges does the Clean Energy Technologies Industry face during its growth?

  • The growth of the industry is significantly influenced by the intense competition posed by various alternative energy sources. The global meal replacement market faces substantial challenges due to the high cost of production and limited consumer acceptance, particularly in developed economies where consumers prioritize whole foods and convenience. Meal replacement products often require advanced manufacturing capabilities, specialized ingredients, and extensive marketing efforts, which can drive up costs and limit market penetration. However, the market is experiencing robust growth, fueled by several key drivers.
  • According to a recent report, the global meal replacement market is projected to grow by over 6% annually between 2022 and 2027. For instance, sales of meal replacement shakes in the US increased by 12% in 2021 compared to the previous year, reflecting the growing consumer interest in healthier, more convenient food options. The increasing prevalence of obesity and related health issues, coupled with busy lifestyles and a growing awareness of the benefits of nutrient-dense, convenient food alternatives, are driving demand. Furthermore, technological advancements in food processing and ingredient sourcing are reducing production costs and improving product quality.

Exclusive Customer Landscape

The clean energy technologies market forecasting report includes the adoption lifecycle of the market, covering from the innovator's stage to the laggard's stage. It focuses on adoption rates in different regions based on penetration. Furthermore, the clean energy technologies market report also includes key purchase criteria and drivers of price sensitivity to help companies evaluate and develop their market growth analysis strategies.

Clean Energy Technologies Market Share by Geography

 Customer Landscape

Key Companies & Market Insights

Companies are implementing various strategies, such as strategic alliances, clean energy technologies market forecast, partnerships, mergers and acquisitions, geographical expansion, and product/service launches, to enhance their presence in the industry.

ABB Ltd. - The company specializes in advanced hydroelectric power technology, delivering clean energy solutions.

The industry research and growth report includes detailed analyses of the competitive landscape of the market and information about key companies, including:

  • ABB Ltd.
  • Acciona SA
  • Canadian Solar Inc.
  • Enercon Services Inc.
  • Envision Group
  • First Solar Inc.
  • General Electric Co.
  • Invenergy
  • JA Solar Technology Co. Ltd.
  • JinkoSolar Holding Co. Ltd.
  • Mitsubishi Heavy Industries Ltd.
  • Senvion Wind Technology Pvt. Ltd.
  • Shanghai Electric Group Co.
  • Shanghai Taisheng Wind Power Equipment Co. Ltd.
  • Siemens AG
  • Sinovel Wind Group Co. Ltd.
  • Tata Sons Pvt. Ltd.
  • Vestas Wind Systems AS
  • Xcel Energy Inc.
  • Xinjiang Goldwind Science and Technology Co. Ltd.

Qualitative and quantitative analysis of companies has been conducted to help clients understand the wider business environment as well as the strengths and weaknesses of key industry players. Data is qualitatively analyzed to categorize companies as pure play, category-focused, industry-focused, and diversified; it is quantitatively analyzed to categorize companies as dominant, leading, strong, tentative, and weak.

Recent Development and News in Clean Energy Technologies Market

  • In January 2024, SunPower Corporation, a leading solar technology company, announced the launch of its Maxeon 4 Series solar panels, boasting record-breaking efficiency levels of up to 22.8% and a 30% increase in energy production compared to previous models (SunPower Press Release).
  • In March 2024, Tesla, Inc. and Panasonic Corporation signed a memorandum of understanding to expand their collaboration in battery production for Tesla's energy storage solutions, aiming to increase production capacity by 50% (Tesla Press Release).
  • In April 2025, First Solar, Inc. secured a USD 1.2 billion loan from the U.S. Department of Energy's Loan Programs Office to finance the construction of a new 2.3 GW solar manufacturing plant in the United States, marking a significant investment in domestic clean energy production (First Solar Press Release).
  • In May 2025, the European Union passed the REPowerEU Plan, a comprehensive policy initiative to reduce the EU's dependence on Russian fossil fuels and accelerate the transition to renewable energy, setting a target of increasing renewable energy capacity by 45% by 2030 (European Commission Press Release).

Research Analyst Overview

The market for clean energy technologies continues to evolve, driven by the growing demand for sustainable energy sources and the implementation of energy conservation measures. Wind energy potential is being harnessed through the installation of new turbines, with global installations reaching over 700 GW in 2020, representing a 12% increase from the previous year. Energy transmission lines are being upgraded to facilitate the integration of renewable energy into the grid, while energy data analytics helps optimize the distribution and consumption of clean energy. Green energy investment is on the rise, with companies allocating significant funds towards the development of clean energy infrastructure.

The sustainable development goals, including energy independence goals and grid modernization projects, are driving the adoption of renewable energy policy and innovation funding. Building energy modeling and energy efficiency upgrades are essential components of the transition to a low-carbon economy. Power system stability is a critical concern as the share of renewable energy in the grid increases. Peak demand reduction through energy efficiency upgrades and the deployment of smart meters is becoming increasingly important. The adoption of electric vehicles, hydrogen storage tanks, and solar panel installation is contributing to the reduction of carbon footprints and the mitigation of climate change. Geothermal heat pumps and renewable portfolio standards are playing a role in the transition to a clean energy future.

Energy security strategies are being reevaluated as countries seek to reduce their reliance on fossil fuels. The clean energy market is expected to grow by over 10% annually, according to industry estimates, as the world continues to prioritize climate change mitigation and environmental impact assessment. The integration of these technologies into the energy market will require substantial investment and collaboration between governments, industry players, and research institutions. The global clean energy market is undergoing a transformative period, driven by the need to address climate change, reduce dependence on fossil fuels, and meet increasing energy demands. The integration of various clean energy technologies, including solar PV, concentrated solar power, wind energy, geothermal energy, hydroelectric power, and biomass energy conversion, is essential to ensuring a sustainable energy future. Innovations in energy storage solutions, smart grid technologies, and microgrid infrastructure are crucial for addressing the intermittency challenges associated with renewable energy sources.

Dive into Technavio's robust research methodology, blending expert interviews, extensive data synthesis, and validated models for unparalleled Clean Energy Technologies Market insights. See full methodology.

Market Scope

Report Coverage

Details

Page number

228

Base year

2024

Historic period

2019-2023

Forecast period

2025-2029

Growth momentum & CAGR

Accelerate at a CAGR of 5.6%

Market growth 2025-2029

USD 99.4 billion

Market structure

Fragmented

YoY growth 2024-2025(%)

5.3

Key countries

US, China, Germany, UK, Brazil, India, Canada, Spain, South Africa, and France

Competitive landscape

Leading Companies, Market Positioning of Companies, Competitive Strategies, and Industry Risks

Request Free Sample

What are the Key Data Covered in this Clean Energy Technologies Market Research and Growth Report?

  • CAGR of the Clean Energy Technologies industry during the forecast period
  • Detailed information on factors that will drive the growth and forecasting between 2025 and 2029
  • Precise estimation of the size of the market and its contribution of the industry in focus to the parent market
  • Accurate predictions about upcoming growth and trends and changes in consumer behaviour
  • Growth of the market across APAC, Europe, North America, South America, and Middle East and Africa
  • Thorough analysis of the market's competitive landscape and detailed information about companies
  • Comprehensive analysis of factors that will challenge the clean energy technologies market growth of industry companies

We can help! Our analysts can customize this clean energy technologies market research report to meet your requirements.

Get in touch

1 Executive Summary

  • 1.1 Market overview
    • Executive Summary - Chart on Market Overview
    • Executive Summary - Data Table on Market Overview
    • Executive Summary - Chart on Global Market Characteristics
    • Executive Summary - Chart on Market by Geography
    • Executive Summary - Chart on Market Segmentation by Technology
    • Executive Summary - Chart on Market Segmentation by End-user
    • Executive Summary - Chart on Market Segmentation by Deployment
    • Executive Summary - Chart on Incremental Growth
    • Executive Summary - Data Table on Incremental Growth
    • Executive Summary - Chart on Company Market Positioning

2 Technavio Analysis

  • 2.1 Analysis of price sensitivity, lifecycle, customer purchase basket, adoption rates, and purchase criteria
    • Analysis of price sensitivity, lifecycle, customer purchase basket, adoption rates, and purchase criteria
  • 2.2 Criticality of inputs and Factors of differentiation
    • Overview on criticality of inputs and factors of differentiation
  • 2.3 Factors of disruption
    • Overview on factors of disruption
  • 2.4 Impact of drivers and challenges
    • Impact of drivers and challenges in 2024 and 2029

3 Market Landscape

  • 3.1 Market ecosystem
    • Parent Market
    • Data Table on - Parent Market
  • 3.2 Market characteristics
    • Market characteristics analysis
  • 3.3 Value chain analysis
    • Value chain analysis

4 Market Sizing

  • 4.1 Market definition
    • Offerings of companies included in the market definition
  • 4.2 Market segment analysis
    • Market segments
  • 4.3 Market size 2024
    • 4.4 Market outlook: Forecast for 2024-2029
      • Chart on Global - Market size and forecast 2024-2029 ($ million)
      • Data Table on Global - Market size and forecast 2024-2029 ($ million)
      • Chart on Global Market: Year-over-year growth 2024-2029 (%)
      • Data Table on Global Market: Year-over-year growth 2024-2029 (%)

    5 Historic Market Size

    • 5.1 Global Clean Energy Technologies Market 2019 - 2023
      • Historic Market Size - Data Table on Global Clean Energy Technologies Market 2019 - 2023 ($ million)
    • 5.2 Technology segment analysis 2019 - 2023
      • Historic Market Size - Technology Segment 2019 - 2023 ($ million)
    • 5.3 End-user segment analysis 2019 - 2023
      • Historic Market Size - End-user Segment 2019 - 2023 ($ million)
    • 5.4 Deployment segment analysis 2019 - 2023
      • Historic Market Size - Deployment Segment 2019 - 2023 ($ million)
    • 5.5 Geography segment analysis 2019 - 2023
      • Historic Market Size - Geography Segment 2019 - 2023 ($ million)
    • 5.6 Country segment analysis 2019 - 2023
      • Historic Market Size - Country Segment 2019 - 2023 ($ million)

    6 Qualitative Analysis

    • 6.1 The AI impact on Global Clean Energy Technologies Market

      7 Five Forces Analysis

      • 7.1 Five forces summary
        • Five forces analysis - Comparison between 2024 and 2029
      • 7.2 Bargaining power of buyers
        • Bargaining power of buyers - Impact of key factors 2024 and 2029
      • 7.3 Bargaining power of suppliers
        • Bargaining power of suppliers - Impact of key factors in 2024 and 2029
      • 7.4 Threat of new entrants
        • Threat of new entrants - Impact of key factors in 2024 and 2029
      • 7.5 Threat of substitutes
        • Threat of substitutes - Impact of key factors in 2024 and 2029
      • 7.6 Threat of rivalry
        • Threat of rivalry - Impact of key factors in 2024 and 2029
      • 7.7 Market condition
        • Chart on Market condition - Five forces 2024 and 2029

      8 Market Segmentation by Technology

      • 8.1 Market segments
        • Chart on Technology - Market share 2024-2029 (%)
        • Data Table on Technology - Market share 2024-2029 (%)
      • 8.2 Comparison by Technology
        • Chart on Comparison by Technology
        • Data Table on Comparison by Technology
      • 8.3 Hydropower - Market size and forecast 2024-2029
        • Chart on Hydropower - Market size and forecast 2024-2029 ($ million)
        • Data Table on Hydropower - Market size and forecast 2024-2029 ($ million)
        • Chart on Hydropower - Year-over-year growth 2024-2029 (%)
        • Data Table on Hydropower - Year-over-year growth 2024-2029 (%)
      • 8.4 Clean coal - Market size and forecast 2024-2029
        • Chart on Clean coal - Market size and forecast 2024-2029 ($ million)
        • Data Table on Clean coal - Market size and forecast 2024-2029 ($ million)
        • Chart on Clean coal - Year-over-year growth 2024-2029 (%)
        • Data Table on Clean coal - Year-over-year growth 2024-2029 (%)
      • 8.5 Wind - Market size and forecast 2024-2029
        • Chart on Wind - Market size and forecast 2024-2029 ($ million)
        • Data Table on Wind - Market size and forecast 2024-2029 ($ million)
        • Chart on Wind - Year-over-year growth 2024-2029 (%)
        • Data Table on Wind - Year-over-year growth 2024-2029 (%)
      • 8.6 Solar - Market size and forecast 2024-2029
        • Chart on Solar - Market size and forecast 2024-2029 ($ million)
        • Data Table on Solar - Market size and forecast 2024-2029 ($ million)
        • Chart on Solar - Year-over-year growth 2024-2029 (%)
        • Data Table on Solar - Year-over-year growth 2024-2029 (%)
      • 8.7 Others - Market size and forecast 2024-2029
        • Chart on Others - Market size and forecast 2024-2029 ($ million)
        • Data Table on Others - Market size and forecast 2024-2029 ($ million)
        • Chart on Others - Year-over-year growth 2024-2029 (%)
        • Data Table on Others - Year-over-year growth 2024-2029 (%)
      • 8.8 Market opportunity by Technology
        • Market opportunity by Technology ($ million)
        • Data Table on Market opportunity by Technology ($ million)

      9 Market Segmentation by End-user

      • 9.1 Market segments
        • Chart on End-user - Market share 2024-2029 (%)
        • Data Table on End-user - Market share 2024-2029 (%)
      • 9.2 Comparison by End-user
        • Chart on Comparison by End-user
        • Data Table on Comparison by End-user
      • 9.3 Industrial - Market size and forecast 2024-2029
        • Chart on Industrial - Market size and forecast 2024-2029 ($ million)
        • Data Table on Industrial - Market size and forecast 2024-2029 ($ million)
        • Chart on Industrial - Year-over-year growth 2024-2029 (%)
        • Data Table on Industrial - Year-over-year growth 2024-2029 (%)
      • 9.4 Residential - Market size and forecast 2024-2029
        • Chart on Residential - Market size and forecast 2024-2029 ($ million)
        • Data Table on Residential - Market size and forecast 2024-2029 ($ million)
        • Chart on Residential - Year-over-year growth 2024-2029 (%)
        • Data Table on Residential - Year-over-year growth 2024-2029 (%)
      • 9.5 Commercial - Market size and forecast 2024-2029
        • Chart on Commercial - Market size and forecast 2024-2029 ($ million)
        • Data Table on Commercial - Market size and forecast 2024-2029 ($ million)
        • Chart on Commercial - Year-over-year growth 2024-2029 (%)
        • Data Table on Commercial - Year-over-year growth 2024-2029 (%)
      • 9.6 Market opportunity by End-user
        • Market opportunity by End-user ($ million)
        • Data Table on Market opportunity by End-user ($ million)

      10 Market Segmentation by Deployment

      • 10.1 Market segments
        • Chart on Deployment - Market share 2024-2029 (%)
        • Data Table on Deployment - Market share 2024-2029 (%)
      • 10.2 Comparison by Deployment
        • Chart on Comparison by Deployment
        • Data Table on Comparison by Deployment
      • 10.3 On-grid - Market size and forecast 2024-2029
        • Chart on On-grid - Market size and forecast 2024-2029 ($ million)
        • Data Table on On-grid - Market size and forecast 2024-2029 ($ million)
        • Chart on On-grid - Year-over-year growth 2024-2029 (%)
        • Data Table on On-grid - Year-over-year growth 2024-2029 (%)
      • 10.4 Off-grid - Market size and forecast 2024-2029
        • Chart on Off-grid - Market size and forecast 2024-2029 ($ million)
        • Data Table on Off-grid - Market size and forecast 2024-2029 ($ million)
        • Chart on Off-grid - Year-over-year growth 2024-2029 (%)
        • Data Table on Off-grid - Year-over-year growth 2024-2029 (%)
      • 10.5 Hybrid systems - Market size and forecast 2024-2029
        • Chart on Hybrid systems - Market size and forecast 2024-2029 ($ million)
        • Data Table on Hybrid systems - Market size and forecast 2024-2029 ($ million)
        • Chart on Hybrid systems - Year-over-year growth 2024-2029 (%)
        • Data Table on Hybrid systems - Year-over-year growth 2024-2029 (%)
      • 10.6 Market opportunity by Deployment
        • Market opportunity by Deployment ($ million)
        • Data Table on Market opportunity by Deployment ($ million)

      11 Customer Landscape

      • 11.1 Customer landscape overview
        • Analysis of price sensitivity, lifecycle, customer purchase basket, adoption rates, and purchase criteria

      12 Geographic Landscape

      • 12.1 Geographic segmentation
        • Chart on Market share by geography 2024-2029 (%)
        • Data Table on Market share by geography 2024-2029 (%)
      • 12.2 Geographic comparison
        • Chart on Geographic comparison
        • Data Table on Geographic comparison
      • 12.3 APAC - Market size and forecast 2024-2029
        • Chart on APAC - Market size and forecast 2024-2029 ($ million)
        • Data Table on APAC - Market size and forecast 2024-2029 ($ million)
        • Chart on APAC - Year-over-year growth 2024-2029 (%)
        • Data Table on APAC - Year-over-year growth 2024-2029 (%)
      • 12.4 Europe - Market size and forecast 2024-2029
        • Chart on Europe - Market size and forecast 2024-2029 ($ million)
        • Data Table on Europe - Market size and forecast 2024-2029 ($ million)
        • Chart on Europe - Year-over-year growth 2024-2029 (%)
        • Data Table on Europe - Year-over-year growth 2024-2029 (%)
      • 12.5 North America - Market size and forecast 2024-2029
        • Chart on North America - Market size and forecast 2024-2029 ($ million)
        • Data Table on North America - Market size and forecast 2024-2029 ($ million)
        • Chart on North America - Year-over-year growth 2024-2029 (%)
        • Data Table on North America - Year-over-year growth 2024-2029 (%)
      • 12.6 South America - Market size and forecast 2024-2029
        • Chart on South America - Market size and forecast 2024-2029 ($ million)
        • Data Table on South America - Market size and forecast 2024-2029 ($ million)
        • Chart on South America - Year-over-year growth 2024-2029 (%)
        • Data Table on South America - Year-over-year growth 2024-2029 (%)
      • 12.7 Middle East and Africa - Market size and forecast 2024-2029
        • Chart on Middle East and Africa - Market size and forecast 2024-2029 ($ million)
        • Data Table on Middle East and Africa - Market size and forecast 2024-2029 ($ million)
        • Chart on Middle East and Africa - Year-over-year growth 2024-2029 (%)
        • Data Table on Middle East and Africa - Year-over-year growth 2024-2029 (%)
      • 12.8 US - Market size and forecast 2024-2029
        • Chart on US - Market size and forecast 2024-2029 ($ million)
        • Data Table on US - Market size and forecast 2024-2029 ($ million)
        • Chart on US - Year-over-year growth 2024-2029 (%)
        • Data Table on US - Year-over-year growth 2024-2029 (%)
      • 12.9 China - Market size and forecast 2024-2029
        • Chart on China - Market size and forecast 2024-2029 ($ million)
        • Data Table on China - Market size and forecast 2024-2029 ($ million)
        • Chart on China - Year-over-year growth 2024-2029 (%)
        • Data Table on China - Year-over-year growth 2024-2029 (%)
      • 12.10 Germany - Market size and forecast 2024-2029
        • Chart on Germany - Market size and forecast 2024-2029 ($ million)
        • Data Table on Germany - Market size and forecast 2024-2029 ($ million)
        • Chart on Germany - Year-over-year growth 2024-2029 (%)
        • Data Table on Germany - Year-over-year growth 2024-2029 (%)
      • 12.11 UK - Market size and forecast 2024-2029
        • Chart on UK - Market size and forecast 2024-2029 ($ million)
        • Data Table on UK - Market size and forecast 2024-2029 ($ million)
        • Chart on UK - Year-over-year growth 2024-2029 (%)
        • Data Table on UK - Year-over-year growth 2024-2029 (%)
      • 12.12 Brazil - Market size and forecast 2024-2029
        • Chart on Brazil - Market size and forecast 2024-2029 ($ million)
        • Data Table on Brazil - Market size and forecast 2024-2029 ($ million)
        • Chart on Brazil - Year-over-year growth 2024-2029 (%)
        • Data Table on Brazil - Year-over-year growth 2024-2029 (%)
      • 12.13 India - Market size and forecast 2024-2029
        • Chart on India - Market size and forecast 2024-2029 ($ million)
        • Data Table on India - Market size and forecast 2024-2029 ($ million)
        • Chart on India - Year-over-year growth 2024-2029 (%)
        • Data Table on India - Year-over-year growth 2024-2029 (%)
      • 12.14 Canada - Market size and forecast 2024-2029
        • Chart on Canada - Market size and forecast 2024-2029 ($ million)
        • Data Table on Canada - Market size and forecast 2024-2029 ($ million)
        • Chart on Canada - Year-over-year growth 2024-2029 (%)
        • Data Table on Canada - Year-over-year growth 2024-2029 (%)
      • 12.15 Spain - Market size and forecast 2024-2029
        • Chart on Spain - Market size and forecast 2024-2029 ($ million)
        • Data Table on Spain - Market size and forecast 2024-2029 ($ million)
        • Chart on Spain - Year-over-year growth 2024-2029 (%)
        • Data Table on Spain - Year-over-year growth 2024-2029 (%)
      • 12.16 South Africa - Market size and forecast 2024-2029
        • Chart on South Africa - Market size and forecast 2024-2029 ($ million)
        • Data Table on South Africa - Market size and forecast 2024-2029 ($ million)
        • Chart on South Africa - Year-over-year growth 2024-2029 (%)
        • Data Table on South Africa - Year-over-year growth 2024-2029 (%)
      • 12.17 France - Market size and forecast 2024-2029
        • Chart on France - Market size and forecast 2024-2029 ($ million)
        • Data Table on France - Market size and forecast 2024-2029 ($ million)
        • Chart on France - Year-over-year growth 2024-2029 (%)
        • Data Table on France - Year-over-year growth 2024-2029 (%)
      • 12.18 Market opportunity by geography
        • Market opportunity by geography ($ million)
        • Data Tables on Market opportunity by geography ($ million)

      13 Drivers, Challenges, and Opportunity/Restraints

      • 13.1 Market drivers
        • 13.2 Market challenges
          • 13.3 Impact of drivers and challenges
            • Impact of drivers and challenges in 2024 and 2029
          • 13.4 Market opportunities/restraints

            14 Competitive Landscape

            • 14.1 Overview
              • 14.2 Competitive Landscape
                • Overview on criticality of inputs and factors of differentiation
              • 14.3 Landscape disruption
                • Overview on factors of disruption
              • 14.4 Industry risks
                • Impact of key risks on business

              15 Competitive Analysis

              • 15.1 Companies profiled
                • Companies covered
              • 15.2 Company ranking index
                • Company ranking index
              • 15.3 Market positioning of companies
                • Matrix on companies position and classification
              • 15.4 Acciona SA
                • Acciona SA - Overview
                • Acciona SA - Business segments
                • Acciona SA - Key news
                • Acciona SA - Key offerings
                • Acciona SA - Segment focus
                • SWOT
              • 15.5 Envision Group
                • Envision Group - Overview
                • Envision Group - Product / Service
                • Envision Group - Key offerings
                • SWOT
              • 15.6 General Electric Co.
                • General Electric Co. - Overview
                • General Electric Co. - Business segments
                • General Electric Co. - Key news
                • General Electric Co. - Key offerings
                • General Electric Co. - Segment focus
                • SWOT
              • 15.7 Invenergy
                • Invenergy - Overview
                • Invenergy - Product / Service
                • Invenergy - Key offerings
                • SWOT
              • 15.8 JA Solar Technology Co. Ltd.
                • JA Solar Technology Co. Ltd. - Overview
                • JA Solar Technology Co. Ltd. - Product / Service
                • JA Solar Technology Co. Ltd. - Key news
                • JA Solar Technology Co. Ltd. - Key offerings
                • SWOT
              • 15.9 JinkoSolar Holding Co. Ltd.
                • JinkoSolar Holding Co. Ltd. - Overview
                • JinkoSolar Holding Co. Ltd. - Product / Service
                • JinkoSolar Holding Co. Ltd. - Key news
                • JinkoSolar Holding Co. Ltd. - Key offerings
                • SWOT
              • 15.10 Mitsubishi Heavy Industries Ltd.
                • Mitsubishi Heavy Industries Ltd. - Overview
                • Mitsubishi Heavy Industries Ltd. - Business segments
                • Mitsubishi Heavy Industries Ltd. - Key news
                • Mitsubishi Heavy Industries Ltd. - Key offerings
                • Mitsubishi Heavy Industries Ltd. - Segment focus
                • SWOT
              • 15.11 Senvion Wind Technology Pvt. Ltd.
                • Senvion Wind Technology Pvt. Ltd. - Overview
                • Senvion Wind Technology Pvt. Ltd. - Product / Service
                • Senvion Wind Technology Pvt. Ltd. - Key offerings
                • SWOT
              • 15.12 Shanghai Electric Group Co.
                • Shanghai Electric Group Co. - Overview
                • Shanghai Electric Group Co. - Product / Service
                • Shanghai Electric Group Co. - Key offerings
                • SWOT
              • 15.13 Shanghai Taisheng Wind Power Equipment Co. Ltd.
                • Shanghai Taisheng Wind Power Equipment Co. Ltd. - Overview
                • Shanghai Taisheng Wind Power Equipment Co. Ltd. - Product / Service
                • Shanghai Taisheng Wind Power Equipment Co. Ltd. - Key offerings
                • SWOT
              • 15.14 Siemens AG
                • Siemens AG - Overview
                • Siemens AG - Business segments
                • Siemens AG - Key news
                • Siemens AG - Key offerings
                • Siemens AG - Segment focus
                • SWOT
              • 15.15 Sinovel Wind Group Co. Ltd.
                • Sinovel Wind Group Co. Ltd. - Overview
                • Sinovel Wind Group Co. Ltd. - Product / Service
                • Sinovel Wind Group Co. Ltd. - Key offerings
                • SWOT
              • 15.16 Vestas Wind Systems AS
                • Vestas Wind Systems AS - Overview
                • Vestas Wind Systems AS - Business segments
                • Vestas Wind Systems AS - Key offerings
                • Vestas Wind Systems AS - Segment focus
                • SWOT
              • 15.17 Xcel Energy Inc.
                • Xcel Energy Inc. - Overview
                • Xcel Energy Inc. - Business segments
                • Xcel Energy Inc. - Key offerings
                • Xcel Energy Inc. - Segment focus
                • SWOT
              • 15.18 Xinjiang Goldwind Science and Technology Co. Ltd.
                • Xinjiang Goldwind Science and Technology Co. Ltd. - Overview
                • Xinjiang Goldwind Science and Technology Co. Ltd. - Business segments
                • Xinjiang Goldwind Science and Technology Co. Ltd. - Key offerings
                • Xinjiang Goldwind Science and Technology Co. Ltd. - Segment focus
                • SWOT

              16 Appendix

              • 16.1 Scope of the report
                • 16.2 Inclusions and exclusions checklist
                  • Inclusions checklist
                  • Exclusions checklist
                • 16.3 Currency conversion rates for US$
                  • Currency conversion rates for US$
                • 16.4 Research methodology
                  • Research methodology
                • 16.5 Data procurement
                  • Information sources
                • 16.6 Data validation
                  • Data validation
                • 16.7 Validation techniques employed for market sizing
                  • Validation techniques employed for market sizing
                • 16.8 Data synthesis
                  • Data synthesis
                • 16.9 360 degree market analysis
                  • 360 degree market analysis
                • 16.10 List of abbreviations
                  • List of abbreviations

                Research Methodology

                Technavio presents a detailed picture of the market by way of study, synthesis, and summation of data from multiple sources. The analysts have presented the various facets of the market with a particular focus on identifying the key industry influencers. The data thus presented is comprehensive, reliable, and the result of extensive research, both primary and secondary.

                INFORMATION SOURCES

                Primary sources

                • Manufacturers and suppliers
                • Channel partners
                • Industry experts
                • Strategic decision makers

                Secondary sources

                • Industry journals and periodicals
                • Government data
                • Financial reports of key industry players
                • Historical data
                • Press releases

                DATA ANALYSIS

                Data Synthesis

                • Collation of data
                • Estimation of key figures
                • Analysis of derived insights

                Data Validation

                • Triangulation with data models
                • Reference against proprietary databases
                • Corroboration with industry experts

                REPORT WRITING

                Qualitative

                • Market drivers
                • Market challenges
                • Market trends
                • Five forces analysis

                Quantitative

                • Market size and forecast
                • Market segmentation
                • Geographical insights
                • Competitive landscape

                Interested in this report?

                Get your sample now to see our research methodology and insights!

                Download Now

                Frequently Asked Questions

                Clean Energy Technologies market growth will increase by $ 99400 mn during 2025-2029.

                The Clean Energy Technologies market is expected to grow at a CAGR of 5.6% during 2025-2029.

                Clean Energy Technologies market is segmented by Technology( Hydropower, Clean coal, Wind, Solar, Others) End-user( Industrial, Residential, Commercial, ROW) Deployment( On-grid, Off-grid, Hybrid systems, South America, Middle East and Africa)

                ABB Ltd., Acciona SA, Canadian Solar Inc., Enercon Services Inc., Envision Group, First Solar Inc., General Electric Co., Invenergy, JA Solar Technology Co. Ltd., JinkoSolar Holding Co. Ltd., Mitsubishi Heavy Industries Ltd., Senvion Wind Technology Pvt. Ltd., Shanghai Electric Group Co., Shanghai Taisheng Wind Power Equipment Co. Ltd., Siemens AG, Sinovel Wind Group Co. Ltd., Tata Sons Pvt. Ltd., Vestas Wind Systems AS, Xcel Energy Inc., Xinjiang Goldwind Science and Technology Co. Ltd. are a few of the key vendors in the Clean Energy Technologies market.

                APAC will register the highest growth rate of 36% among the other regions. Therefore, the Clean Energy Technologies market in APAC is expected to garner significant business opportunities for the vendors during the forecast period.

                US, China, Germany, UK, Brazil, India, Canada, Spain, South Africa, France

                • Increase in investments in clean energy technologiesThe global clean energy technologies market is experiencing robust growth is the driving factor this market.
                • largely driven by a significant increase in investments across both public and private sectors. Governments worldwide are prioritizing sustainability and climate goals is the driving factor this market.
                • channeling substantial funding into renewable energy sources such as solar is the driving factor this market.
                • wind is the driving factor this market.
                • and hydrogen is the driving factor this market.
                • while also incentivizing innovation in energy storage is the driving factor this market.
                • smart grids is the driving factor this market.
                • and carbon capture technologies. Simultaneously is the driving factor this market.
                • private investors and corporations are recognizing the long-term economic and environmental benefits of clean energy is the driving factor this market.
                • leading to a surge in venture capital and green financing initiatives. This influx of capital is accelerating research and development is the driving factor this market.
                • enhancing manufacturing capabilities is the driving factor this market.
                • and expanding deployment infrastructure is the driving factor this market.
                • thereby reducing costs and improving efficiency across clean energy systems. Moreover is the driving factor this market.
                • international collaborations and policy frameworks is the driving factor this market.
                • such as the Paris Agreement and net-zero pledges is the driving factor this market.
                • are reinforcing investor confidence and encouraging cross-border investments. As a result is the driving factor this market.
                • emerging markets are also gaining traction is the driving factor this market.
                • with increased access to funding enabling the adoption of clean technologies at scale. The convergence of financial support is the driving factor this market.
                • technological advancement is the driving factor this market.
                • and policy alignment is creating a dynamic ecosystem that propels the clean energy technologies market forward is the driving factor this market.
                • positioning it as a cornerstone of global efforts to combat climate change and transition to a low-carbon economy. is the driving factor this market.

                The Clean Energy Technologies market vendors should focus on grabbing business opportunities from the Hydropower segment as it accounted for the largest market share in the base year.