Cider Market Analysis, Size, and Forecast 2025-2029: Europe (UK, France, and Spain), North America (US, Canada, and Mexico), APAC (Australia, China, and Japan), South America (Brazil and Argentina), Middle East and Africa (South Africa, UAE, and Saudi Arabia), and Rest of World (ROW)

Cider Market Analysis, Size, and Forecast 2025-2029:
Europe (UK, France, and Spain), North America (US, Canada, and Mexico), APAC (Australia, China, and Japan), South America (Brazil and Argentina), Middle East and Africa (South Africa, UAE, and Saudi Arabia), and Rest of World (ROW)

Published: Dec 2025 301 Pages SKU: IRTNTR81120

Market Overview at a Glance

$1.73 B
Market Opportunity
5.8%
CAGR 2024 - 2029
43.9%
Europe Growth
$2.90 B
Off-trade segment 2023

Cider Market Size 2025-2029

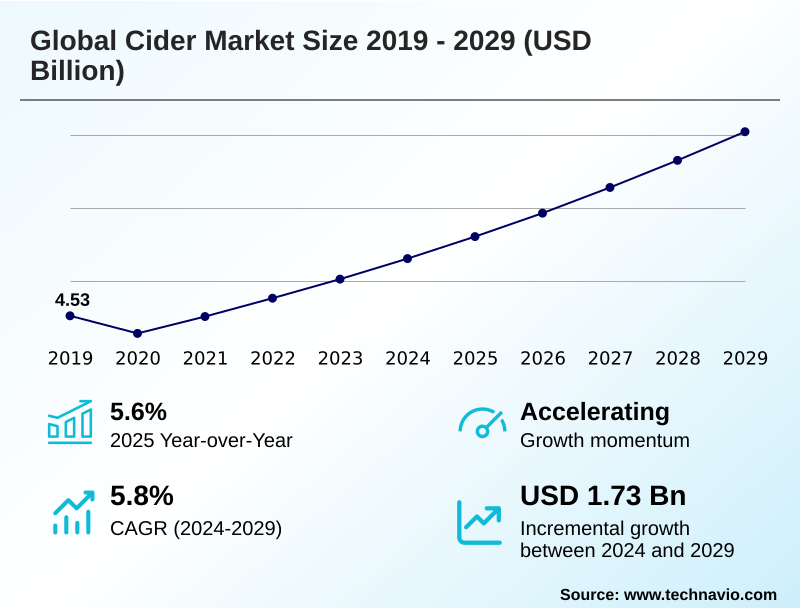
The cider market size is valued to increase by USD 1.73 billion, at a CAGR of 5.8% from 2024 to 2029. Increasing demand for gluten-free and perceived healthier alternatives will drive the cider market.

Major Market Trends & Insights

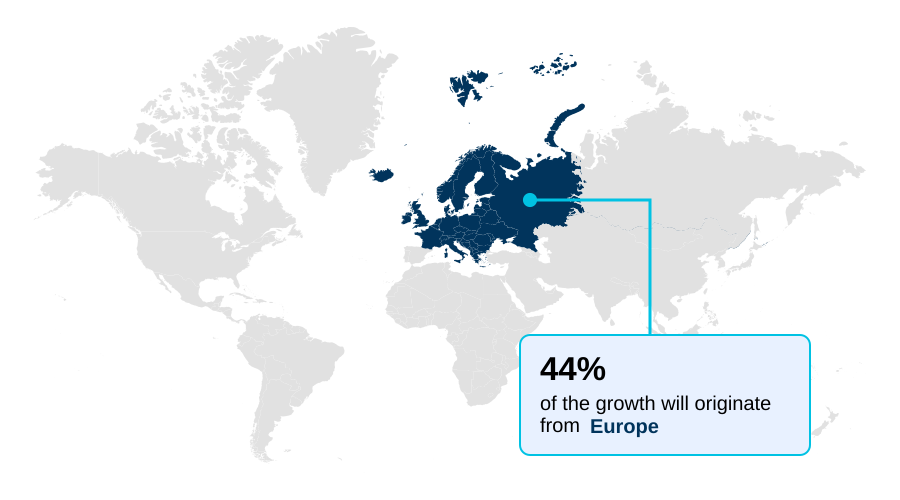
  • Europe dominated the market and accounted for a 43.9% growth during the forecast period.
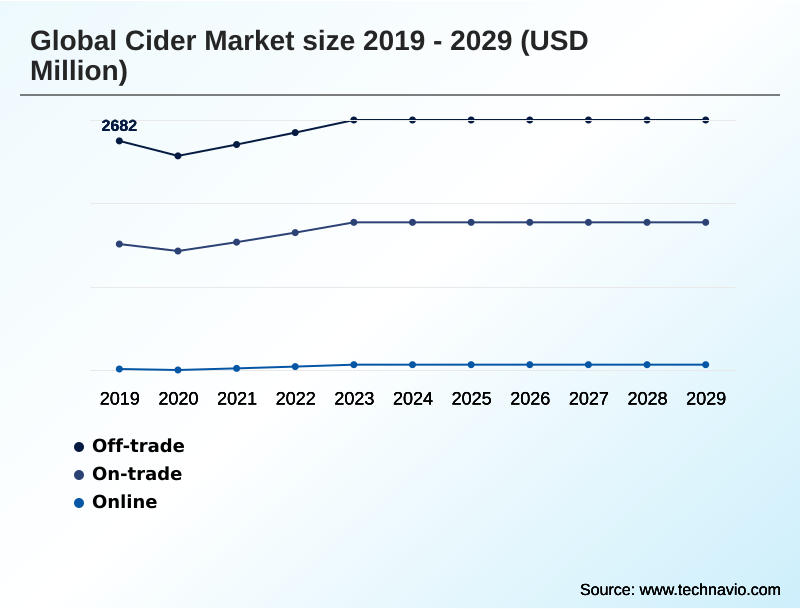
  • By Distribution Channel - Off-trade segment was valued at USD 2.90 billion in 2023
  • By Product Type - Apple cider segment accounted for the largest market revenue share in 2023

Market Size & Forecast

  • Market Opportunities: USD 2.51 billion
  • Market Future Opportunities: USD 1.73 billion
  • CAGR from 2024 to 2029 : 5.8%

Market Summary

  • The Cider Market is undergoing a significant transformation, evolving from a traditional beverage to a sophisticated and diverse category. This renaissance is propelled by the artisanal cider movement, which champions craft cider production using heirloom apple varietals to create beverages with complex tannin structure and distinct cider terroir.
  • Key market drivers include the growing consumer shift toward healthier, gluten-free alcoholic beverage options and a willingness to explore premium cider brands.
  • A critical operational scenario for producers involves managing the supply chain for specific bittersweet apples and bittersharp apples, as inconsistent availability can disrupt production schedules and impact the final product's flavor profile, which is defined by its cider sweetness scale and acidity levels.
  • While continuous fruit-flavored cider innovation attracts new consumers, the industry faces challenges from intense competition and the need for greater consumer education to differentiate between mass-market products and high-quality single varietal ciders. The heritage cider revival is a key trend, bringing renewed focus to traditional methods and authentic flavors.

What will be the Size of the Cider Market during the forecast period?

Get Key Insights on Market Forecast (PDF) Request Free Sample

How is the Cider Market Segmented?

The cider industry research report provides comprehensive data (region-wise segment analysis), with forecasts and estimates in "USD million" for the period 2025-2029, as well as historical data from 2019-2023 for the following segments.

  • Distribution channel
    • Off-trade
    • On-trade
    • Online
  • Product type
    • Apple cider
    • Fruit flavored cider
    • Craft or specialty cider
    • Traditional cider
    • Pear cider
  • Packaging
    • Glass
    • Can
    • Kegs
    • Others
  • Geography
    • Europe
      • UK
      • France
      • Spain
    • North America
      • US
      • Canada
      • Mexico
    • APAC
      • Australia
      • China
      • Japan
    • South America
      • Brazil
      • Argentina
    • Middle East and Africa
      • South Africa
      • UAE
      • Saudi Arabia
    • Rest of World (ROW)

By Distribution Channel Insights

The off-trade segment is estimated to witness significant growth during the forecast period.

Market segmentation reveals distinct channel dynamics. The on-trade channel distribution relies heavily on draught cider systems to deliver fresh products, while off-trade success is increasingly tied to canned cider convenience and the appeal of premium cider brands.

This segment allows for diverse specialty cider styles, where production methods like bottle conditioning and malolactic fermentation can be marketed directly. Producers manage carbonation levels and sorbitol content to meet consumer preferences.

For instance, brands that have won cider competition awards see a sales lift of over 10% in this channel. Innovations in aseptic packaging extend shelf life, while cider club subscriptions create a direct-to-consumer flywheel, building loyalty beyond the retail shelf.

Request Free Sample

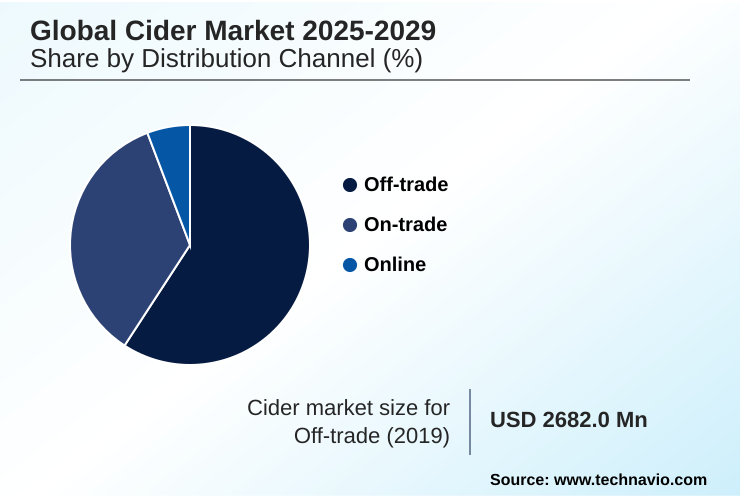
The Off-trade segment was valued at USD 2.90 billion in 2023 and showed a gradual increase during the forecast period.

Request Free Sample

Regional Analysis

Europe is estimated to contribute 43.9% to the growth of the global market during the forecast period.Technavio’s analysts have elaborately explained the regional trends and drivers that shape the market during the forecast period.

See How Cider Market Demand is Rising in Europe Request Free Sample

The market's geography is defined by pronounced regional cider differences. Europe remains the core, accounting for nearly 44% of growth, with traditions like apfelwein production in Germany and sidra natural in Spain, where specific cider house rules dictate consumption.

French producers utilize the keeving technique to create naturally sweet cidre bouché. These regions champion natural cider, often using wild yeast fermentation. In contrast, APAC’s growth of over 23% is driven by modern styles.

North American producers leverage direct-to-consumer cider sales to showcase still cider and sparkling cider made from perry pear varieties and apples with unique tannin structure, highlighting the category's global diversity.

Market Dynamics

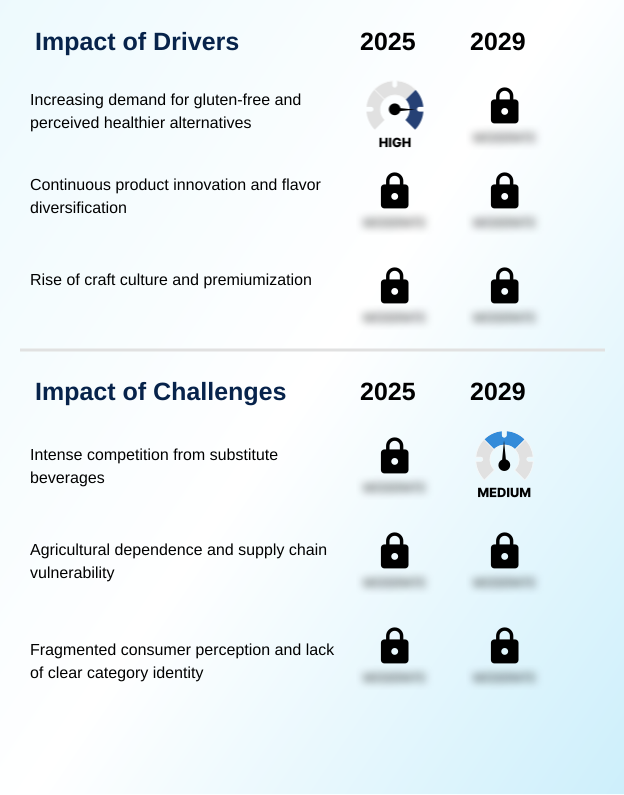
Our researchers analyzed the data with 2024 as the base year, along with the key drivers, trends, and challenges. A holistic analysis of drivers will help companies refine their marketing strategies to gain a competitive advantage.

  • The global cider market is being reshaped by powerful premiumization trends, shifting it away from a monolithic category into one defined by quality and diversity. Central to this evolution is a deeper consumer and producer focus on understanding tannins in heritage apple ciders, which distinguishes artisanal products from their mass-market counterparts.
  • This appreciation for complexity has paved the way for significant innovation in cider and wine hybrid beverages, a key growth area that blurs traditional category lines and appeals to adventurous palates. At the same time, sustainability practices in modern cider making are becoming a crucial point of differentiation and a core component of brand identity.
  • These practices resonate strongly with environmentally conscious consumers and often lead to operational efficiencies. This intersects with the evolving consumer perception of canned craft cider, which has moved from being seen as a lower-quality option to a preferred format for its convenience, portability, and superior preservation of flavor.
  • For instance, producers that have successfully marketed the quality of their canned offerings have seen adoption rates increase by more than 30% among urban consumers compared to those sticking exclusively to glass.

What are the key market drivers leading to the rise in the adoption of Cider Industry?

  • Increasing consumer demand for gluten-free and perceived healthier alternatives is a key driver for the market's growth.

  • The market is primarily driven by its positioning as a gluten-free alcoholic beverage and the rise of the artisanal cider movement. This has fueled demand for premium cider brands that emphasize craft cider production using heirloom apple varietals.
  • These single varietal ciders allow producers to highlight specific characteristics on the cider sweetness scale. Evolving cider consumption trends show a preference for authenticity, boosting organic cider production and sustainable cidery practices.
  • Fruit-flavored cider innovation continues to attract new demographics, while the emergence of imperial ciders and other high-abv ciders caters to demand for more robust experiences. Brands effectively marketing these attributes see consumer acquisition rates improve by over 20%.

What are the market trends shaping the Cider Industry?

  • The emergence of low- and no-alcohol ciders represents a significant market trend, driven by a growing consumer focus on health, wellness, and mindful drinking.

  • Key trends reflect a heritage cider revival and a push towards sophistication in modern cider making. The barrel aging process and techniques like dry hopping and co-fermentation are creating complex specialty cider styles, including popular rosé ciders, that command premium pricing, with some achieving margins 40% higher than standard offerings. This complexity enhances cider and food pairing opportunities.
  • Concurrently, the growth of low-alcohol cider options and the broader non-alcoholic cider market are expanding consumption occasions, with some brands reporting a 15% increase in daytime sales for sessionable ciders. Consumers are exploring cider terroir through detailed cider tasting notes and utilizing versatile products in cider cocktail recipes, indicating a deepening engagement with the category.

What challenges does the Cider Industry face during its growth?

  • Intense competition from a wide range of substitute beverages presents a key challenge affecting the industry's growth.

  • Significant challenges stem from agricultural dependencies and intense competition. Securing consistent supplies of bittersweet apples and bittersharp apples from cider apple orchards is a primary concern, with climate-related events causing raw material cost fluctuations of up to 20% for some producers.
  • The high cost of specialized cider production equipment for processes like juice pressing and advanced cider filtration methods also presents a barrier. Intense competition requires sophisticated cider marketing strategies and innovative cider packaging solutions to secure placement in both off-trade channel sales and on-trade channel distribution.
  • Furthermore, complex cider industry regulations and a short cider shelf life for unpasteurized products add operational complexity, intensifying the cider vs hard cider debate for consumer mindshare.

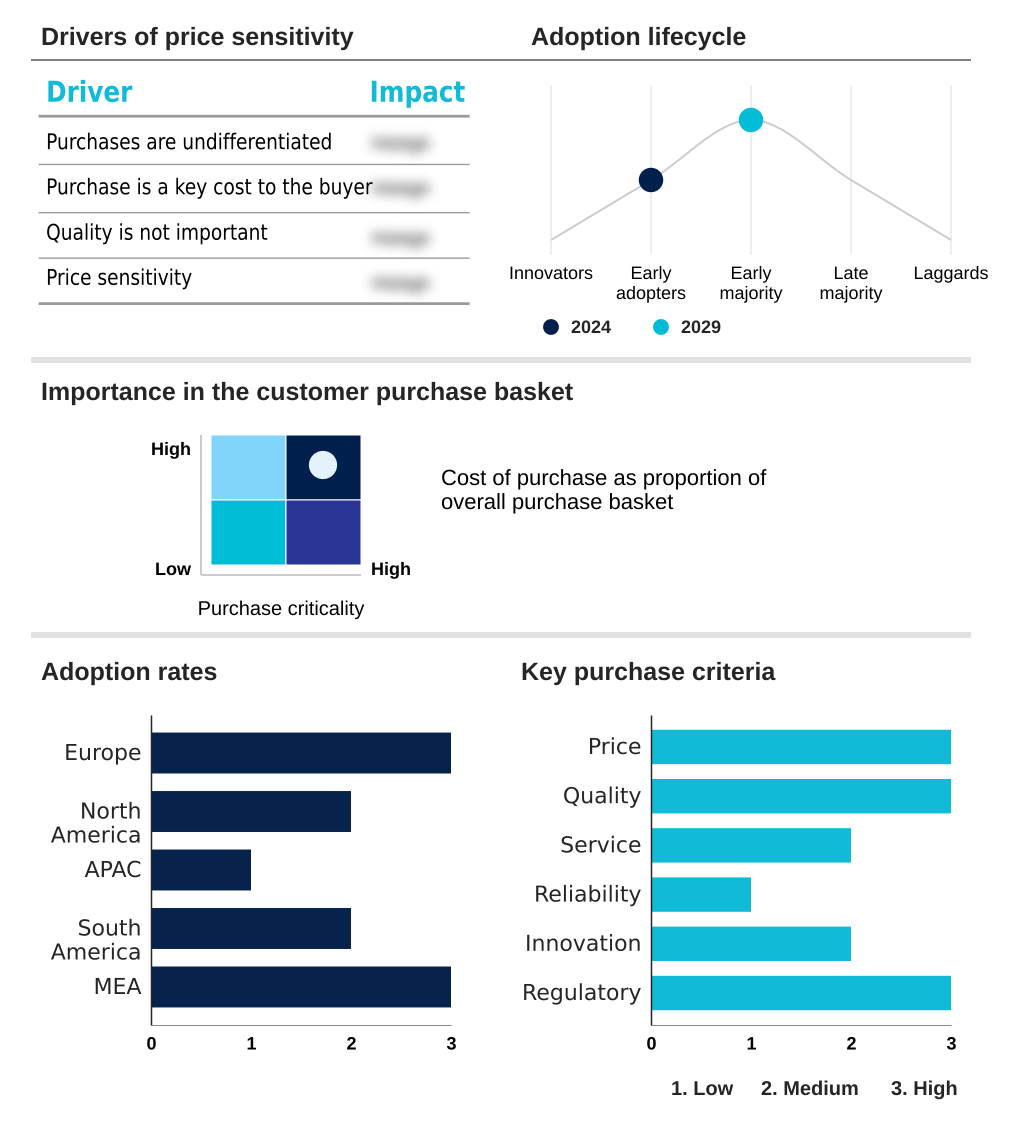
Exclusive Technavio Analysis on Customer Landscape

The cider market forecasting report includes the adoption lifecycle of the market, covering from the innovator’s stage to the laggard’s stage. It focuses on adoption rates in different regions based on penetration. Furthermore, the cider market report also includes key purchase criteria and drivers of price sensitivity to help companies evaluate and develop their market growth analysis strategies.

Customer Landscape of Cider Industry

Competitive Landscape

Companies are implementing various strategies, such as strategic alliances, cider market forecast, partnerships, mergers and acquisitions, geographical expansion, and product/service launches, to enhance their presence in the industry.

2 Towns Ciderhouse - An analyst's view highlights the firm's focus on 100% fresh-pressed apples for its craft ciders, eschewing concentrates to maintain product integrity and authenticity.

The industry research and growth report includes detailed analyses of the competitive landscape of the market and information about key companies, including:

  • 2 Towns Ciderhouse
  • Ace Cider i, LLC
  • Anheuser Busch InBev SA NV
  • C and C Group PLC
  • Carlsberg Breweries AS
  • Cornish Orchards
  • Dunkertons Cider
  • Gwynt y Ddraig
  • Heineken NV
  • Kopparberg
  • Molson Coors Beverage Co.
  • Samuel Smith Old Brewery
  • Seattle Cider Co.
  • Sheppys Cider Ltd
  • Thatchers Cider
  • The Boston Beer Co. Inc.
  • Westons Cider

Qualitative and quantitative analysis of companies has been conducted to help clients understand the wider business environment as well as the strengths and weaknesses of key industry players. Data is qualitatively analyzed to categorize companies as pure play, category-focused, industry-focused, and diversified; it is quantitatively analyzed to categorize companies as dominant, leading, strong, tentative, and weak.

Recent Development and News in Cider market

  • In September 2024, Heineken NV expands its Strongbow portfolio with the global launch of Strongbow 0.0% Dark Fruit, responding to growing consumer demand for premium non-alcoholic beverage options.
  • In November 2024, 2 Towns Ciderhouse secures a significant growth equity investment from a private equity firm to expand its production capacity and national distribution network for its craft ciders.
  • In January 2025, The Boston Beer Co. Inc. introduces 'Angry Orchard Vine and Press,' a new line of cider-wine hybrids co-fermented with wine grapes, targeting consumers seeking sophisticated, cross-category beverage experiences.
  • In April 2025, C and C Group PLC announces a strategic partnership with a leading beverage distributor in Brazil to launch its Magners Irish Cider brand, capitalizing on the growing interest in international premium beverages in South America.

Dive into Technavio’s robust research methodology, blending expert interviews, extensive data synthesis, and validated models for unparalleled Cider Market insights. See full methodology.

Market Scope
Page number 301
Base year 2024
Historic period 2019-2023
Forecast period 2025-2029
Growth momentum & CAGR Accelerate at a CAGR of 5.8%
Market growth 2025-2029 USD 1733.0 million
Market structure Fragmented
YoY growth 2024-2025(%) 5.6%
Key countries UK, Ireland, France, Spain, Germany, The Netherlands, US, Canada, Mexico, Australia, China, Japan, India, South Korea, Indonesia, Brazil, Argentina, Chile, South Africa, UAE, Egypt, Morocco and Saudi Arabia
Competitive landscape Leading Companies, Market Positioning of Companies, Competitive Strategies, and Industry Risks

Request Free Sample

Research Analyst Overview

  • The Cider Market's evolution is rooted in the transformation of fermented apple juice into a diverse beverage spectrum. The heritage cider revival is driving interest in cider terroir, with craft cider production leveraging specific cider apple orchards.
  • Producers utilize heirloom apple varietals, including bittersweet apples and bittersharp apples, to craft single varietal ciders with unique tannin structure and defined cider acidity levels. Advanced techniques such as the keeving technique, wild yeast fermentation, malolactic fermentation, and bottle conditioning are becoming more prevalent. Boardroom strategy is now focused on portfolio expansion into rosé ciders, imperial ciders, and ice cider.
  • The entire production chain, from juice pressing and pulp maceration to the judicious use of sulfite addition and modern cider filtration methods, is being optimized. Firms refining these processes have noted a 15% increase in production efficiency.
  • The market offers everything from still cider to sparkling cider with managed carbonation levels, distributed via on-trade channel distribution using draught cider systems and off-trade channel sales leveraging aseptic packaging. This diverse offering solidifies cider's position as a leading gluten-free alcoholic beverage.

What are the Key Data Covered in this Cider Market Research and Growth Report?

  • What is the expected growth of the Cider Market between 2025 and 2029?

    • USD 1.73 billion, at a CAGR of 5.8%

  • What segmentation does the market report cover?

    • The report is segmented by Distribution Channel (Off-trade, On-trade, and Online), Product Type (Apple cider, Fruit flavored cider, Craft or specialty cider, Traditional cider, and Pear cider), Packaging (Glass, Can, Kegs, and Others) and Geography (Europe, North America, APAC, South America, Middle East and Africa)

  • Which regions are analyzed in the report?

    • Europe, North America, APAC, South America and Middle East and Africa

  • What are the key growth drivers and market challenges?

    • Increasing demand for gluten-free and perceived healthier alternatives, Intense competition from substitute beverages

  • Who are the major players in the Cider Market?

    • 2 Towns Ciderhouse, Ace Cider i, LLC, Anheuser Busch InBev SA NV, C and C Group PLC, Carlsberg Breweries AS, Cornish Orchards, Dunkertons Cider, Gwynt y Ddraig, Heineken NV, Kopparberg, Molson Coors Beverage Co., Samuel Smith Old Brewery, Seattle Cider Co., Sheppys Cider Ltd, Thatchers Cider, The Boston Beer Co. Inc. and Westons Cider

Market Research Insights

  • The Cider Market is shaped by the artisanal cider movement, which has elevated consumer expectations and driven demand for premium cider brands. This shift encourages sophisticated consumption, with a growing interest in cider and food pairing and the use of cider in cider cocktail recipes.
  • In response, producers are adopting sustainable cidery practices, with some achieving a 10% reduction in operational waste. Furthermore, brands leveraging direct-to-consumer sales models are reporting customer loyalty rates 25% higher than those relying on traditional retail.
  • This focus on quality and authenticity is also fueling interest in organic cider production, as consumers seek products with transparent sourcing and cleaner labels, creating new avenues for market differentiation and value creation.

We can help! Our analysts can customize this cider market research report to meet your requirements.

Get in touch

1. Executive Summary

1.1 Market overview

Executive Summary - Chart on Market Overview
Executive Summary - Data Table on Market Overview
Executive Summary - Chart on Global Market Characteristics
Executive Summary - Chart on Market by Geography
Executive Summary - Chart on Market Segmentation by Distribution Channel
Executive Summary - Chart on Market Segmentation by Product Type
Executive Summary - Chart on Market Segmentation by Packaging
Executive Summary - Chart on Incremental Growth
Executive Summary - Data Table on Incremental Growth
Executive Summary - Chart on Company Market Positioning

2. Technavio Analysis

2.1 Analysis of price sensitivity, lifecycle, customer purchase basket, adoption rates, and purchase criteria

2.2 Criticality of inputs and Factors of differentiation

Chart on Overview on criticality of inputs and factors of differentiation

2.3 Factors of disruption

Chart on Overview on factors of disruption

2.4 Impact of drivers and challenges

Chart on Impact of drivers and challenges in 2024 and 2029

3. Market Landscape

3.1 Market ecosystem

Chart on Parent Market
Data Table on - Parent Market

3.2 Market characteristics

Chart on Market characteristics analysis

3.3 Value chain analysis

Chart on Value chain analysis

4. Market Sizing

4.1 Market definition

Data Table on Offerings of companies included in the market definition

4.2 Market segment analysis

Market segments

4.3 Market size 2024

4.4 Market outlook: Forecast for 2024-2029

Chart on Global - Market size and forecast 2024-2029 ($ million)
Data Table on Global - Market size and forecast 2024-2029 ($ million)
Chart on Global Market: Year-over-year growth 2024-2029 (%)
Data Table on Global Market: Year-over-year growth 2024-2029 (%)

5. Historic Market Size

5.1 Global Cider Market 2019 - 2023

Historic Market Size - Data Table on Global Cider Market 2019 - 2023 ($ million)

5.2 Distribution Channel segment analysis 2019 - 2023

Historic Market Size - Distribution Channel Segment 2019 - 2023 ($ million)

5.3 Product Type segment analysis 2019 - 2023

Historic Market Size - Product Type Segment 2019 - 2023 ($ million)

5.4 Packaging segment analysis 2019 - 2023

Historic Market Size - Packaging Segment 2019 - 2023 ($ million)

5.5 Geography segment analysis 2019 - 2023

Historic Market Size - Geography Segment 2019 - 2023 ($ million)

5.6 Country segment analysis 2019 - 2023

Historic Market Size - Country Segment 2019 - 2023 ($ million)

6. Qualitative Analysis

6.1 Impact of AI in global cider market

7. Five Forces Analysis

7.1 Five forces summary

Five forces analysis - Comparison between 2024 and 2029

7.2 Bargaining power of buyers

Bargaining power of buyers - Impact of key factors 2024 and 2029

7.3 Bargaining power of suppliers

Bargaining power of suppliers - Impact of key factors in 2024 and 2029

7.4 Threat of new entrants

Threat of new entrants - Impact of key factors in 2024 and 2029

7.5 Threat of substitutes

Threat of substitutes - Impact of key factors in 2024 and 2029

7.6 Threat of rivalry

Threat of rivalry - Impact of key factors in 2024 and 2029

7.7 Market condition

Chart on Market condition - Five forces 2024 and 2029

8. Market Segmentation by Distribution Channel

8.1 Market segments

Chart on Distribution Channel - Market share 2024-2029 (%)
Data Table on Distribution Channel - Market share 2024-2029 (%)

8.2 Comparison by Distribution Channel

Chart on Comparison by Distribution Channel
Data Table on Comparison by Distribution Channel

8.3 Off-trade - Market size and forecast 2024-2029

Chart on Off-trade - Market size and forecast 2024-2029 ($ million)
Data Table on Off-trade - Market size and forecast 2024-2029 ($ million)
Chart on Off-trade - Year-over-year growth 2024-2029 (%)
Data Table on Off-trade - Year-over-year growth 2024-2029 (%)

8.4 On-trade - Market size and forecast 2024-2029

Chart on On-trade - Market size and forecast 2024-2029 ($ million)
Data Table on On-trade - Market size and forecast 2024-2029 ($ million)
Chart on On-trade - Year-over-year growth 2024-2029 (%)
Data Table on On-trade - Year-over-year growth 2024-2029 (%)

8.5 Online - Market size and forecast 2024-2029

Chart on Online - Market size and forecast 2024-2029 ($ million)
Data Table on Online - Market size and forecast 2024-2029 ($ million)
Chart on Online - Year-over-year growth 2024-2029 (%)
Data Table on Online - Year-over-year growth 2024-2029 (%)

8.6 Market opportunity by Distribution Channel

Market opportunity by Distribution Channel ($ million)
Data Table on Market opportunity by Distribution Channel ($ million)

9. Market Segmentation by Product Type

9.1 Market segments

Chart on Product Type - Market share 2024-2029 (%)
Data Table on Product Type - Market share 2024-2029 (%)

9.2 Comparison by Product Type

Chart on Comparison by Product Type
Data Table on Comparison by Product Type

9.3 Apple cider - Market size and forecast 2024-2029

Chart on Apple cider - Market size and forecast 2024-2029 ($ million)
Data Table on Apple cider - Market size and forecast 2024-2029 ($ million)
Chart on Apple cider - Year-over-year growth 2024-2029 (%)
Data Table on Apple cider - Year-over-year growth 2024-2029 (%)

9.4 Fruit flavored cider - Market size and forecast 2024-2029

Chart on Fruit flavored cider - Market size and forecast 2024-2029 ($ million)
Data Table on Fruit flavored cider - Market size and forecast 2024-2029 ($ million)
Chart on Fruit flavored cider - Year-over-year growth 2024-2029 (%)
Data Table on Fruit flavored cider - Year-over-year growth 2024-2029 (%)

9.5 Craft or specialty cider - Market size and forecast 2024-2029

Chart on Craft or specialty cider - Market size and forecast 2024-2029 ($ million)
Data Table on Craft or specialty cider - Market size and forecast 2024-2029 ($ million)
Chart on Craft or specialty cider - Year-over-year growth 2024-2029 (%)
Data Table on Craft or specialty cider - Year-over-year growth 2024-2029 (%)

9.6 Traditional cider - Market size and forecast 2024-2029

Chart on Traditional cider - Market size and forecast 2024-2029 ($ million)
Data Table on Traditional cider - Market size and forecast 2024-2029 ($ million)
Chart on Traditional cider - Year-over-year growth 2024-2029 (%)
Data Table on Traditional cider - Year-over-year growth 2024-2029 (%)

9.7 Pear cider - Market size and forecast 2024-2029

Chart on Pear cider - Market size and forecast 2024-2029 ($ million)
Data Table on Pear cider - Market size and forecast 2024-2029 ($ million)
Chart on Pear cider - Year-over-year growth 2024-2029 (%)
Data Table on Pear cider - Year-over-year growth 2024-2029 (%)

9.8 Market opportunity by Product Type

Market opportunity by Product Type ($ million)
Data Table on Market opportunity by Product Type ($ million)

10. Market Segmentation by Packaging

10.1 Market segments

Chart on Packaging - Market share 2024-2029 (%)
Data Table on Packaging - Market share 2024-2029 (%)

10.2 Comparison by Packaging

Chart on Comparison by Packaging
Data Table on Comparison by Packaging

10.3 Glass - Market size and forecast 2024-2029

Chart on Glass - Market size and forecast 2024-2029 ($ million)
Data Table on Glass - Market size and forecast 2024-2029 ($ million)
Chart on Glass - Year-over-year growth 2024-2029 (%)
Data Table on Glass - Year-over-year growth 2024-2029 (%)

10.4 Can - Market size and forecast 2024-2029

Chart on Can - Market size and forecast 2024-2029 ($ million)
Data Table on Can - Market size and forecast 2024-2029 ($ million)
Chart on Can - Year-over-year growth 2024-2029 (%)
Data Table on Can - Year-over-year growth 2024-2029 (%)

10.5 Kegs - Market size and forecast 2024-2029

Chart on Kegs - Market size and forecast 2024-2029 ($ million)
Data Table on Kegs - Market size and forecast 2024-2029 ($ million)
Chart on Kegs - Year-over-year growth 2024-2029 (%)
Data Table on Kegs - Year-over-year growth 2024-2029 (%)

10.6 Others - Market size and forecast 2024-2029

Chart on Others - Market size and forecast 2024-2029 ($ million)
Data Table on Others - Market size and forecast 2024-2029 ($ million)
Chart on Others - Year-over-year growth 2024-2029 (%)
Data Table on Others - Year-over-year growth 2024-2029 (%)

10.7 Market opportunity by Packaging

Market opportunity by Packaging ($ million)
Data Table on Market opportunity by Packaging ($ million)

11. Customer Landscape

11.1 Customer landscape overview

Analysis of price sensitivity, lifecycle, customer purchase basket, adoption rates, and purchase criteria

12. Geographic Landscape

12.1 Geographic segmentation

Chart on Market share by geography 2024-2029 (%)
Data Table on Market share by geography 2024-2029 (%)

12.2 Geographic comparison

Chart on Geographic comparison
Data Table on Geographic comparison

12.3 Europe - Market size and forecast 2024-2029

Chart on Europe - Market size and forecast 2024-2029 ($ million)
Data Table on Europe - Market size and forecast 2024-2029 ($ million)
Chart on Europe - Year-over-year growth 2024-2029 (%)
Data Table on Europe - Year-over-year growth 2024-2029 (%)
Chart on Regional Comparison - Europe
Data Table on Regional Comparison - Europe

12.3.1 UK - Market size and forecast 2024-2029

Chart on UK - Market size and forecast 2024-2029 ($ million)
Data Table on UK - Market size and forecast 2024-2029 ($ million)
Chart on UK - Year-over-year growth 2024-2029 (%)
Data Table on UK - Year-over-year growth 2024-2029 (%)

12.3.2 Ireland - Market size and forecast 2024-2029

Chart on Ireland - Market size and forecast 2024-2029 ($ million)
Data Table on Ireland - Market size and forecast 2024-2029 ($ million)
Chart on Ireland - Year-over-year growth 2024-2029 (%)
Data Table on Ireland - Year-over-year growth 2024-2029 (%)

12.3.3 France - Market size and forecast 2024-2029

Chart on France - Market size and forecast 2024-2029 ($ million)
Data Table on France - Market size and forecast 2024-2029 ($ million)
Chart on France - Year-over-year growth 2024-2029 (%)
Data Table on France - Year-over-year growth 2024-2029 (%)

12.3.4 Spain - Market size and forecast 2024-2029

Chart on Spain - Market size and forecast 2024-2029 ($ million)
Data Table on Spain - Market size and forecast 2024-2029 ($ million)
Chart on Spain - Year-over-year growth 2024-2029 (%)
Data Table on Spain - Year-over-year growth 2024-2029 (%)

12.3.5 Germany - Market size and forecast 2024-2029

Chart on Germany - Market size and forecast 2024-2029 ($ million)
Data Table on Germany - Market size and forecast 2024-2029 ($ million)
Chart on Germany - Year-over-year growth 2024-2029 (%)
Data Table on Germany - Year-over-year growth 2024-2029 (%)

12.3.6 The Netherlands - Market size and forecast 2024-2029

Chart on The Netherlands - Market size and forecast 2024-2029 ($ million)
Data Table on The Netherlands - Market size and forecast 2024-2029 ($ million)
Chart on The Netherlands - Year-over-year growth 2024-2029 (%)
Data Table on The Netherlands - Year-over-year growth 2024-2029 (%)

12.4 North America - Market size and forecast 2024-2029

Chart on North America - Market size and forecast 2024-2029 ($ million)
Data Table on North America - Market size and forecast 2024-2029 ($ million)
Chart on North America - Year-over-year growth 2024-2029 (%)
Data Table on North America - Year-over-year growth 2024-2029 (%)
Chart on Regional Comparison - North America
Data Table on Regional Comparison - North America

12.4.1 US - Market size and forecast 2024-2029

Chart on US - Market size and forecast 2024-2029 ($ million)
Data Table on US - Market size and forecast 2024-2029 ($ million)
Chart on US - Year-over-year growth 2024-2029 (%)
Data Table on US - Year-over-year growth 2024-2029 (%)

12.4.2 Canada - Market size and forecast 2024-2029

Chart on Canada - Market size and forecast 2024-2029 ($ million)
Data Table on Canada - Market size and forecast 2024-2029 ($ million)
Chart on Canada - Year-over-year growth 2024-2029 (%)
Data Table on Canada - Year-over-year growth 2024-2029 (%)

12.4.3 Mexico - Market size and forecast 2024-2029

Chart on Mexico - Market size and forecast 2024-2029 ($ million)
Data Table on Mexico - Market size and forecast 2024-2029 ($ million)
Chart on Mexico - Year-over-year growth 2024-2029 (%)
Data Table on Mexico - Year-over-year growth 2024-2029 (%)

12.5 APAC - Market size and forecast 2024-2029

Chart on APAC - Market size and forecast 2024-2029 ($ million)
Data Table on APAC - Market size and forecast 2024-2029 ($ million)
Chart on APAC - Year-over-year growth 2024-2029 (%)
Data Table on APAC - Year-over-year growth 2024-2029 (%)
Chart on Regional Comparison - APAC
Data Table on Regional Comparison - APAC

12.5.1 Australia - Market size and forecast 2024-2029

Chart on Australia - Market size and forecast 2024-2029 ($ million)
Data Table on Australia - Market size and forecast 2024-2029 ($ million)
Chart on Australia - Year-over-year growth 2024-2029 (%)
Data Table on Australia - Year-over-year growth 2024-2029 (%)

12.5.2 China - Market size and forecast 2024-2029

Chart on China - Market size and forecast 2024-2029 ($ million)
Data Table on China - Market size and forecast 2024-2029 ($ million)
Chart on China - Year-over-year growth 2024-2029 (%)
Data Table on China - Year-over-year growth 2024-2029 (%)

12.5.3 Japan - Market size and forecast 2024-2029

Chart on Japan - Market size and forecast 2024-2029 ($ million)
Data Table on Japan - Market size and forecast 2024-2029 ($ million)
Chart on Japan - Year-over-year growth 2024-2029 (%)
Data Table on Japan - Year-over-year growth 2024-2029 (%)

12.5.4 India - Market size and forecast 2024-2029

Chart on India - Market size and forecast 2024-2029 ($ million)
Data Table on India - Market size and forecast 2024-2029 ($ million)
Chart on India - Year-over-year growth 2024-2029 (%)
Data Table on India - Year-over-year growth 2024-2029 (%)

12.5.5 South Korea - Market size and forecast 2024-2029

Chart on South Korea - Market size and forecast 2024-2029 ($ million)
Data Table on South Korea - Market size and forecast 2024-2029 ($ million)
Chart on South Korea - Year-over-year growth 2024-2029 (%)
Data Table on South Korea - Year-over-year growth 2024-2029 (%)

12.5.6 Indonesia - Market size and forecast 2024-2029

Chart on Indonesia - Market size and forecast 2024-2029 ($ million)
Data Table on Indonesia - Market size and forecast 2024-2029 ($ million)
Chart on Indonesia - Year-over-year growth 2024-2029 (%)
Data Table on Indonesia - Year-over-year growth 2024-2029 (%)

12.6 South America - Market size and forecast 2024-2029

Chart on South America - Market size and forecast 2024-2029 ($ million)
Data Table on South America - Market size and forecast 2024-2029 ($ million)
Chart on South America - Year-over-year growth 2024-2029 (%)
Data Table on South America - Year-over-year growth 2024-2029 (%)
Chart on Regional Comparison - South America
Data Table on Regional Comparison - South America

12.6.1 Brazil - Market size and forecast 2024-2029

Chart on Brazil - Market size and forecast 2024-2029 ($ million)
Data Table on Brazil - Market size and forecast 2024-2029 ($ million)
Chart on Brazil - Year-over-year growth 2024-2029 (%)
Data Table on Brazil - Year-over-year growth 2024-2029 (%)

12.6.2 Argentina - Market size and forecast 2024-2029

Chart on Argentina - Market size and forecast 2024-2029 ($ million)
Data Table on Argentina - Market size and forecast 2024-2029 ($ million)
Chart on Argentina - Year-over-year growth 2024-2029 (%)
Data Table on Argentina - Year-over-year growth 2024-2029 (%)

12.6.3 Chile - Market size and forecast 2024-2029

Chart on Chile - Market size and forecast 2024-2029 ($ million)
Data Table on Chile - Market size and forecast 2024-2029 ($ million)
Chart on Chile - Year-over-year growth 2024-2029 (%)
Data Table on Chile - Year-over-year growth 2024-2029 (%)

12.7 Middle East and Africa - Market size and forecast 2024-2029

Chart on Middle East and Africa - Market size and forecast 2024-2029 ($ million)
Data Table on Middle East and Africa - Market size and forecast 2024-2029 ($ million)
Chart on Middle East and Africa - Year-over-year growth 2024-2029 (%)
Data Table on Middle East and Africa - Year-over-year growth 2024-2029 (%)
Chart on Regional Comparison - Middle East and Africa
Data Table on Regional Comparison - Middle East and Africa

12.7.1 South Africa - Market size and forecast 2024-2029

Chart on South Africa - Market size and forecast 2024-2029 ($ million)
Data Table on South Africa - Market size and forecast 2024-2029 ($ million)
Chart on South Africa - Year-over-year growth 2024-2029 (%)
Data Table on South Africa - Year-over-year growth 2024-2029 (%)

12.7.2 UAE - Market size and forecast 2024-2029

Chart on UAE - Market size and forecast 2024-2029 ($ million)
Data Table on UAE - Market size and forecast 2024-2029 ($ million)
Chart on UAE - Year-over-year growth 2024-2029 (%)
Data Table on UAE - Year-over-year growth 2024-2029 (%)

12.7.3 Egypt - Market size and forecast 2024-2029

Chart on Egypt - Market size and forecast 2024-2029 ($ million)
Data Table on Egypt - Market size and forecast 2024-2029 ($ million)
Chart on Egypt - Year-over-year growth 2024-2029 (%)
Data Table on Egypt - Year-over-year growth 2024-2029 (%)

12.7.4 Morocco - Market size and forecast 2024-2029

Chart on Morocco - Market size and forecast 2024-2029 ($ million)
Data Table on Morocco - Market size and forecast 2024-2029 ($ million)
Chart on Morocco - Year-over-year growth 2024-2029 (%)
Data Table on Morocco - Year-over-year growth 2024-2029 (%)

12.7.5 Saudi Arabia - Market size and forecast 2024-2029

Chart on Saudi Arabia - Market size and forecast 2024-2029 ($ million)
Data Table on Saudi Arabia - Market size and forecast 2024-2029 ($ million)
Chart on Saudi Arabia - Year-over-year growth 2024-2029 (%)
Data Table on Saudi Arabia - Year-over-year growth 2024-2029 (%)

12.8 Market opportunity by geography

Market opportunity by geography ($ million)
Data Tables on Market opportunity by geography ($ million)

13. Drivers, Challenges, and Opportunity

13.1 Market drivers

Increasing demand for gluten-free and perceived healthier alternatives
Continuous product innovation and flavor diversification
Rise of craft culture and premiumization

13.2 Market challenges

Intense competition from substitute beverages
Agricultural dependence and supply chain vulnerability
Fragmented consumer perception and lack of clear category identity

13.3 Impact of drivers and challenges

Impact of drivers and challenges in 2024 and 2029

13.4 Market opportunities

Emergence of low and no alcohol ciders
Growing sophistication through hybrid styles and barrel aging
Increased focus on provenance and single varietal expressions

14. Competitive Landscape

14.1 Overview

14.2

Overview on criticality of inputs and factors of differentiation

14.3 Landscape disruption

Overview on factors of disruption

14.4 Industry risks

Impact of key risks on business

15. Competitive Analysis

15.1 Companies profiled

Companies covered

15.2 Company ranking index

15.3 Market positioning of companies

Matrix on companies position and classification

15.4 2 Towns Ciderhouse

2 Towns Ciderhouse - Overview
2 Towns Ciderhouse - Product / Service
2 Towns Ciderhouse - Key offerings
SWOT

15.5 Ace Cider i, LLC

Ace Cider i, LLC - Overview
Ace Cider i, LLC - Product / Service
Ace Cider i, LLC - Key offerings
SWOT

15.6 Anheuser Busch InBev SA NV

Anheuser Busch InBev SA NV - Overview
Anheuser Busch InBev SA NV - Product / Service
Anheuser Busch InBev SA NV - Key offerings
SWOT

15.7 C and C Group PLC

C and C Group PLC - Overview
C and C Group PLC - Product / Service
C and C Group PLC - Key offerings
SWOT

15.8 Carlsberg Breweries AS

Carlsberg Breweries AS - Overview
Carlsberg Breweries AS - Business segments
Carlsberg Breweries AS - Key news
Carlsberg Breweries AS - Key offerings
Carlsberg Breweries AS - Segment focus
SWOT

15.9 Cornish Orchards

Cornish Orchards - Overview
Cornish Orchards - Product / Service
Cornish Orchards - Key offerings
SWOT

15.10 Gwynt y Ddraig

Gwynt y Ddraig - Overview
Gwynt y Ddraig - Product / Service
Gwynt y Ddraig - Key offerings
SWOT

15.11 Heineken NV

Heineken NV - Overview
Heineken NV - Business segments
Heineken NV - Key offerings
Heineken NV - Segment focus
SWOT

15.12 Kopparberg

Kopparberg - Overview
Kopparberg - Product / Service
Kopparberg - Key offerings
SWOT

15.13 Molson Coors Beverage Co.

Molson Coors Beverage Co. - Overview
Molson Coors Beverage Co. - Business segments
Molson Coors Beverage Co. - Key news
Molson Coors Beverage Co. - Key offerings
Molson Coors Beverage Co. - Segment focus
SWOT

15.14 Samuel Smith Old Brewery

Samuel Smith Old Brewery - Overview
Samuel Smith Old Brewery - Product / Service
Samuel Smith Old Brewery - Key offerings
SWOT

15.15 Seattle Cider Co.

Seattle Cider Co. - Overview
Seattle Cider Co. - Product / Service
Seattle Cider Co. - Key offerings
SWOT

15.16 Thatchers Cider

Thatchers Cider - Overview
Thatchers Cider - Product / Service
Thatchers Cider - Key offerings
SWOT

15.17 The Boston Beer Co. Inc.

The Boston Beer Co. Inc. - Overview
The Boston Beer Co. Inc. - Product / Service
The Boston Beer Co. Inc. - Key offerings
SWOT

15.18 Westons Cider

Westons Cider - Overview
Westons Cider - Product / Service
Westons Cider - Key offerings
SWOT

16. Appendix

16.1 Scope of the report

Market definition
Objectives
Notes and caveats

16.2 Inclusions and exclusions checklist

Inclusions checklist
Exclusions checklist

16.3 Currency conversion rates for US$

16.4 Research methodology

16.5 Data procurement

Information sources

16.6 Data validation

16.7 Validation techniques employed for market sizing

16.8 Data synthesis

16.9 360 degree market analysis

16.10 List of abbreviations

Research Methodology

Technavio presents a detailed picture of the market by way of study, synthesis, and summation of data from multiple sources. The analysts have presented the various facets of the market with a particular focus on identifying the key industry influencers. The data thus presented is comprehensive, reliable, and the result of extensive research, both primary and secondary.

INFORMATION SOURCES

Primary sources

  • Manufacturers and suppliers
  • Channel partners
  • Industry experts
  • Strategic decision makers

Secondary sources

  • Industry journals and periodicals
  • Government data
  • Financial reports of key industry players
  • Historical data
  • Press releases

DATA ANALYSIS

Data Synthesis

  • Collation of data
  • Estimation of key figures
  • Analysis of derived insights

Data Validation

  • Triangulation with data models
  • Reference against proprietary databases
  • Corroboration with industry experts

REPORT WRITING

Qualitative

  • Market drivers
  • Market challenges
  • Market trends
  • Five forces analysis

Quantitative

  • Market size and forecast
  • Market segmentation
  • Geographical insights
  • Competitive landscape

Interested in this report?

Get your sample now to see our research methodology and insights!

Download Now

Frequently Asked Questions

Cider market growth will increase by USD 1733.0 million during 2025-2029.

The Cider market is expected to grow at a CAGR of 5.8% during 2025-2029.

Cider market is segmented by Distribution channel (Off-trade, On-trade, Online) Product type (Apple cider, Fruit flavored cider, Craft or specialty cider, Traditional cider, Pear cider) Packaging (Glass, Can, Kegs, Others)

2 Towns Ciderhouse, Ace Cider i, LLC, Anheuser Busch InBev SA NV, C and C Group PLC, Carlsberg Breweries AS, Cornish Orchards, Dunkertons Cider, Gwynt y Ddraig, Heineken NV, Kopparberg, Molson Coors Beverage Co., Samuel Smith Old Brewery, Seattle Cider Co., Sheppys Cider Ltd, Thatchers Cider, The Boston Beer Co. Inc., Westons Cider are a few of the key vendors in the Cider market.

Europe will register the highest growth rate of 43.9% among the other regions. Therefore, the Cider market in Europe is expected to garner significant business opportunities for the vendors during the forecast period.

UK, Ireland, France, Spain, Germany, The Netherlands, US, Canada, Mexico, Australia, China, Japan, India, South Korea, Indonesia, Brazil, Argentina, Chile, South Africa, UAE, Egypt, Morocco, Saudi Arabia

  • Increasing demand for gluten-free and perceived healthier alternatives is the driving factor this market.

The Cider market vendors should focus on grabbing business opportunities from the Distribution channel segment as it accounted for the largest market share in the base year.