Chlorine Market Analysis, Size, and Forecast 2025-2029: APAC (China, India, and Japan), North America (US, Canada, and Mexico), Europe (Germany, France, and UK), South America (Brazil, Argentina, and Colombia), Middle East and Africa (UAE, Saudi Arabia, and South Africa), and Rest of World (ROW)

Chlorine Market Analysis, Size, and Forecast 2025-2029:
APAC (China, India, and Japan), North America (US, Canada, and Mexico), Europe (Germany, France, and UK), South America (Brazil, Argentina, and Colombia), Middle East and Africa (UAE, Saudi Arabia, and South Africa), and Rest of World (ROW)

Published: Dec 2025 311 Pages SKU: IRTNTR44107

Market Overview at a Glance

$8.05 B
Market Opportunity
3.9%
CAGR 2024 - 2029
59.2%
APAC Growth
$13.17 B
EDC or PVC segment 2023

Chlorine Market Size 2025-2029

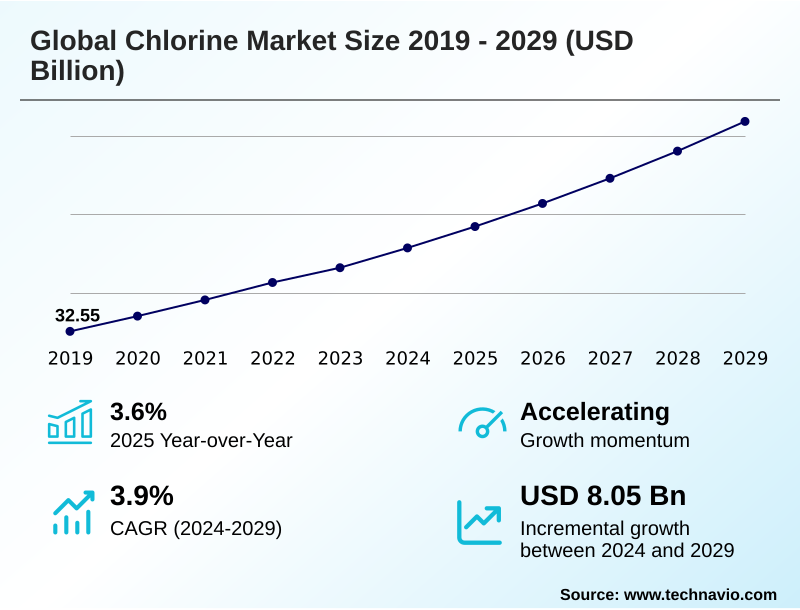
The chlorine market size is valued to increase by USD 8.05 billion, at a CAGR of 3.9% from 2024 to 2029. Surging demand from polyvinyl chloride (PVC) sector as a primary growth catalyst will drive the chlorine market.

Major Market Trends & Insights

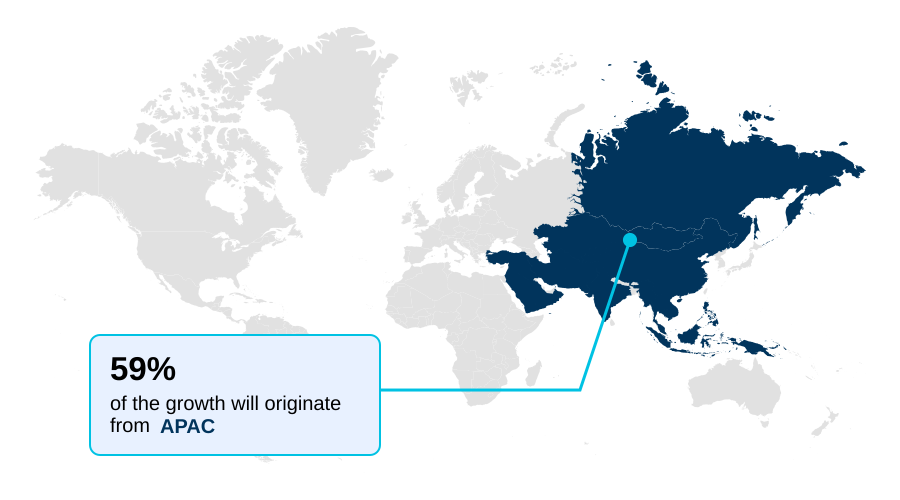
  • APAC dominated the market and accounted for a 59.2% growth during the forecast period.
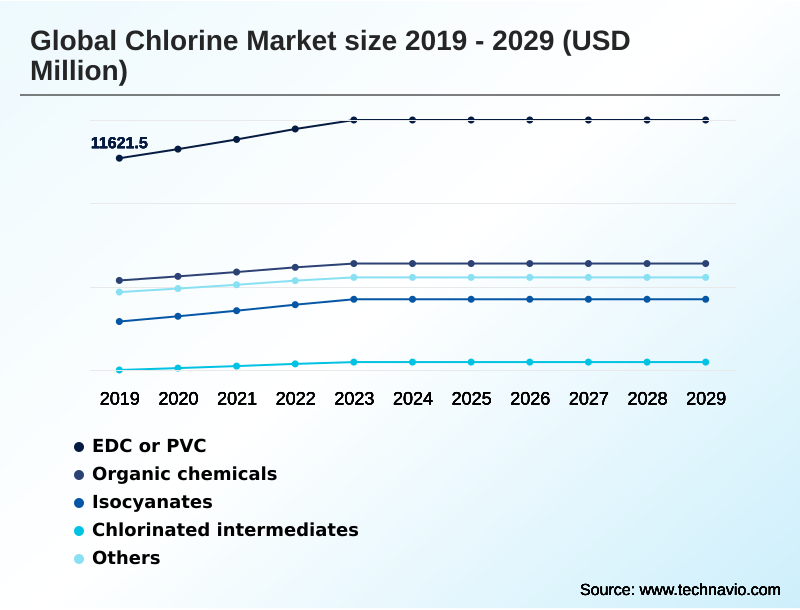
  • By Application - EDC or PVC segment was valued at USD 13.17 billion in 2023
  • By End-user - Water treatment segment accounted for the largest market revenue share in 2023

Market Size & Forecast

  • Market Opportunities: USD 13.36 billion
  • Market Future Opportunities: USD 8.05 billion
  • CAGR from 2024 to 2029 : 3.9%

Market Summary

  • The chlorine market is a cornerstone of the chemical industry, with its performance intrinsically linked to broad industrial and economic activity. Demand is principally driven by its role as a key raw material for vinyls, especially in the production of polyvinyl chloride (PVC), which is essential for construction and infrastructure.
  • The health of the building sector, therefore, acts as a direct barometer for chlorine consumption. Another critical driver is the non-cyclical demand for water disinfection and wastewater treatment, a need amplified by global population growth and urbanization.
  • A significant trend shaping the market is the industry-wide transition to more sustainable chlor-alkali production technologies, such as membrane-cell technology, which offers lower energy consumption and a better environmental profile. This move to the Best Available Technique (BAT) is often mandated by stringent regulations.
  • However, producers face the persistent challenge of intense energy dependency, making them vulnerable to volatile electricity markets.
  • For example, an integrated chemical manufacturer must strategically manage its energy procurement, potentially through long-term power purchase agreements, to mitigate the impact of price spikes on the production cost of its downstream chemical derivatives, ensuring the profitability of its polyurethane manufacturing and other isocyanate synthesis operations.

What will be the Size of the Chlorine Market during the forecast period?

Get Key Insights on Market Forecast (PDF) Request Free Sample

How is the Chlorine Market Segmented?

The chlorine industry research report provides comprehensive data (region-wise segment analysis), with forecasts and estimates in "USD million" for the period 2025-2029, as well as historical data from 2019-2023 for the following segments.

  • Application
    • EDC or PVC
    • Organic chemicals
    • Isocyanates
    • Chlorinated intermediates
    • Others
  • End-user
    • Water treatment
    • Pharmaceutical
    • Chemical
    • Others
  • Type
    • Liquid chlorine
    • Chlorine gas
    • Solid chlorine compound
  • Geography
    • APAC
      • China
      • India
      • Japan
    • North America
      • US
      • Canada
      • Mexico
    • Europe
      • Germany
      • France
      • UK
    • South America
      • Brazil
      • Argentina
      • Colombia
    • Middle East and Africa
      • UAE
      • Saudi Arabia
      • South Africa
    • Rest of World (ROW)

By Application Insights

The edc or pvc segment is estimated to witness significant growth during the forecast period.

The EDC/PVC segment is the primary application, serving as a critical indicator for the market. Production of polyvinyl chloride (PVC) starts with reacting chlorine with ethylene to form ethylene dichloride (EDC), which is then converted to vinyl chloride monomer (VCM).

This role as a raw material for vinyls makes it a foundational commodity chemical production process.

The entire value chain, from the chlor-alkali process to downstream chemical derivatives, is shaped by demand in the construction sector, which utilizes over 59% of PVC.

In this vertically integrated manufacturing model, the health of the global building industry directly impacts demand for the primary feedstock for chemical manufacturing. PVC resins are essential for pipes, profiles, and flooring.

Request Free Sample

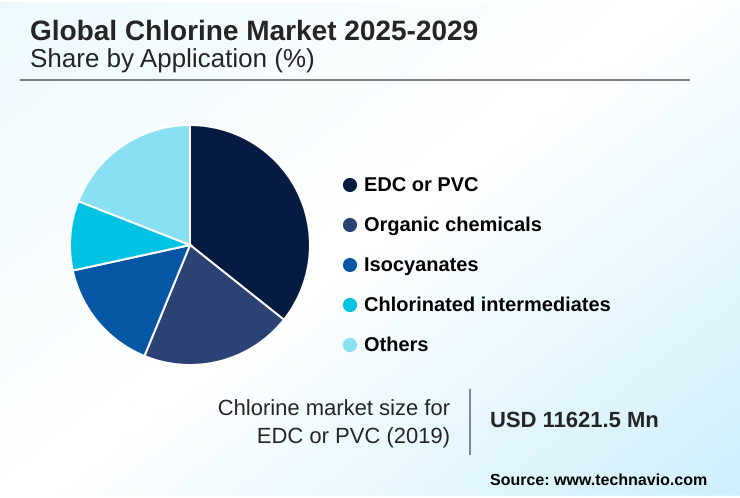
The EDC or PVC segment was valued at USD 13.17 billion in 2023 and showed a gradual increase during the forecast period.

Request Free Sample

Regional Analysis

APAC is estimated to contribute 59.2% to the growth of the global market during the forecast period.Technavio’s analysts have elaborately explained the regional trends and drivers that shape the market during the forecast period.

See How Chlorine Market Demand is Rising in APAC Request Free Sample

The geographic landscape is dominated by the APAC region, accounting for nearly 60% of the market's incremental growth. This is driven by massive infrastructure projects and a burgeoning manufacturing sector that consumes chlorine and its co-product, caustic soda.

In contrast, North American producers benefit from low-cost energy for the energy-intensive electrolysis and have established efficient closed-loop chemical processes.

The European market, while mature, is defined by a push for sustainability and efficiency, having fully adopted membrane cell technology, which reduces electricity usage by over 20%. This technology is critical for producing propylene oxide and epichlorohydrin competitively.

The caustic soda market co-production balance is a key strategic consideration in all regions, influencing supply availability.

Market Dynamics

Our researchers analyzed the data with 2024 as the base year, along with the key drivers, trends, and challenges. A holistic analysis of drivers will help companies refine their marketing strategies to gain a competitive advantage.

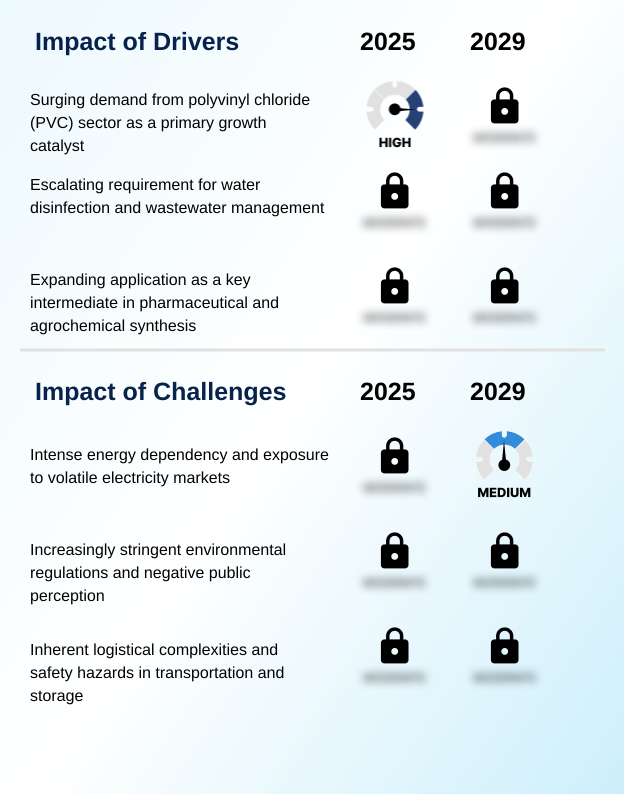
  • Strategic planning is essential for navigating the market's complexities. The primary demand from chlorine applications in pvc production links market health directly to the global construction sector. Concurrently, chlorine use in municipal water treatment provides a stable, non-cyclical foundation. Investment decisions are heavily influenced by chlor-alkali technology investment trends, with a focus on sustainable processes for chlorine production.
  • A key operational challenge is managing energy costs in chlorine manufacturing. Safety remains paramount, with stringent protocols for chlorine transportation and storage safety. High-value growth is found where chlorine as a pharmaceutical intermediate and its role of chlorine in crop protection are expanding.
  • Strategic discussions center on polyurethane synthesis using chlorine derivatives and the efficiency of chlorine dioxide for pulp bleaching. Firms must also address the environmental impact of chlorine byproducts and organochlorine compound formation concerns. Navigating regional chlorine supply chain logistics and ensuring regulatory compliance for chlor-alkali plants are critical.
  • The market is also shaped by the caustic soda market co-production balance and the use of hydrochloric acid as a co-product. Long-term strategy involves developing circular economy models for vinyl products and expanding into high-growth areas like biocide applications in desalination plants, the use of epichlorohydrin production from chlorine, and the market for chlorine derivatives in specialty chemicals.
  • Companies with proactive compliance strategies report up to 40% fewer regulatory incidents than those with reactive approaches.

What are the key market drivers leading to the rise in the adoption of Chlorine Industry?

  • The primary driver propelling market growth is the surging demand from the polyvinyl chloride (PVC) sector, which serves as a fundamental catalyst for chlorine consumption.

  • Growth is propelled by strong demand from end-use industries. The PVC sector remains the largest driver, with chlorine serving as the essential building block for isocyanate synthesis and polyurethane manufacturing.
  • Additionally, chlorine's role as a reagent for organic synthesis in the pharmaceutical sector is a significant high-value driver. Its use in active pharmaceutical ingredient synthesis has been shown to improve process yields by 5-8%.
  • It also serves as a critical intermediate for agrochemicals and crop protection chemicals, supporting global food security.
  • Demand for MDI and TDI, key precursors for polyurethanes, is tied to the automotive and construction industries, making water disinfection a more stable demand pillar.

What are the market trends shaping the Chlorine Industry?

  • A key trend influencing market dynamics is the accelerated transition toward more sustainable chlor-alkali production technologies. This shift is driven by environmental regulations and the pursuit of greater operational and energy efficiency.

  • A key trend is the accelerated shift toward sustainable production with membrane-cell technology, now the Best Available Technique (BAT). This move, which includes the mercury-cell process phase-out, helps producers manage the diaphragm-cell process replacement and can reduce energy consumption by up to 25%.
  • A second powerful trend is the focus on water security, which boosts demand for chlorine as a public health disinfectant. Its use as a disinfectant for municipal water and industrial water systems sanitizer is expanding. This is prompting innovation in sodium hypochlorite and calcium hypochlorite formulations, both critical sanitation chemical products that also find use in swimming pool sanitization.

What challenges does the Chlorine Industry face during its growth?

  • A primary challenge affecting industry growth is the intense energy dependency of the chlor-alkali process and the market's resulting exposure to volatile electricity prices.

  • The market faces significant challenges, primarily the high costs of the chlor-alkali process, which can increase operating expenses by over 50% during electricity price spikes. This pressure drives the search for green chemistry alternatives. A second major challenge involves logistics and safety.
  • As a toxic by inhalation (TIH) material, chlorine requires specialized compressed gas transportation, and new regulations have increased compliance overhead by up to 20%. Concerns over organochlorine compounds and the environmental impact of chlorine byproducts are leading to stricter rules. Managing these issues while producing chlorinated solvents and other chlorinated intermediates requires significant capital investment and operational discipline.

Exclusive Technavio Analysis on Customer Landscape

The chlorine market forecasting report includes the adoption lifecycle of the market, covering from the innovator’s stage to the laggard’s stage. It focuses on adoption rates in different regions based on penetration. Furthermore, the chlorine market report also includes key purchase criteria and drivers of price sensitivity to help companies evaluate and develop their market growth analysis strategies.

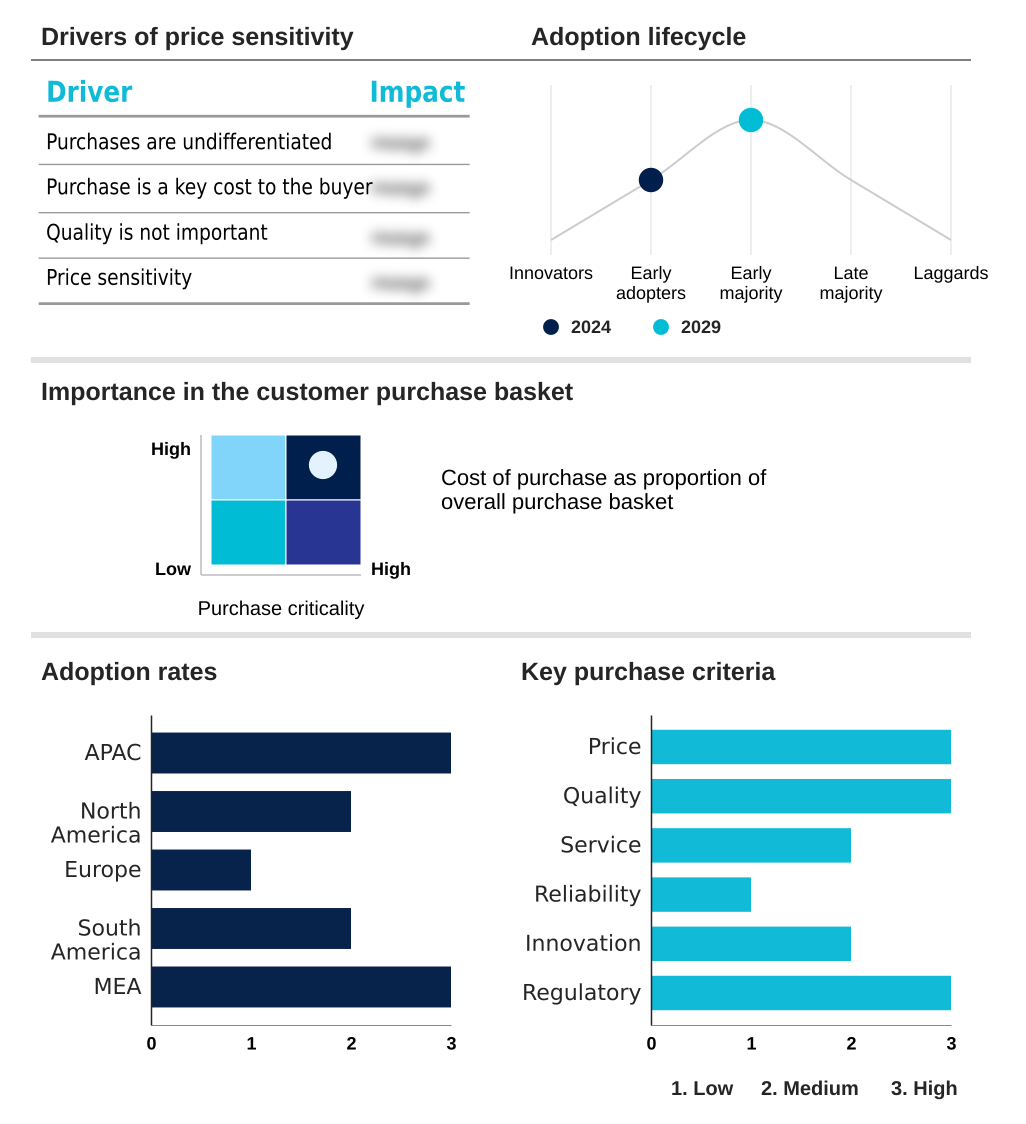
Customer Landscape of Chlorine Industry

Competitive Landscape

Companies are implementing various strategies, such as strategic alliances, chlorine market forecast, partnerships, mergers and acquisitions, geographical expansion, and product/service launches, to enhance their presence in the industry.

Aditya Birla Chemicals - This portfolio of chlor-alkali products, including liquid chlorine and caustic soda, serves key applications in water treatment and chemical processing.

The industry research and growth report includes detailed analyses of the competitive landscape of the market and information about key companies, including:

  • Aditya Birla Chemicals
  • Asahi Kasei Corp.
  • BASF SE
  • Braskem SA
  • Covestro AG
  • Dow Chemical Co.
  • Formosa Plastics Corp.
  • INEOS Group Holdings S.A.
  • Lanxess AG
  • Nouryon Chemicals Holding
  • Occidental Petroleum Corp.
  • Olin Corp.
  • Reliance Industries Ltd.
  • Saudi Basic Industries
  • Shin Etsu Chemical Co. Ltd.
  • Tata Chemicals Ltd.
  • Tosoh Corp.
  • Westlake Corp.

Qualitative and quantitative analysis of companies has been conducted to help clients understand the wider business environment as well as the strengths and weaknesses of key industry players. Data is qualitatively analyzed to categorize companies as pure play, category-focused, industry-focused, and diversified; it is quantitatively analyzed to categorize companies as dominant, leading, strong, tentative, and weak.

Recent Development and News in Chlorine market

  • In November 2024, Covestro AG finalizes a 15-year power purchase agreement with a new offshore wind farm to supply its chlor-alkali facility in Antwerp, aiming to reduce energy cost volatility.
  • In January 2025, Westlake Corp. completes the debottlenecking of its PVC resin plant in Plaquemine, Louisiana, increasing capacity to meet sustained demand from US infrastructure projects.
  • In March 2025, Olin Corp. enters a strategic partnership to supply high-purity calcium hypochlorite for decentralized water treatment systems being deployed across Southeast Asia.
  • In September 2024, INEOS Group Holdings S.A. announces the successful conversion of its final diaphragm-cell production line to advanced membrane-cell technology at its facility in Germany, achieving a 20% reduction in electricity consumption.

Dive into Technavio’s robust research methodology, blending expert interviews, extensive data synthesis, and validated models for unparalleled Chlorine Market insights. See full methodology.

Market Scope
Page number 311
Base year 2024
Historic period 2019-2023
Forecast period 2025-2029
Growth momentum & CAGR Accelerate at a CAGR of 3.9%
Market growth 2025-2029 USD 8051.7 million
Market structure Fragmented
YoY growth 2024-2025(%) 3.6%
Key countries China, India, Japan, South Korea, Australia, Indonesia, US, Canada, Mexico, Germany, France, UK, Italy, Spain, The Netherlands, Brazil, Argentina, Colombia, UAE, Saudi Arabia, South Africa, Israel and Turkey
Competitive landscape Leading Companies, Market Positioning of Companies, Competitive Strategies, and Industry Risks

Request Free Sample

Research Analyst Overview

  • The chlorine market is evolving beyond a simple commodity, driven by a mandatory shift in its foundational chlor-alkali process. The industry-wide mercury-cell process phase-out and replacement of the diaphragm-cell process are now nearly complete, with membrane-cell technology established as the Best Available Technique (BAT).
  • This transition, driven by regulatory pressure, is not just about compliance but core strategy, with firms achieving up to a 25% reduction in energy consumption. The market's primary offtake remains the synthesis of ethylene dichloride (EDC) and vinyl chloride monomer (VCM) for polyvinyl chloride (PVC) production.
  • However, high-value applications are growing, including the use of chlorine for isocyanate synthesis for polyurethane manufacturing and as a feedstock for propylene oxide via the chlorohydrin process. Phosgene production continues to feed the demand for MDI and TDI. Essential public health applications such as water disinfection and wastewater treatment, using sodium hypochlorite and calcium hypochlorite, provide a stable demand base.
  • The versatility of chlorine is further seen in the synthesis of chlorinated intermediates, its use in active pharmaceutical ingredient synthesis and crop protection chemicals, and its role as a biocide for desalination. Even applications like steel pickling with hydrochloric acid (HCl) and elemental chlorine free (ECF) bleaching highlight its industrial breadth.
  • Strategic planning must now account for the circular economy in chemicals, the management of organochlorine compounds, and the logistics of a toxic by inhalation (TIH) material.

What are the Key Data Covered in this Chlorine Market Research and Growth Report?

  • What is the expected growth of the Chlorine Market between 2025 and 2029?

    • USD 8.05 billion, at a CAGR of 3.9%

  • What segmentation does the market report cover?

    • The report is segmented by Application (EDC or PVC, Organic chemicals, Isocyanates, Chlorinated intermediates, and Others), End-user (Water treatment, Pharmaceutical, Chemical, and Others), Type (Liquid chlorine, Chlorine gas, and Solid chlorine compound) and Geography (APAC, North America, Europe, South America, Middle East and Africa)

  • Which regions are analyzed in the report?

    • APAC, North America, Europe, South America and Middle East and Africa

  • What are the key growth drivers and market challenges?

    • Surging demand from polyvinyl chloride (PVC) sector as a primary growth catalyst, Intense energy dependency and exposure to volatile electricity markets

  • Who are the major players in the Chlorine Market?

    • Aditya Birla Chemicals, Asahi Kasei Corp., BASF SE, Braskem SA, Covestro AG, Dow Chemical Co., Formosa Plastics Corp., INEOS Group Holdings S.A., Lanxess AG, Nouryon Chemicals Holding, Occidental Petroleum Corp., Olin Corp., Reliance Industries Ltd., Saudi Basic Industries, Shin Etsu Chemical Co. Ltd., Tata Chemicals Ltd., Tosoh Corp. and Westlake Corp.

Market Research Insights

  • Market dynamics are shaped by a complex interplay of industrial demand and operational pressures. As a critical reagent for organic synthesis, chlorine's consumption is tied to manufacturing output, yet its use as a disinfectant for municipal water provides a stable, non-cyclical demand floor. Companies are navigating this landscape by focusing on efficiency.
  • The transition to advanced membrane-cell processes from older methods has been shown to reduce electricity consumption by up to 25%, directly impacting production costs. In downstream applications, optimizing the use of chlorine as a bleaching agent for pulp can improve process efficiency by over 10%.
  • Furthermore, deploying automated dosing systems for chlorine as an industrial water systems sanitizer can decrease chemical waste by 15%, enhancing both sustainability and profitability. These operational improvements are key to maintaining competitiveness in a market sensitive to energy and regulatory pressures.

We can help! Our analysts can customize this chlorine market research report to meet your requirements.

Get in touch

1. Executive Summary

1.1 Market overview

Executive Summary - Chart on Market Overview
Executive Summary - Data Table on Market Overview
Executive Summary - Chart on Global Market Characteristics
Executive Summary - Chart on Market by Geography
Executive Summary - Chart on Market Segmentation by Application
Executive Summary - Chart on Market Segmentation by End-user
Executive Summary - Chart on Market Segmentation by Type
Executive Summary - Chart on Incremental Growth
Executive Summary - Data Table on Incremental Growth
Executive Summary - Chart on Company Market Positioning

2. Technavio Analysis

2.1 Analysis of price sensitivity, lifecycle, customer purchase basket, adoption rates, and purchase criteria

2.2 Criticality of inputs and Factors of differentiation

Chart on Overview on criticality of inputs and factors of differentiation

2.3 Factors of disruption

Chart on Overview on factors of disruption

2.4 Impact of drivers and challenges

Chart on Impact of drivers and challenges in 2024 and 2029

3. Market Landscape

3.1 Market ecosystem

Chart on Parent Market
Data Table on - Parent Market

3.2 Market characteristics

Chart on Market characteristics analysis

3.3 Value chain analysis

Chart on Value chain analysis

4. Market Sizing

4.1 Market definition

Data Table on Offerings of companies included in the market definition

4.2 Market segment analysis

Market segments

4.3 Market size 2024

4.4 Market outlook: Forecast for 2024-2029

Chart on Global - Market size and forecast 2024-2029 ($ million)
Data Table on Global - Market size and forecast 2024-2029 ($ million)
Chart on Global Market: Year-over-year growth 2024-2029 (%)
Data Table on Global Market: Year-over-year growth 2024-2029 (%)

5. Historic Market Size

5.1 Global Chlorine Market 2019 - 2023

Historic Market Size - Data Table on Global Chlorine Market 2019 - 2023 ($ million)

5.2 Application segment analysis 2019 - 2023

Historic Market Size - Application Segment 2019 - 2023 ($ million)

5.3 End-user segment analysis 2019 - 2023

Historic Market Size - End-user Segment 2019 - 2023 ($ million)

5.4 Type segment analysis 2019 - 2023

Historic Market Size - Type Segment 2019 - 2023 ($ million)

5.5 Geography segment analysis 2019 - 2023

Historic Market Size - Geography Segment 2019 - 2023 ($ million)

5.6 Country segment analysis 2019 - 2023

Historic Market Size - Country Segment 2019 - 2023 ($ million)

6. Qualitative Analysis

6.1 Impact of AI on Global Chlorine Market

7. Five Forces Analysis

7.1 Five forces summary

Five forces analysis - Comparison between 2024 and 2029

7.2 Bargaining power of buyers

Bargaining power of buyers - Impact of key factors 2024 and 2029

7.3 Bargaining power of suppliers

Bargaining power of suppliers - Impact of key factors in 2024 and 2029

7.4 Threat of new entrants

Threat of new entrants - Impact of key factors in 2024 and 2029

7.5 Threat of substitutes

Threat of substitutes - Impact of key factors in 2024 and 2029

7.6 Threat of rivalry

Threat of rivalry - Impact of key factors in 2024 and 2029

7.7 Market condition

Chart on Market condition - Five forces 2024 and 2029

8. Market Segmentation by Application

8.1 Market segments

Chart on Application - Market share 2024-2029 (%)
Data Table on Application - Market share 2024-2029 (%)

8.2 Comparison by Application

Chart on Comparison by Application
Data Table on Comparison by Application

8.3 EDC or PVC - Market size and forecast 2024-2029

Chart on EDC or PVC - Market size and forecast 2024-2029 ($ million)
Data Table on EDC or PVC - Market size and forecast 2024-2029 ($ million)
Chart on EDC or PVC - Year-over-year growth 2024-2029 (%)
Data Table on EDC or PVC - Year-over-year growth 2024-2029 (%)

8.4 Organic chemicals - Market size and forecast 2024-2029

Chart on Organic chemicals - Market size and forecast 2024-2029 ($ million)
Data Table on Organic chemicals - Market size and forecast 2024-2029 ($ million)
Chart on Organic chemicals - Year-over-year growth 2024-2029 (%)
Data Table on Organic chemicals - Year-over-year growth 2024-2029 (%)

8.5 Isocyanates - Market size and forecast 2024-2029

Chart on Isocyanates - Market size and forecast 2024-2029 ($ million)
Data Table on Isocyanates - Market size and forecast 2024-2029 ($ million)
Chart on Isocyanates - Year-over-year growth 2024-2029 (%)
Data Table on Isocyanates - Year-over-year growth 2024-2029 (%)

8.6 Chlorinated intermediates - Market size and forecast 2024-2029

Chart on Chlorinated intermediates - Market size and forecast 2024-2029 ($ million)
Data Table on Chlorinated intermediates - Market size and forecast 2024-2029 ($ million)
Chart on Chlorinated intermediates - Year-over-year growth 2024-2029 (%)
Data Table on Chlorinated intermediates - Year-over-year growth 2024-2029 (%)

8.7 Others - Market size and forecast 2024-2029

Chart on Others - Market size and forecast 2024-2029 ($ million)
Data Table on Others - Market size and forecast 2024-2029 ($ million)
Chart on Others - Year-over-year growth 2024-2029 (%)
Data Table on Others - Year-over-year growth 2024-2029 (%)

8.8 Market opportunity by Application

Market opportunity by Application ($ million)
Data Table on Market opportunity by Application ($ million)

9. Market Segmentation by End-user

9.1 Market segments

Chart on End-user - Market share 2024-2029 (%)
Data Table on End-user - Market share 2024-2029 (%)

9.2 Comparison by End-user

Chart on Comparison by End-user
Data Table on Comparison by End-user

9.3 Water treatment - Market size and forecast 2024-2029

Chart on Water treatment - Market size and forecast 2024-2029 ($ million)
Data Table on Water treatment - Market size and forecast 2024-2029 ($ million)
Chart on Water treatment - Year-over-year growth 2024-2029 (%)
Data Table on Water treatment - Year-over-year growth 2024-2029 (%)

9.4 Pharmaceutical - Market size and forecast 2024-2029

Chart on Pharmaceutical - Market size and forecast 2024-2029 ($ million)
Data Table on Pharmaceutical - Market size and forecast 2024-2029 ($ million)
Chart on Pharmaceutical - Year-over-year growth 2024-2029 (%)
Data Table on Pharmaceutical - Year-over-year growth 2024-2029 (%)

9.5 Chemical - Market size and forecast 2024-2029

Chart on Chemical - Market size and forecast 2024-2029 ($ million)
Data Table on Chemical - Market size and forecast 2024-2029 ($ million)
Chart on Chemical - Year-over-year growth 2024-2029 (%)
Data Table on Chemical - Year-over-year growth 2024-2029 (%)

9.6 Others - Market size and forecast 2024-2029

Chart on Others - Market size and forecast 2024-2029 ($ million)
Data Table on Others - Market size and forecast 2024-2029 ($ million)
Chart on Others - Year-over-year growth 2024-2029 (%)
Data Table on Others - Year-over-year growth 2024-2029 (%)

9.7 Market opportunity by End-user

Market opportunity by End-user ($ million)
Data Table on Market opportunity by End-user ($ million)

10. Market Segmentation by Type

10.1 Market segments

Chart on Type - Market share 2024-2029 (%)
Data Table on Type - Market share 2024-2029 (%)

10.2 Comparison by Type

Chart on Comparison by Type
Data Table on Comparison by Type

10.3 Liquid chlorine - Market size and forecast 2024-2029

Chart on Liquid chlorine - Market size and forecast 2024-2029 ($ million)
Data Table on Liquid chlorine - Market size and forecast 2024-2029 ($ million)
Chart on Liquid chlorine - Year-over-year growth 2024-2029 (%)
Data Table on Liquid chlorine - Year-over-year growth 2024-2029 (%)

10.4 Chlorine gas - Market size and forecast 2024-2029

Chart on Chlorine gas - Market size and forecast 2024-2029 ($ million)
Data Table on Chlorine gas - Market size and forecast 2024-2029 ($ million)
Chart on Chlorine gas - Year-over-year growth 2024-2029 (%)
Data Table on Chlorine gas - Year-over-year growth 2024-2029 (%)

10.5 Solid chlorine compound - Market size and forecast 2024-2029

Chart on Solid chlorine compound - Market size and forecast 2024-2029 ($ million)
Data Table on Solid chlorine compound - Market size and forecast 2024-2029 ($ million)
Chart on Solid chlorine compound - Year-over-year growth 2024-2029 (%)
Data Table on Solid chlorine compound - Year-over-year growth 2024-2029 (%)

10.6 Market opportunity by Type

Market opportunity by Type ($ million)
Data Table on Market opportunity by Type ($ million)

11. Customer Landscape

11.1 Customer landscape overview

Analysis of price sensitivity, lifecycle, customer purchase basket, adoption rates, and purchase criteria

12. Geographic Landscape

12.1 Geographic segmentation

Chart on Market share by geography 2024-2029 (%)
Data Table on Market share by geography 2024-2029 (%)

12.2 Geographic comparison

Chart on Geographic comparison
Data Table on Geographic comparison

12.3 APAC - Market size and forecast 2024-2029

Chart on APAC - Market size and forecast 2024-2029 ($ million)
Data Table on APAC - Market size and forecast 2024-2029 ($ million)
Chart on APAC - Year-over-year growth 2024-2029 (%)
Data Table on APAC - Year-over-year growth 2024-2029 (%)
Chart on Regional Comparison - APAC
Data Table on Regional Comparison - APAC

12.3.1 China - Market size and forecast 2024-2029

Chart on China - Market size and forecast 2024-2029 ($ million)
Data Table on China - Market size and forecast 2024-2029 ($ million)
Chart on China - Year-over-year growth 2024-2029 (%)
Data Table on China - Year-over-year growth 2024-2029 (%)

12.3.2 India - Market size and forecast 2024-2029

Chart on India - Market size and forecast 2024-2029 ($ million)
Data Table on India - Market size and forecast 2024-2029 ($ million)
Chart on India - Year-over-year growth 2024-2029 (%)
Data Table on India - Year-over-year growth 2024-2029 (%)

12.3.3 Japan - Market size and forecast 2024-2029

Chart on Japan - Market size and forecast 2024-2029 ($ million)
Data Table on Japan - Market size and forecast 2024-2029 ($ million)
Chart on Japan - Year-over-year growth 2024-2029 (%)
Data Table on Japan - Year-over-year growth 2024-2029 (%)

12.3.4 South Korea - Market size and forecast 2024-2029

Chart on South Korea - Market size and forecast 2024-2029 ($ million)
Data Table on South Korea - Market size and forecast 2024-2029 ($ million)
Chart on South Korea - Year-over-year growth 2024-2029 (%)
Data Table on South Korea - Year-over-year growth 2024-2029 (%)

12.3.5 Australia - Market size and forecast 2024-2029

Chart on Australia - Market size and forecast 2024-2029 ($ million)
Data Table on Australia - Market size and forecast 2024-2029 ($ million)
Chart on Australia - Year-over-year growth 2024-2029 (%)
Data Table on Australia - Year-over-year growth 2024-2029 (%)

12.3.6 Indonesia - Market size and forecast 2024-2029

Chart on Indonesia - Market size and forecast 2024-2029 ($ million)
Data Table on Indonesia - Market size and forecast 2024-2029 ($ million)
Chart on Indonesia - Year-over-year growth 2024-2029 (%)
Data Table on Indonesia - Year-over-year growth 2024-2029 (%)

12.4 North America - Market size and forecast 2024-2029

Chart on North America - Market size and forecast 2024-2029 ($ million)
Data Table on North America - Market size and forecast 2024-2029 ($ million)
Chart on North America - Year-over-year growth 2024-2029 (%)
Data Table on North America - Year-over-year growth 2024-2029 (%)
Chart on Regional Comparison - North America
Data Table on Regional Comparison - North America

12.4.1 US - Market size and forecast 2024-2029

Chart on US - Market size and forecast 2024-2029 ($ million)
Data Table on US - Market size and forecast 2024-2029 ($ million)
Chart on US - Year-over-year growth 2024-2029 (%)
Data Table on US - Year-over-year growth 2024-2029 (%)

12.4.2 Canada - Market size and forecast 2024-2029

Chart on Canada - Market size and forecast 2024-2029 ($ million)
Data Table on Canada - Market size and forecast 2024-2029 ($ million)
Chart on Canada - Year-over-year growth 2024-2029 (%)
Data Table on Canada - Year-over-year growth 2024-2029 (%)

12.4.3 Mexico - Market size and forecast 2024-2029

Chart on Mexico - Market size and forecast 2024-2029 ($ million)
Data Table on Mexico - Market size and forecast 2024-2029 ($ million)
Chart on Mexico - Year-over-year growth 2024-2029 (%)
Data Table on Mexico - Year-over-year growth 2024-2029 (%)

12.5 Europe - Market size and forecast 2024-2029

Chart on Europe - Market size and forecast 2024-2029 ($ million)
Data Table on Europe - Market size and forecast 2024-2029 ($ million)
Chart on Europe - Year-over-year growth 2024-2029 (%)
Data Table on Europe - Year-over-year growth 2024-2029 (%)
Chart on Regional Comparison - Europe
Data Table on Regional Comparison - Europe

12.5.1 Germany - Market size and forecast 2024-2029

Chart on Germany - Market size and forecast 2024-2029 ($ million)
Data Table on Germany - Market size and forecast 2024-2029 ($ million)
Chart on Germany - Year-over-year growth 2024-2029 (%)
Data Table on Germany - Year-over-year growth 2024-2029 (%)

12.5.2 France - Market size and forecast 2024-2029

Chart on France - Market size and forecast 2024-2029 ($ million)
Data Table on France - Market size and forecast 2024-2029 ($ million)
Chart on France - Year-over-year growth 2024-2029 (%)
Data Table on France - Year-over-year growth 2024-2029 (%)

12.5.3 UK - Market size and forecast 2024-2029

Chart on UK - Market size and forecast 2024-2029 ($ million)
Data Table on UK - Market size and forecast 2024-2029 ($ million)
Chart on UK - Year-over-year growth 2024-2029 (%)
Data Table on UK - Year-over-year growth 2024-2029 (%)

12.5.4 Italy - Market size and forecast 2024-2029

Chart on Italy - Market size and forecast 2024-2029 ($ million)
Data Table on Italy - Market size and forecast 2024-2029 ($ million)
Chart on Italy - Year-over-year growth 2024-2029 (%)
Data Table on Italy - Year-over-year growth 2024-2029 (%)

12.5.5 Spain - Market size and forecast 2024-2029

Chart on Spain - Market size and forecast 2024-2029 ($ million)
Data Table on Spain - Market size and forecast 2024-2029 ($ million)
Chart on Spain - Year-over-year growth 2024-2029 (%)
Data Table on Spain - Year-over-year growth 2024-2029 (%)

12.5.6 The Netherlands - Market size and forecast 2024-2029

Chart on The Netherlands - Market size and forecast 2024-2029 ($ million)
Data Table on The Netherlands - Market size and forecast 2024-2029 ($ million)
Chart on The Netherlands - Year-over-year growth 2024-2029 (%)
Data Table on The Netherlands - Year-over-year growth 2024-2029 (%)

12.6 South America - Market size and forecast 2024-2029

Chart on South America - Market size and forecast 2024-2029 ($ million)
Data Table on South America - Market size and forecast 2024-2029 ($ million)
Chart on South America - Year-over-year growth 2024-2029 (%)
Data Table on South America - Year-over-year growth 2024-2029 (%)
Chart on Regional Comparison - South America
Data Table on Regional Comparison - South America

12.6.1 Brazil - Market size and forecast 2024-2029

Chart on Brazil - Market size and forecast 2024-2029 ($ million)
Data Table on Brazil - Market size and forecast 2024-2029 ($ million)
Chart on Brazil - Year-over-year growth 2024-2029 (%)
Data Table on Brazil - Year-over-year growth 2024-2029 (%)

12.6.2 Argentina - Market size and forecast 2024-2029

Chart on Argentina - Market size and forecast 2024-2029 ($ million)
Data Table on Argentina - Market size and forecast 2024-2029 ($ million)
Chart on Argentina - Year-over-year growth 2024-2029 (%)
Data Table on Argentina - Year-over-year growth 2024-2029 (%)

12.6.3 Colombia - Market size and forecast 2024-2029

Chart on Colombia - Market size and forecast 2024-2029 ($ million)
Data Table on Colombia - Market size and forecast 2024-2029 ($ million)
Chart on Colombia - Year-over-year growth 2024-2029 (%)
Data Table on Colombia - Year-over-year growth 2024-2029 (%)

12.7 Middle East and Africa - Market size and forecast 2024-2029

Chart on Middle East and Africa - Market size and forecast 2024-2029 ($ million)
Data Table on Middle East and Africa - Market size and forecast 2024-2029 ($ million)
Chart on Middle East and Africa - Year-over-year growth 2024-2029 (%)
Data Table on Middle East and Africa - Year-over-year growth 2024-2029 (%)
Chart on Regional Comparison - Middle East and Africa
Data Table on Regional Comparison - Middle East and Africa

12.7.1 UAE - Market size and forecast 2024-2029

Chart on UAE - Market size and forecast 2024-2029 ($ million)
Data Table on UAE - Market size and forecast 2024-2029 ($ million)
Chart on UAE - Year-over-year growth 2024-2029 (%)
Data Table on UAE - Year-over-year growth 2024-2029 (%)

12.7.2 Saudi Arabia - Market size and forecast 2024-2029

Chart on Saudi Arabia - Market size and forecast 2024-2029 ($ million)
Data Table on Saudi Arabia - Market size and forecast 2024-2029 ($ million)
Chart on Saudi Arabia - Year-over-year growth 2024-2029 (%)
Data Table on Saudi Arabia - Year-over-year growth 2024-2029 (%)

12.7.3 South Africa - Market size and forecast 2024-2029

Chart on South Africa - Market size and forecast 2024-2029 ($ million)
Data Table on South Africa - Market size and forecast 2024-2029 ($ million)
Chart on South Africa - Year-over-year growth 2024-2029 (%)
Data Table on South Africa - Year-over-year growth 2024-2029 (%)

12.7.4 Israel - Market size and forecast 2024-2029

Chart on Israel - Market size and forecast 2024-2029 ($ million)
Data Table on Israel - Market size and forecast 2024-2029 ($ million)
Chart on Israel - Year-over-year growth 2024-2029 (%)
Data Table on Israel - Year-over-year growth 2024-2029 (%)

12.7.5 Turkey - Market size and forecast 2024-2029

Chart on Turkey - Market size and forecast 2024-2029 ($ million)
Data Table on Turkey - Market size and forecast 2024-2029 ($ million)
Chart on Turkey - Year-over-year growth 2024-2029 (%)
Data Table on Turkey - Year-over-year growth 2024-2029 (%)

12.8 Market opportunity by geography

Market opportunity by geography ($ million)
Data Tables on Market opportunity by geography ($ million)

13. Drivers, Challenges, and Opportunity

13.1 Market drivers

Surging demand from polyvinyl chloride (PVC) sector as a primary growth catalyst
Escalating requirement for water disinfection and wastewater management
Expanding application as a key intermediate in pharmaceutical and agrochemical synthesis

13.2 Market challenges

Intense energy dependency and exposure to volatile electricity markets
Increasingly stringent environmental regulations and negative public perception
Inherent logistical complexities and safety hazards in transportation and storage

13.3 Impact of drivers and challenges

Impact of drivers and challenges in 2024 and 2029

13.4 Market opportunities

Accelerated transition to sustainable chlor-alkali production technologies
Surging demand from infrastructure and construction fueling polyvinyl chloride (PVC) growth
Heightened focus on water security and public health driving disinfectant demand

14. Competitive Landscape

14.1 Overview

14.2

Overview on criticality of inputs and factors of differentiation

14.3 Landscape disruption

Overview on factors of disruption

14.4 Industry risks

Impact of key risks on business

15. Competitive Analysis

15.1 Companies profiled

Companies covered

15.2 Company ranking index

15.3 Market positioning of companies

Matrix on companies position and classification

15.4 Aditya Birla Chemicals

Aditya Birla Chemicals - Overview
Aditya Birla Chemicals - Product / Service
Aditya Birla Chemicals - Key offerings
SWOT

15.5 BASF SE

BASF SE - Overview
BASF SE - Business segments
BASF SE - Key news
BASF SE - Key offerings
BASF SE - Segment focus
SWOT

15.6 Braskem SA

Braskem SA - Overview
Braskem SA - Business segments
Braskem SA - Key offerings
Braskem SA - Segment focus
SWOT

15.7 Covestro AG

Covestro AG - Overview
Covestro AG - Business segments
Covestro AG - Key news
Covestro AG - Key offerings
Covestro AG - Segment focus
SWOT

15.8 Dow Chemical Co.

Dow Chemical Co. - Overview
Dow Chemical Co. - Business segments
Dow Chemical Co. - Key news
Dow Chemical Co. - Key offerings
Dow Chemical Co. - Segment focus
SWOT

15.9 Formosa Plastics Corp.

Formosa Plastics Corp. - Overview
Formosa Plastics Corp. - Business segments
Formosa Plastics Corp. - Key offerings
Formosa Plastics Corp. - Segment focus
SWOT

15.10 INEOS Group Holdings S.A.

INEOS Group Holdings S.A. - Overview
INEOS Group Holdings S.A. - Product / Service
INEOS Group Holdings S.A. - Key news
INEOS Group Holdings S.A. - Key offerings
SWOT

15.11 Lanxess AG

Lanxess AG - Overview
Lanxess AG - Business segments
Lanxess AG - Key news
Lanxess AG - Key offerings
Lanxess AG - Segment focus
SWOT

15.12 Nouryon Chemicals Holding

Nouryon Chemicals Holding - Overview
Nouryon Chemicals Holding - Product / Service
Nouryon Chemicals Holding - Key offerings
SWOT

15.13 Occidental Petroleum Corp.

Occidental Petroleum Corp. - Overview
Occidental Petroleum Corp. - Business segments
Occidental Petroleum Corp. - Key news
Occidental Petroleum Corp. - Key offerings
Occidental Petroleum Corp. - Segment focus
SWOT

15.14 Olin Corp.

Olin Corp. - Overview
Olin Corp. - Business segments
Olin Corp. - Key offerings
Olin Corp. - Segment focus
SWOT

15.15 Saudi Basic Industries

Saudi Basic Industries - Overview
Saudi Basic Industries - Business segments
Saudi Basic Industries - Key offerings
Saudi Basic Industries - Segment focus
SWOT

15.16 Tata Chemicals Ltd.

Tata Chemicals Ltd. - Overview
Tata Chemicals Ltd. - Business segments
Tata Chemicals Ltd. - Key offerings
Tata Chemicals Ltd. - Segment focus
SWOT

15.17 Tosoh Corp.

Tosoh Corp. - Overview
Tosoh Corp. - Business segments
Tosoh Corp. - Key offerings
Tosoh Corp. - Segment focus
SWOT

15.18 Westlake Corp.

Westlake Corp. - Overview
Westlake Corp. - Business segments
Westlake Corp. - Key offerings
Westlake Corp. - Segment focus
SWOT

16. Appendix

16.1 Scope of the report

Market definition
Objectives
Notes and caveats

16.2 Inclusions and exclusions checklist

Inclusions checklist
Exclusions checklist

16.3 Currency conversion rates for US$

16.4 Research methodology

16.5 Data procurement

Information sources

16.6 Data validation

16.7 Validation techniques employed for market sizing

16.8 Data synthesis

16.9 360 degree market analysis

16.10 List of abbreviations

Research Methodology

Technavio presents a detailed picture of the market by way of study, synthesis, and summation of data from multiple sources. The analysts have presented the various facets of the market with a particular focus on identifying the key industry influencers. The data thus presented is comprehensive, reliable, and the result of extensive research, both primary and secondary.

INFORMATION SOURCES

Primary sources

  • Manufacturers and suppliers
  • Channel partners
  • Industry experts
  • Strategic decision makers

Secondary sources

  • Industry journals and periodicals
  • Government data
  • Financial reports of key industry players
  • Historical data
  • Press releases

DATA ANALYSIS

Data Synthesis

  • Collation of data
  • Estimation of key figures
  • Analysis of derived insights

Data Validation

  • Triangulation with data models
  • Reference against proprietary databases
  • Corroboration with industry experts

REPORT WRITING

Qualitative

  • Market drivers
  • Market challenges
  • Market trends
  • Five forces analysis

Quantitative

  • Market size and forecast
  • Market segmentation
  • Geographical insights
  • Competitive landscape

Interested in this report?

Get your sample now to see our research methodology and insights!

Download Now

Frequently Asked Questions

Chlorine market growth will increase by USD 8051.7 million during 2025-2029.

The Chlorine market is expected to grow at a CAGR of 3.9% during 2025-2029.

Chlorine market is segmented by Application (EDC or PVC, Organic chemicals, Isocyanates, Chlorinated intermediates, Others) End-user (Water treatment, Pharmaceutical, Chemical, Others) Type (Liquid chlorine, Chlorine gas, Solid chlorine compound)

Aditya Birla Chemicals, Asahi Kasei Corp., BASF SE, Braskem SA, Covestro AG, Dow Chemical Co., Formosa Plastics Corp., INEOS Group Holdings S.A., Lanxess AG, Nouryon Chemicals Holding, Occidental Petroleum Corp., Olin Corp., Reliance Industries Ltd., Saudi Basic Industries, Shin Etsu Chemical Co. Ltd., Tata Chemicals Ltd., Tosoh Corp., Westlake Corp. are a few of the key vendors in the Chlorine market.

APAC will register the highest growth rate of 59.2% among the other regions. Therefore, the Chlorine market in APAC is expected to garner significant business opportunities for the vendors during the forecast period.

China, India, Japan, South Korea, Australia, Indonesia, US, Canada, Mexico, Germany, France, UK, Italy, Spain, The Netherlands, Brazil, Argentina, Colombia, UAE, Saudi Arabia, South Africa, Israel, Turkey

  • Surging demand from polyvinyl chloride (PVC) sector as a primary growth catalyst is the driving factor this market.

The Chlorine market vendors should focus on grabbing business opportunities from the Application segment as it accounted for the largest market share in the base year.