Cellular Glass Market Analysis, Size, and Forecast 2025-2029: Europe (UK, Germany, and France), North America (US, Canada, and Mexico), APAC (China, Japan, and India), Middle East and Africa (South Africa, Saudi Arabia, and UAE), South America (Brazil, Argentina, and Colombia), and Rest of World (ROW)

Cellular Glass Market Analysis, Size, and Forecast 2025-2029:
Europe (UK, Germany, and France), North America (US, Canada, and Mexico), APAC (China, Japan, and India), Middle East and Africa (South Africa, Saudi Arabia, and UAE), South America (Brazil, Argentina, and Colombia), and Rest of World (ROW)

Published: Dec 2025 281 Pages SKU: IRTNTR76766

Market Overview at a Glance

$137.9 Mn
Market Opportunity
4.1%
CAGR 2024 - 2029
35.1%
North America Growth
$369.6 Mn
Closed glass segment 2023

Cellular Glass Market Size 2025-2029

The cellular glass market size is valued to increase by USD 137.9 million, at a CAGR of 4.1% from 2024 to 2029. Increasing demand for energy-efficient building materials will drive the cellular glass market.

Major Market Trends & Insights

  • North America dominated the market and accounted for a 35.1% growth during the forecast period.
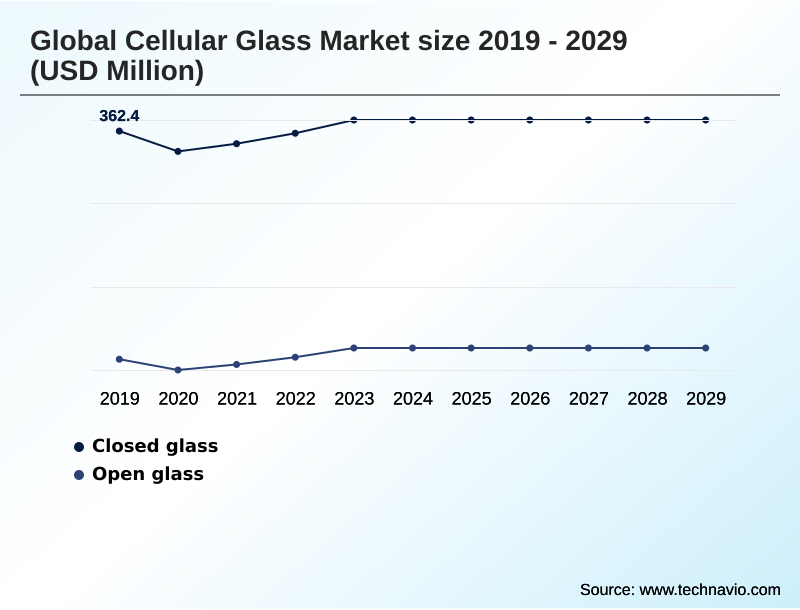
  • By Type - Closed glass segment was valued at USD 369.6 million in 2023
  • By Product Type - Block and shell segment accounted for the largest market revenue share in 2023

Market Size & Forecast

  • Market Opportunities: USD 176.3 million
  • Market Future Opportunities: USD 137.9 million
  • CAGR from 2024 to 2029 : 4.1%

Market Summary

  • The cellular glass market is expanding, driven by the need for high-performance, sustainable insulation. Its unique combination of properties—thermal efficiency, fire resistance, water impermeability, and high compressive strength—makes it essential for demanding applications. In construction, it contributes to green building certifications and long-term energy savings.
  • The industrial sector relies on it for insulating cryogenic and high-temperature systems, where material failure is not an option. For instance, a facility manager overseeing a new cold storage plant must balance the higher upfront cost of cellular glass against its lifecycle benefits, including lower energy bills and zero risk of moisture-related degradation, which could compromise the entire facility.
  • The material's composition from recycled glass also aligns with corporate ESG goals, further propelling its adoption. The cellular glass market continues to evolve as manufacturers innovate to enhance its properties and reduce production costs, broadening its applicability across various sectors.

What will be the Size of the Cellular Glass Market during the forecast period?

Get Key Insights on Market Forecast (PDF) Request Free Sample

How is the Cellular Glass Market Segmented?

The cellular glass industry research report provides comprehensive data (region-wise segment analysis), with forecasts and estimates in "USD million" for the period 2025-2029, as well as historical data from 2019-2023 for the following segments.

  • Type
    • Closed glass
    • Open glass
  • Product type
    • Block and shell
    • Foam glass gravel
  • End-user
    • Construction
    • Industrial
    • Others
  • Geography
    • Europe
      • UK
      • Germany
      • France
    • North America
      • US
      • Canada
      • Mexico
    • APAC
      • China
      • Japan
      • India
    • Middle East and Africa
      • South Africa
      • Saudi Arabia
      • UAE
    • South America
      • Brazil
      • Argentina
      • Colombia
    • Rest of World (ROW)

By Type Insights

The closed glass segment is estimated to witness significant growth during the forecast period.

The closed glass segment, which accounts for over 62% of the market, is defined by its superior material properties.

This type of cellular glass insulation utilizes a closed-cell structure of hermetically sealed cells, providing exceptional thermal performance and creating an effective vapor barrier. Its inherent moisture impermeability makes it a preferred moisture-resistant insulation for creating a high-performance building envelope.

Products like cellular glass block are engineered for high compressive strength, qualifying them as compressive-strength insulation. Made from recycled glass content, this non-combustible material offers excellent thermal insulation properties and is crucial for applications requiring robust and reliable performance.

The material's characteristics also make it suitable for a wide range of building applications where both structural support and insulation are required.

Request Free Sample

The Closed glass segment was valued at USD 369.6 million in 2023 and showed a gradual increase during the forecast period.

Request Free Sample

Regional Analysis

North America is estimated to contribute 35.1% to the growth of the global market during the forecast period.Technavio’s analysts have elaborately explained the regional trends and drivers that shape the market during the forecast period.

See How Cellular Glass Market Demand is Rising in North America Request Free Sample

The global market landscape is led by Europe and North America, with APAC projected to have the fastest growth. North America is set to contribute over 35% of the market's incremental growth, driven by stringent building codes and industrial expansion.

Europe's market is mature, focused on sustainable construction material and renovation projects that require high-performance, rot-proof material. In this region, inorganic insulation is prized for its longevity.

Key applications include sub-slab insulation and lightweight structural fill for infrastructure, where its properties as a closed-pore glass foam prevent moisture issues. This load-bearing thermal insulation is also crucial for cold storage insulation and flat roof insulation systems.

The material's zero ozone depletion potential and low moisture vapor transmission rate support its use in environmentally sensitive projects, boosting its cellular glass r-value proposition for specifiers.

Market Dynamics

Our researchers analyzed the data with 2024 as the base year, along with the key drivers, trends, and challenges. A holistic analysis of drivers will help companies refine their marketing strategies to gain a competitive advantage.

  • When evaluating insulation options, a common comparison is cellular glass vs mineral wool. While both offer thermal benefits, the unique benefits of foam glass gravel include its role as a lightweight fill for civil engineering and its excellent drainage capacity, making it ideal for creating a pervious pavement aggregate.
  • For cellular glass in cryogenic applications, its performance is unmatched due to its non-porous structure, which is also a key factor for its use in various industrial settings. The process of installing cellular glass insulation blocks requires precision, and a primary consideration for project managers is the cost of cellular glass insulation. However, a lifecycle cost analysis often favors it.
  • The material's durability of cellular glass insulation, high fire rating of cellular glass, and its function as a cellular glass as a vapor barrier justify the investment. These qualities make it a prime choice for cellular glass for green roofs and cellular glass for foundation insulation.
  • A cellular glass compressive strength test ensures quality, while its resistance to chemicals is vital for industrial use. The high recycled content in cellular glass also aligns with sustainability goals. For operational planning, its long-term reliability translates to a total cost of ownership that can be up to 20% lower than alternatives in certain high-stakes environments.

What are the key market drivers leading to the rise in the adoption of Cellular Glass Industry?

  • The increasing demand for energy-efficient building materials, driven by stricter building codes and a focus on sustainability, serves as a key driver for the market's growth.

  • The market is propelled by the demand for energy-efficient building materials in critical industrial sectors. The need for effective cryogenic insulation for LNG tanks and cryogenic storage insulation in the chemical industry is a major factor.
  • The material's properties as a non-combustible material and its inherently low thermal conductivity make it an ideal fire resistant insulation, crucial for meeting modern building code compliance.
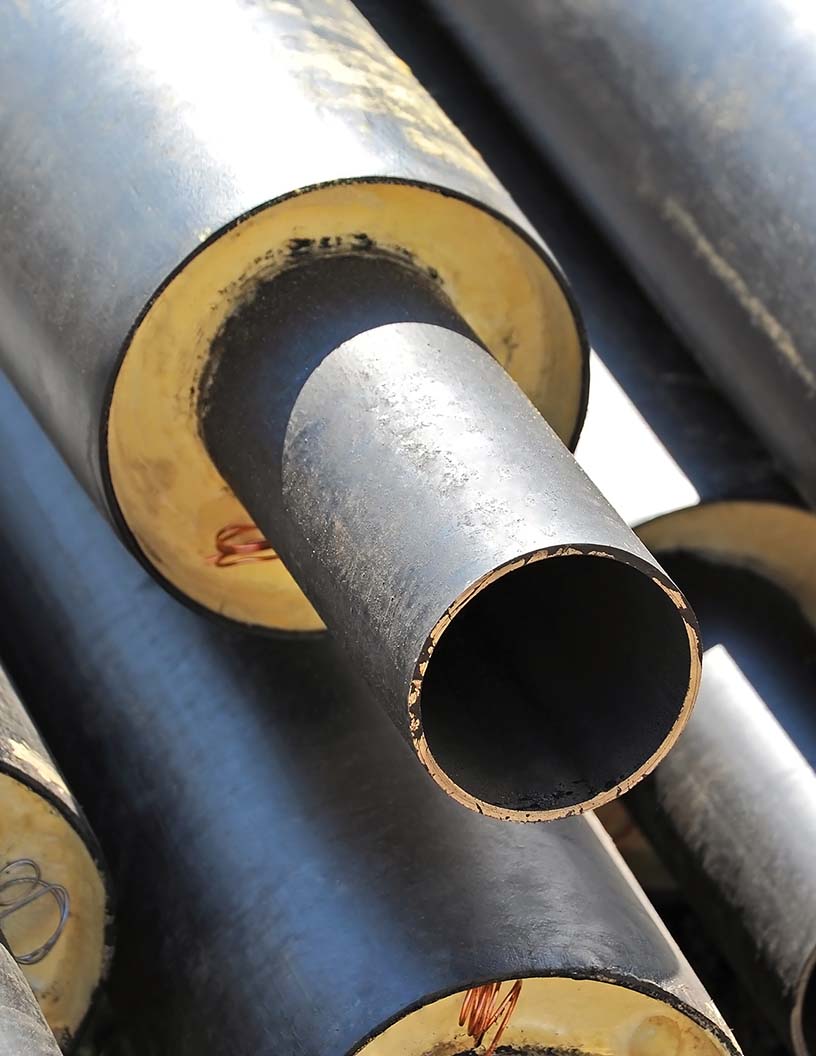
  • For industrial pipe insulation, pipe insulation shells offer reliable thermal performance at a high operating temperature.
  • A comprehensive life cycle assessment often demonstrates that this fireproof building insulation offers lower long-term costs, with facilities reporting energy loss reductions of up to 15%.
  • This makes it a preferred choice for industrial thermal insulation, especially in insulation for chemical plants, where safety and efficiency are paramount.

What are the market trends shaping the Cellular Glass Industry?

  • A significant market trend is the growing adoption of cellular glass in green roof and urban landscaping projects, valued for its lightweight nature and excellent drainage capabilities.

  • A primary trend is the growing use of foam glass gravel as a lightweight aggregate in sustainable infrastructure projects. This ecologically friendly insulation, notable for its high recycled glass content, is becoming integral to green roof insulation and urban landscaping. Its application as a green roof drainage layer and in pervious pavement aggregate systems improves stormwater management by over 30%.
  • The material’s non-capillary structure is also effective for frost heave prevention. As a sustainable building material, it contributes to a significant embodied energy reduction in construction projects. These sustainable insulation solutions are gaining traction, with foam glass for landscaping and as a lightweight fill material seeing increased specification.
  • The market for recycled glass building products is expanding, with foam glass aggregate leading the charge in circular economy applications.

What challenges does the Cellular Glass Industry face during its growth?

  • A primary challenge affecting market growth is the high initial cost of cellular glass when compared to conventional insulation materials, which can deter adoption in cost-sensitive projects.

  • A key challenge is the material's higher initial cost and the specialized cellular glass installation knowledge required, which can impact project budgets and timelines. While its dimensional stability and role in thermal bridge prevention are significant advantages, the technical cellular glass specification can be a hurdle.
  • For instance, ensuring proper use as a structural insulation core within a building envelope insulation system requires skilled labor. Its properties as a pest resistant insulation with excellent sound absorption, contributing to a higher sound transmission class, are premium features. This acid-resistant material also aids in corrosion under insulation prevention.
  • However, comparing cellular glass vs foamglas or other alternatives on price alone overlooks its value as a non-toxic insulation material and its effectiveness in acoustic insulation panels. The perception of complexity in handling the cellular glass block remains a barrier to wider adoption.

Exclusive Technavio Analysis on Customer Landscape

The cellular glass market forecasting report includes the adoption lifecycle of the market, covering from the innovator’s stage to the laggard’s stage. It focuses on adoption rates in different regions based on penetration. Furthermore, the cellular glass market report also includes key purchase criteria and drivers of price sensitivity to help companies evaluate and develop their market growth analysis strategies.

Customer Landscape of Cellular Glass Industry

Competitive Landscape

Companies are implementing various strategies, such as strategic alliances, cellular glass market forecast, partnerships, mergers and acquisitions, geographical expansion, and product/service launches, to enhance their presence in the industry.

Beerenberg AS - A portfolio of cellular glass insulation products, including blocks and pipe sections, delivers durable thermal protection for commercial and industrial applications.

The industry research and growth report includes detailed analyses of the competitive landscape of the market and information about key companies, including:

  • Beerenberg AS
  • Energocell Kft.
  • Excelsior Ceramics
  • Foamit Group
  • Glapor Werk Mitterteich GmbH
  • Huali Thermal Insulation
  • Huaneng Zhongtian Group Co. Ltd.
  • IBSL Group Ltd.
  • Insultherm
  • Misapor AG
  • Owens Corning
  • POLYDROS S.A.
  • REFAGLASS s.r.o.
  • Shanghai Metal Corp.
  • Sun Refractories
  • Wedge Industries Ltd.
  • Zhejiang Dehe Insulation Corp. Ltd.

Qualitative and quantitative analysis of companies has been conducted to help clients understand the wider business environment as well as the strengths and weaknesses of key industry players. Data is qualitatively analyzed to categorize companies as pure play, category-focused, industry-focused, and diversified; it is quantitatively analyzed to categorize companies as dominant, leading, strong, tentative, and weak.

Recent Development and News in Cellular glass market

  • In September, 2024, Glapor Werk Mitterteich GmbH announced a strategic partnership with a leading North American distributor to expand its market presence for cellular glass boards and gravel, targeting large-scale commercial construction projects.
  • In November, 2024, Owens Corning launched a new line of FOAMGLAS insulation with enhanced compressive strength and a 15% improvement in thermal resistance, designed for next-generation cryogenic storage facilities.
  • In January, 2025, Foamit Group completed the acquisition of a regional recycled glass processing firm to secure its raw material supply chain, increasing the recycled content in its foam glass aggregate products to over 95%.
  • In April, 2025, Beerenberg AS reported securing a major contract for insulating a new LNG facility in APAC, leveraging its specialized corrosion-resistant foam glass linings following the region's new stringent maritime environmental regulations.

Dive into Technavio’s robust research methodology, blending expert interviews, extensive data synthesis, and validated models for unparalleled Cellular Glass Market insights. See full methodology.

Market Scope
Page number 281
Base year 2024
Historic period 2019-2023
Forecast period 2025-2029
Growth momentum & CAGR Accelerate at a CAGR of 4.1%
Market growth 2025-2029 USD 137.9 million
Market structure Fragmented
YoY growth 2024-2025(%) 4.1%
Key countries UK, Germany, France, Spain, Italy, The Netherlands, US, Canada, Mexico, China, Japan, India, South Korea, Australia, Indonesia, South Africa, Saudi Arabia, UAE, Israel, Turkey, Brazil, Argentina and Colombia
Competitive landscape Leading Companies, Market Positioning of Companies, Competitive Strategies, and Industry Risks

Request Free Sample

Research Analyst Overview

  • The cellular glass market is defined by its multifunctionality, serving as a structural insulation core with a closed-cell structure that offers superior thermal insulation properties and moisture impermeability. Its composition of recycled glass content makes it an ecologically friendly insulation and sustainable building material with zero ozone depletion potential, which is critical for life cycle assessment and embodied energy reduction.
  • As an inorganic insulation, it is a rot-proof material and pest resistant insulation, offering unmatched dimensional stability and chemical inertness. The high compressive strength makes it a load-bearing insulation ideal for sub-slab insulation, while its non-combustible material status ensures it is a fire resistant insulation, meeting strict building code compliance.
  • Its use in pipe insulation shells and cryogenic insulation for high operating temperature environments is common. For construction, foam glass gravel acts as a lightweight aggregate and green roof drainage layer, aiding in frost heave prevention and thermal bridge prevention. This acid-resistant material also provides sound absorption, contributing to a higher sound transmission class.
  • The hermetically sealed cells in this closed-pore glass foam create an effective vapor barrier with a low moisture vapor transmission rate and low thermal conductivity, and this incombustible insulation has demonstrated a service life over 50% longer than many organic foams.

What are the Key Data Covered in this Cellular Glass Market Research and Growth Report?

  • What is the expected growth of the Cellular Glass Market between 2025 and 2029?

    • USD 137.9 million, at a CAGR of 4.1%

  • What segmentation does the market report cover?

    • The report is segmented by Type (Closed glass, and Open glass), Product Type (Block and shell, and Foam glass gravel), End-user (construction, Industrial, and Others) and Geography (Europe, North America, APAC, Middle East and Africa, South America)

  • Which regions are analyzed in the report?

    • Europe, North America, APAC, Middle East and Africa and South America

  • What are the key growth drivers and market challenges?

    • Increasing demand for energy-efficient building materials, High initial cost compared to conventional insulation materials

  • Who are the major players in the Cellular Glass Market?

    • Beerenberg AS, Energocell Kft., Excelsior Ceramics, Foamit Group, Glapor Werk Mitterteich GmbH, Huali Thermal Insulation, Huaneng Zhongtian Group Co. Ltd., IBSL Group Ltd., Insultherm, Misapor AG, Owens Corning, POLYDROS S.A., REFAGLASS s.r.o., Shanghai Metal Corp., Sun Refractories, Wedge Industries Ltd. and Zhejiang Dehe Insulation Corp. Ltd.

Market Research Insights

  • The market's momentum is supported by its alignment with sustainability goals and superior material characteristics. As a lightweight fill material, its use in civil engineering has reduced project costs by up to 10% by minimizing the need for heavy machinery.
  • The adoption of recycled glass insulation is a key factor, with some products containing over 90% recycled content, appealing to environmentally conscious specifiers. In industrial settings, high-performance building envelope systems utilizing cellular glass insulation can improve a facility's thermal performance significantly. The demand for foam glass aggregate is also growing for applications beyond basic insulation.
  • This market is defined by a clear value proposition where the initial investment is offset by long-term operational savings and durability, making it a strategic choice for critical infrastructure and sustainable construction.

We can help! Our analysts can customize this cellular glass market research report to meet your requirements.

Get in touch

1. Executive Summary

1.1 Market overview

Executive Summary - Chart on Market Overview
Executive Summary - Data Table on Market Overview
Executive Summary - Chart on Global Market Characteristics
Executive Summary - Chart on Market by Geography
Executive Summary - Chart on Market Segmentation by Type
Executive Summary - Chart on Market Segmentation by Product Type
Executive Summary - Chart on Market Segmentation by End-user
Executive Summary - Chart on Incremental Growth
Executive Summary - Data Table on Incremental Growth
Executive Summary - Chart on Company Market Positioning

2. Technavio Analysis

2.1 Analysis of price sensitivity, lifecycle, customer purchase basket, adoption rates, and purchase criteria

2.2 Criticality of inputs and Factors of differentiation

Chart on Overview on criticality of inputs and factors of differentiation

2.3 Factors of disruption

Chart on Overview on factors of disruption

2.4 Impact of drivers and challenges

Chart on Impact of drivers and challenges in 2024 and 2029

3. Market Landscape

3.1 Market ecosystem

Chart on Parent Market
Data Table on - Parent Market

3.2 Market characteristics

Chart on Market characteristics analysis

3.3 Value chain analysis

Chart on Value chain analysis

4. Market Sizing

4.1 Market definition

Data Table on Offerings of companies included in the market definition

4.2 Market segment analysis

Market segments

4.3 Market size 2024

4.4 Market outlook: Forecast for 2024-2029

Chart on Global - Market size and forecast 2024-2029 ($ million)
Data Table on Global - Market size and forecast 2024-2029 ($ million)
Chart on Global Market: Year-over-year growth 2024-2029 (%)
Data Table on Global Market: Year-over-year growth 2024-2029 (%)

5. Historic Market Size

5.1 Global Cellular Glass Market 2019 - 2023

Historic Market Size - Data Table on Global Cellular Glass Market 2019 - 2023 ($ million)

5.2 Type segment analysis 2019 - 2023

Historic Market Size - Type Segment 2019 - 2023 ($ million)

5.3 Product Type segment analysis 2019 - 2023

Historic Market Size - Product Type Segment 2019 - 2023 ($ million)

5.4 End-user segment analysis 2019 - 2023

Historic Market Size - End-user Segment 2019 - 2023 ($ million)

5.5 Geography segment analysis 2019 - 2023

Historic Market Size - Geography Segment 2019 - 2023 ($ million)

5.6 Country segment analysis 2019 - 2023

Historic Market Size - Country Segment 2019 - 2023 ($ million)

6. Qualitative Analysis

6.1 Impact of AI on global cellular glass market

7. Five Forces Analysis

7.1 Five forces summary

Five forces analysis - Comparison between 2024 and 2029

7.2 Bargaining power of buyers

Bargaining power of buyers - Impact of key factors 2024 and 2029

7.3 Bargaining power of suppliers

Bargaining power of suppliers - Impact of key factors in 2024 and 2029

7.4 Threat of new entrants

Threat of new entrants - Impact of key factors in 2024 and 2029

7.5 Threat of substitutes

Threat of substitutes - Impact of key factors in 2024 and 2029

7.6 Threat of rivalry

Threat of rivalry - Impact of key factors in 2024 and 2029

7.7 Market condition

Chart on Market condition - Five forces 2024 and 2029

8. Market Segmentation by Type

8.1 Market segments

Chart on Type - Market share 2024-2029 (%)
Data Table on Type - Market share 2024-2029 (%)

8.2 Comparison by Type

Chart on Comparison by Type
Data Table on Comparison by Type

8.3 Closed glass - Market size and forecast 2024-2029

Chart on Closed glass - Market size and forecast 2024-2029 ($ million)
Data Table on Closed glass - Market size and forecast 2024-2029 ($ million)
Chart on Closed glass - Year-over-year growth 2024-2029 (%)
Data Table on Closed glass - Year-over-year growth 2024-2029 (%)

8.4 Open glass - Market size and forecast 2024-2029

Chart on Open glass - Market size and forecast 2024-2029 ($ million)
Data Table on Open glass - Market size and forecast 2024-2029 ($ million)
Chart on Open glass - Year-over-year growth 2024-2029 (%)
Data Table on Open glass - Year-over-year growth 2024-2029 (%)

8.5 Market opportunity by Type

Market opportunity by Type ($ million)
Data Table on Market opportunity by Type ($ million)

9. Market Segmentation by Product Type

9.1 Market segments

Chart on Product Type - Market share 2024-2029 (%)
Data Table on Product Type - Market share 2024-2029 (%)

9.2 Comparison by Product Type

Chart on Comparison by Product Type
Data Table on Comparison by Product Type

9.3 Block and shell - Market size and forecast 2024-2029

Chart on Block and shell - Market size and forecast 2024-2029 ($ million)
Data Table on Block and shell - Market size and forecast 2024-2029 ($ million)
Chart on Block and shell - Year-over-year growth 2024-2029 (%)
Data Table on Block and shell - Year-over-year growth 2024-2029 (%)

9.4 Foam glass gravel - Market size and forecast 2024-2029

Chart on Foam glass gravel - Market size and forecast 2024-2029 ($ million)
Data Table on Foam glass gravel - Market size and forecast 2024-2029 ($ million)
Chart on Foam glass gravel - Year-over-year growth 2024-2029 (%)
Data Table on Foam glass gravel - Year-over-year growth 2024-2029 (%)

9.5 Market opportunity by Product Type

Market opportunity by Product Type ($ million)
Data Table on Market opportunity by Product Type ($ million)

10. Market Segmentation by End-user

10.1 Market segments

Chart on End-user - Market share 2024-2029 (%)
Data Table on End-user - Market share 2024-2029 (%)

10.2 Comparison by End-user

Chart on Comparison by End-user
Data Table on Comparison by End-user

10.3 Construction - Market size and forecast 2024-2029

Chart on Construction - Market size and forecast 2024-2029 ($ million)
Data Table on Construction - Market size and forecast 2024-2029 ($ million)
Chart on Construction - Year-over-year growth 2024-2029 (%)
Data Table on Construction - Year-over-year growth 2024-2029 (%)

10.4 Industrial - Market size and forecast 2024-2029

Chart on Industrial - Market size and forecast 2024-2029 ($ million)
Data Table on Industrial - Market size and forecast 2024-2029 ($ million)
Chart on Industrial - Year-over-year growth 2024-2029 (%)
Data Table on Industrial - Year-over-year growth 2024-2029 (%)

10.5 Others - Market size and forecast 2024-2029

Chart on Others - Market size and forecast 2024-2029 ($ million)
Data Table on Others - Market size and forecast 2024-2029 ($ million)
Chart on Others - Year-over-year growth 2024-2029 (%)
Data Table on Others - Year-over-year growth 2024-2029 (%)

10.6 Market opportunity by End-user

Market opportunity by End-user ($ million)
Data Table on Market opportunity by End-user ($ million)

11. Customer Landscape

11.1 Customer landscape overview

Analysis of price sensitivity, lifecycle, customer purchase basket, adoption rates, and purchase criteria

12. Geographic Landscape

12.1 Geographic segmentation

Chart on Market share by geography 2024-2029 (%)
Data Table on Market share by geography 2024-2029 (%)

12.2 Geographic comparison

Chart on Geographic comparison
Data Table on Geographic comparison

12.3 Europe - Market size and forecast 2024-2029

Chart on Europe - Market size and forecast 2024-2029 ($ million)
Data Table on Europe - Market size and forecast 2024-2029 ($ million)
Chart on Europe - Year-over-year growth 2024-2029 (%)
Data Table on Europe - Year-over-year growth 2024-2029 (%)
Chart on Regional Comparison - Europe
Data Table on Regional Comparison - Europe

12.3.1 UK - Market size and forecast 2024-2029

Chart on UK - Market size and forecast 2024-2029 ($ million)
Data Table on UK - Market size and forecast 2024-2029 ($ million)
Chart on UK - Year-over-year growth 2024-2029 (%)
Data Table on UK - Year-over-year growth 2024-2029 (%)

12.3.2 Germany - Market size and forecast 2024-2029

Chart on Germany - Market size and forecast 2024-2029 ($ million)
Data Table on Germany - Market size and forecast 2024-2029 ($ million)
Chart on Germany - Year-over-year growth 2024-2029 (%)
Data Table on Germany - Year-over-year growth 2024-2029 (%)

12.3.3 France - Market size and forecast 2024-2029

Chart on France - Market size and forecast 2024-2029 ($ million)
Data Table on France - Market size and forecast 2024-2029 ($ million)
Chart on France - Year-over-year growth 2024-2029 (%)
Data Table on France - Year-over-year growth 2024-2029 (%)

12.3.4 Spain - Market size and forecast 2024-2029

Chart on Spain - Market size and forecast 2024-2029 ($ million)
Data Table on Spain - Market size and forecast 2024-2029 ($ million)
Chart on Spain - Year-over-year growth 2024-2029 (%)
Data Table on Spain - Year-over-year growth 2024-2029 (%)

12.3.5 Italy - Market size and forecast 2024-2029

Chart on Italy - Market size and forecast 2024-2029 ($ million)
Data Table on Italy - Market size and forecast 2024-2029 ($ million)
Chart on Italy - Year-over-year growth 2024-2029 (%)
Data Table on Italy - Year-over-year growth 2024-2029 (%)

12.3.6 The Netherlands - Market size and forecast 2024-2029

Chart on The Netherlands - Market size and forecast 2024-2029 ($ million)
Data Table on The Netherlands - Market size and forecast 2024-2029 ($ million)
Chart on The Netherlands - Year-over-year growth 2024-2029 (%)
Data Table on The Netherlands - Year-over-year growth 2024-2029 (%)

12.4 North America - Market size and forecast 2024-2029

Chart on North America - Market size and forecast 2024-2029 ($ million)
Data Table on North America - Market size and forecast 2024-2029 ($ million)
Chart on North America - Year-over-year growth 2024-2029 (%)
Data Table on North America - Year-over-year growth 2024-2029 (%)
Chart on Regional Comparison - North America
Data Table on Regional Comparison - North America

12.4.1 US - Market size and forecast 2024-2029

Chart on US - Market size and forecast 2024-2029 ($ million)
Data Table on US - Market size and forecast 2024-2029 ($ million)
Chart on US - Year-over-year growth 2024-2029 (%)
Data Table on US - Year-over-year growth 2024-2029 (%)

12.4.2 Canada - Market size and forecast 2024-2029

Chart on Canada - Market size and forecast 2024-2029 ($ million)
Data Table on Canada - Market size and forecast 2024-2029 ($ million)
Chart on Canada - Year-over-year growth 2024-2029 (%)
Data Table on Canada - Year-over-year growth 2024-2029 (%)

12.4.3 Mexico - Market size and forecast 2024-2029

Chart on Mexico - Market size and forecast 2024-2029 ($ million)
Data Table on Mexico - Market size and forecast 2024-2029 ($ million)
Chart on Mexico - Year-over-year growth 2024-2029 (%)
Data Table on Mexico - Year-over-year growth 2024-2029 (%)

12.5 APAC - Market size and forecast 2024-2029

Chart on APAC - Market size and forecast 2024-2029 ($ million)
Data Table on APAC - Market size and forecast 2024-2029 ($ million)
Chart on APAC - Year-over-year growth 2024-2029 (%)
Data Table on APAC - Year-over-year growth 2024-2029 (%)
Chart on Regional Comparison - APAC
Data Table on Regional Comparison - APAC

12.5.1 China - Market size and forecast 2024-2029

Chart on China - Market size and forecast 2024-2029 ($ million)
Data Table on China - Market size and forecast 2024-2029 ($ million)
Chart on China - Year-over-year growth 2024-2029 (%)
Data Table on China - Year-over-year growth 2024-2029 (%)

12.5.2 Japan - Market size and forecast 2024-2029

Chart on Japan - Market size and forecast 2024-2029 ($ million)
Data Table on Japan - Market size and forecast 2024-2029 ($ million)
Chart on Japan - Year-over-year growth 2024-2029 (%)
Data Table on Japan - Year-over-year growth 2024-2029 (%)

12.5.3 India - Market size and forecast 2024-2029

Chart on India - Market size and forecast 2024-2029 ($ million)
Data Table on India - Market size and forecast 2024-2029 ($ million)
Chart on India - Year-over-year growth 2024-2029 (%)
Data Table on India - Year-over-year growth 2024-2029 (%)

12.5.4 South Korea - Market size and forecast 2024-2029

Chart on South Korea - Market size and forecast 2024-2029 ($ million)
Data Table on South Korea - Market size and forecast 2024-2029 ($ million)
Chart on South Korea - Year-over-year growth 2024-2029 (%)
Data Table on South Korea - Year-over-year growth 2024-2029 (%)

12.5.5 Australia - Market size and forecast 2024-2029

Chart on Australia - Market size and forecast 2024-2029 ($ million)
Data Table on Australia - Market size and forecast 2024-2029 ($ million)
Chart on Australia - Year-over-year growth 2024-2029 (%)
Data Table on Australia - Year-over-year growth 2024-2029 (%)

12.5.6 Indonesia - Market size and forecast 2024-2029

Chart on Indonesia - Market size and forecast 2024-2029 ($ million)
Data Table on Indonesia - Market size and forecast 2024-2029 ($ million)
Chart on Indonesia - Year-over-year growth 2024-2029 (%)
Data Table on Indonesia - Year-over-year growth 2024-2029 (%)

12.6 Middle East and Africa - Market size and forecast 2024-2029

Chart on Middle East and Africa - Market size and forecast 2024-2029 ($ million)
Data Table on Middle East and Africa - Market size and forecast 2024-2029 ($ million)
Chart on Middle East and Africa - Year-over-year growth 2024-2029 (%)
Data Table on Middle East and Africa - Year-over-year growth 2024-2029 (%)
Chart on Regional Comparison - Middle East and Africa
Data Table on Regional Comparison - Middle East and Africa

12.6.1 South Africa - Market size and forecast 2024-2029

Chart on South Africa - Market size and forecast 2024-2029 ($ million)
Data Table on South Africa - Market size and forecast 2024-2029 ($ million)
Chart on South Africa - Year-over-year growth 2024-2029 (%)
Data Table on South Africa - Year-over-year growth 2024-2029 (%)

12.6.2 Saudi Arabia - Market size and forecast 2024-2029

Chart on Saudi Arabia - Market size and forecast 2024-2029 ($ million)
Data Table on Saudi Arabia - Market size and forecast 2024-2029 ($ million)
Chart on Saudi Arabia - Year-over-year growth 2024-2029 (%)
Data Table on Saudi Arabia - Year-over-year growth 2024-2029 (%)

12.6.3 UAE - Market size and forecast 2024-2029

Chart on UAE - Market size and forecast 2024-2029 ($ million)
Data Table on UAE - Market size and forecast 2024-2029 ($ million)
Chart on UAE - Year-over-year growth 2024-2029 (%)
Data Table on UAE - Year-over-year growth 2024-2029 (%)

12.6.4 Israel - Market size and forecast 2024-2029

Chart on Israel - Market size and forecast 2024-2029 ($ million)
Data Table on Israel - Market size and forecast 2024-2029 ($ million)
Chart on Israel - Year-over-year growth 2024-2029 (%)
Data Table on Israel - Year-over-year growth 2024-2029 (%)

12.6.5 Turkey - Market size and forecast 2024-2029

Chart on Turkey - Market size and forecast 2024-2029 ($ million)
Data Table on Turkey - Market size and forecast 2024-2029 ($ million)
Chart on Turkey - Year-over-year growth 2024-2029 (%)
Data Table on Turkey - Year-over-year growth 2024-2029 (%)

12.7 South America - Market size and forecast 2024-2029

Chart on South America - Market size and forecast 2024-2029 ($ million)
Data Table on South America - Market size and forecast 2024-2029 ($ million)
Chart on South America - Year-over-year growth 2024-2029 (%)
Data Table on South America - Year-over-year growth 2024-2029 (%)
Chart on Regional Comparison - South America
Data Table on Regional Comparison - South America

12.7.1 Brazil - Market size and forecast 2024-2029

Chart on Brazil - Market size and forecast 2024-2029 ($ million)
Data Table on Brazil - Market size and forecast 2024-2029 ($ million)
Chart on Brazil - Year-over-year growth 2024-2029 (%)
Data Table on Brazil - Year-over-year growth 2024-2029 (%)

12.7.2 Argentina - Market size and forecast 2024-2029

Chart on Argentina - Market size and forecast 2024-2029 ($ million)
Data Table on Argentina - Market size and forecast 2024-2029 ($ million)
Chart on Argentina - Year-over-year growth 2024-2029 (%)
Data Table on Argentina - Year-over-year growth 2024-2029 (%)

12.7.3 Colombia - Market size and forecast 2024-2029

Chart on Colombia - Market size and forecast 2024-2029 ($ million)
Data Table on Colombia - Market size and forecast 2024-2029 ($ million)
Chart on Colombia - Year-over-year growth 2024-2029 (%)
Data Table on Colombia - Year-over-year growth 2024-2029 (%)

12.8 Market opportunity by geography

Market opportunity by geography ($ million)
Data Tables on Market opportunity by geography ($ million)

13. Drivers, Challenges, and Opportunity

13.1 Market drivers

Increasing demand for energy-efficient building materials
Growing emphasis on sustainable and green building practices
Increasing demand from industrial and cryogenic applications

13.2 Market challenges

High initial cost compared to conventional insulation materials
Fragility and installation complexity
Competition from alternative insulation materials

13.3 Impact of drivers and challenges

Impact of drivers and challenges in 2024 and 2029

13.4 Market opportunities

Growing adoption in green roof and urban landscaping projects
Increasing focus on circular economy and recycled content
Technological advancements in manufacturing and product development

14. Competitive Landscape

14.1 Overview

14.2

Overview on criticality of inputs and factors of differentiation

14.3 Landscape disruption

Overview on factors of disruption

14.4 Industry risks

Impact of key risks on business

15. Competitive Analysis

15.1 Companies profiled

Companies covered

15.2 Company ranking index

15.3 Market positioning of companies

Matrix on companies position and classification

15.4 Beerenberg AS

Beerenberg AS - Overview
Beerenberg AS - Product / Service
Beerenberg AS - Key offerings
SWOT

15.5 Energocell Kft.

Energocell Kft. - Overview
Energocell Kft. - Product / Service
Energocell Kft. - Key offerings
SWOT

15.6 Foamit Group

Foamit Group - Overview
Foamit Group - Product / Service
Foamit Group - Key offerings
SWOT

15.7 Glapor Werk Mitterteich GmbH

Glapor Werk Mitterteich GmbH - Overview
Glapor Werk Mitterteich GmbH - Product / Service
Glapor Werk Mitterteich GmbH - Key offerings
SWOT

15.8 Huali Thermal Insulation

Huali Thermal Insulation - Overview
Huali Thermal Insulation - Product / Service
Huali Thermal Insulation - Key offerings
SWOT

15.9 Huaneng Zhongtian Group Co. Ltd.

Huaneng Zhongtian Group Co. Ltd. - Overview
Huaneng Zhongtian Group Co. Ltd. - Product / Service
Huaneng Zhongtian Group Co. Ltd. - Key offerings
SWOT

15.10 IBSL Group Ltd.

IBSL Group Ltd. - Overview
IBSL Group Ltd. - Product / Service
IBSL Group Ltd. - Key offerings
SWOT

15.11 Insultherm

Insultherm - Overview
Insultherm - Product / Service
Insultherm - Key offerings
SWOT

15.12 Misapor AG

Misapor AG - Overview
Misapor AG - Product / Service
Misapor AG - Key offerings
SWOT

15.13 Owens Corning

Owens Corning - Overview
Owens Corning - Business segments
Owens Corning - Key news
Owens Corning - Key offerings
Owens Corning - Segment focus
SWOT

15.14 POLYDROS S.A.

POLYDROS S.A. - Overview
POLYDROS S.A. - Product / Service
POLYDROS S.A. - Key offerings
SWOT

15.15 REFAGLASS s.r.o.

REFAGLASS s.r.o. - Overview
REFAGLASS s.r.o. - Product / Service
REFAGLASS s.r.o. - Key offerings
SWOT

15.16 Shanghai Metal Corp.

Shanghai Metal Corp. - Overview
Shanghai Metal Corp. - Product / Service
Shanghai Metal Corp. - Key offerings
SWOT

15.17 Wedge Industries Ltd.

Wedge Industries Ltd. - Overview
Wedge Industries Ltd. - Product / Service
Wedge Industries Ltd. - Key offerings
SWOT

15.18 Zhejiang Dehe Insulation Corp. Ltd.

Zhejiang Dehe Insulation Corp. Ltd. - Overview
Zhejiang Dehe Insulation Corp. Ltd. - Product / Service
Zhejiang Dehe Insulation Corp. Ltd. - Key offerings
SWOT

16. Appendix

16.1 Scope of the report

Market definition
Objectives
Notes and caveats

16.2 Inclusions and exclusions checklist

Inclusions checklist
Exclusions checklist

16.3 Currency conversion rates for US$

16.4 Research methodology

16.5 Data procurement

Information sources

16.6 Data validation

16.7 Validation techniques employed for market sizing

16.8 Data synthesis

16.9 360 degree market analysis

16.10 List of abbreviations

Research Methodology

Technavio presents a detailed picture of the market by way of study, synthesis, and summation of data from multiple sources. The analysts have presented the various facets of the market with a particular focus on identifying the key industry influencers. The data thus presented is comprehensive, reliable, and the result of extensive research, both primary and secondary.

INFORMATION SOURCES

Primary sources

  • Manufacturers and suppliers
  • Channel partners
  • Industry experts
  • Strategic decision makers

Secondary sources

  • Industry journals and periodicals
  • Government data
  • Financial reports of key industry players
  • Historical data
  • Press releases

DATA ANALYSIS

Data Synthesis

  • Collation of data
  • Estimation of key figures
  • Analysis of derived insights

Data Validation

  • Triangulation with data models
  • Reference against proprietary databases
  • Corroboration with industry experts

REPORT WRITING

Qualitative

  • Market drivers
  • Market challenges
  • Market trends
  • Five forces analysis

Quantitative

  • Market size and forecast
  • Market segmentation
  • Geographical insights
  • Competitive landscape

Interested in this report?

Get your sample now to see our research methodology and insights!

Download Now

Frequently Asked Questions

Cellular Glass market growth will increase by USD 137.9 million during 2025-2029.

The Cellular Glass market is expected to grow at a CAGR of 4.1% during 2025-2029.

Cellular Glass market is segmented by Type (Closed glass, Open glass) Product type (Block and shell, Foam glass gravel) End-user (Construction, Industrial, Others)

Beerenberg AS, Energocell Kft., Excelsior Ceramics, Foamit Group, Glapor Werk Mitterteich GmbH, Huali Thermal Insulation, Huaneng Zhongtian Group Co. Ltd., IBSL Group Ltd., Insultherm, Misapor AG, Owens Corning, POLYDROS S.A., REFAGLASS s.r.o., Shanghai Metal Corp., Sun Refractories, Wedge Industries Ltd., Zhejiang Dehe Insulation Corp. Ltd. are a few of the key vendors in the Cellular Glass market.

North America will register the highest growth rate of 35.1% among the other regions. Therefore, the Cellular Glass market in North America is expected to garner significant business opportunities for the vendors during the forecast period.

UK, Germany, France, Spain, Italy, The Netherlands, US, Canada, Mexico, China, Japan, India, South Korea, Australia, Indonesia, South Africa, Saudi Arabia, UAE, Israel, Turkey, Brazil, Argentina, Colombia

  • Increasing demand for energy-efficient building materials is the driving factor this market.

The Cellular Glass market vendors should focus on grabbing business opportunities from the Type segment as it accounted for the largest market share in the base year.