Carrier Screening Market Analysis, Size, and Forecast 2025-2029: North America (US and Canada), Europe (France, Germany, Italy, Spain, and UK), APAC (China, India, and Japan), and Rest of World (ROW)

Carrier Screening Market Analysis, Size, and Forecast 2025-2029:
North America (US and Canada), Europe (France, Germany, Italy, Spain, and UK), APAC (China, India, and Japan), and Rest of World (ROW)

Published: Jun 2025 208 Pages SKU: IRTNTR72687

Market Overview at a Glance

$3.90 B
Market Opportunity
22.5%
CAGR
18.1
YoY growth 2024-2025(%)

Carrier Screening Market Size 2025-2029

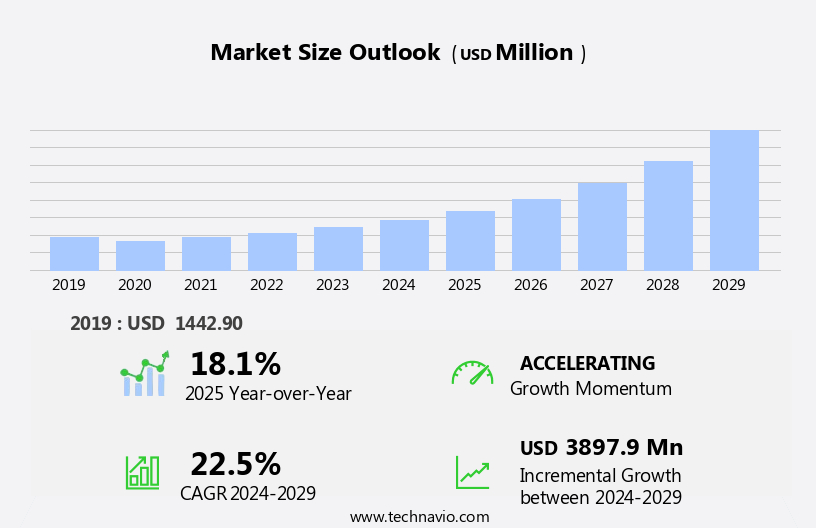
The carrier screening market size is forecast to increase by USD 3.9 billion at a CAGR of 22.5% between 2024 and 2029.

  • The market is witnessing significant growth, driven by the increasing prevalence of genetic diseases and disorders. This trend is further fueled by the rising adoption of next-generation sequencing (NGS) technology in carrier screening. NGS technology enables the simultaneous analysis of multiple genes, increasing the efficiency and accuracy of carrier screening. Dominant and recessive genes, biochemical markers, and chromosomal microarray analysis are integral to diagnostic testing. However, the market's dynamics are influenced by varying regulations on carrier screening and research globally. These regulatory differences create challenges for market players, requiring them to navigate complex legal frameworks and adapt to diverse regulatory requirements.
  • Additionally, investing in research and development to improve the accuracy and affordability of carrier screening solutions could provide a competitive edge. Data security is a significant concern, with strict protocols in place to protect patient information. Overall, the market presents significant growth potential, with the integration of advanced technologies and a growing focus on early disease detection offering new opportunities for innovation. Companies seeking to capitalize on market opportunities must stay informed of these regulatory developments and develop strategies to address the associated complexities.

What will be the Size of the Carrier Screening Market during the forecast period?

Carrier Screening Market Size

 Explore in-depth regional segment analysis with market size data - historical 2019-2023 and forecasts 2025-2029 - in the full report.  
Request Free Sample

Genetic disease prevention through carrier screening is gaining momentum, fueled by the adoption of next-generation sequencing (NGS) and targeted sequencing. Variant interpretation and risk modeling are essential components of this process, which are increasingly relying on artificial intelligence (AI) and machine learning (ML) to improve accuracy and efficiency. Access to care and preconception counseling are key challenges in the market. Healthcare IT and mHealth are addressing these issues by streamlining data management and improving access to clinical decision support.

Quality control and quality assurance are paramount in this context, ensuring the reliability of test results and maintaining public health standards. Clinical trials and professional development are crucial for advancing the field of carrier screening. Reimbursement policies and healthcare equity are also significant factors influencing market trends. Predictive analytics and precision medicine are transforming the landscape by enabling personalized approaches to care, while public health initiatives aim to ensure equal access to these services. In summary, the market is undergoing rapid transformation, driven by advances in technology, a growing focus on personalized medicine, and efforts to improve access to care. These trends are shaping the future of reproductive health and genetic disease prevention.

How is this Carrier Screening Industry segmented?

The carrier screening industry research report provides comprehensive data (region-wise segment analysis), with forecasts and estimates in "USD million" for the period 2025-2029, as well as historical data from 2019-2023 for the following segments.

  • Type
    • Expanded
    • Targeted disease
  • Technology
    • DNA sequencing
    • Polymerase chain reaction (PCR)
    • Microarrays
    • Others
  • Test
    • Molecular screening tests
    • Biochemical screening tests
  • Geography
    • North America
      • US
      • Canada
    • Europe
      • France
      • Germany
      • Italy
      • Spain
      • UK
    • APAC
      • China
      • India
      • Japan
    • Rest of World (ROW)

By Type Insights

The expanded segment is estimated to witness significant growth during the forecast period. Prenatal carrier screening has evolved to encompass a comprehensive array of tests for single-gene disorders, extending beyond traditional guidelines. This expansion enables simultaneous screening for multiple genetic conditions. The American College of Obstetricians and Gynecologists (ACOG) advises practitioners to include disorders that affect at least 1 in 100 people, significantly impact quality of life, impair cognitive or physical abilities, necessitate surgical or medical intervention during childhood, and have early onset. Carrier screening tests, including second-trimester and confirmatory testing, employ risk stratification and data analysis to identify carriers. Fetal anomaly screening, fetal growth restriction, and neural tube defects are also crucial components of prenatal screening.

Genetic counselors play a vital role in patient education, informed consent, and clinical interpretation. Conditions such as klinefelter syndrome, chromosomal abnormalities, Tay-Sachs disease, Down syndrome, and cystic fibrosis are among those screened for. Integrated screening, which combines maternal serum screening and ultrasound, is increasingly popular. First-trimester screening for Down syndrome, neural tube defects, and gestational diabetes is also available. Ethical considerations, including informed consent and genetic counseling, are paramount. The market, a critical segment of reproductive health, is experiencing significant advancements driven by the integration of reproductive technologies and precision medicine.

Conditions like Turner syndrome, sickle cell anemia, phenylketonuria (PKU), and Fragile X syndrome are also screened for. False positive and false negative rates are essential considerations in carrier screening. Healthcare providers play a crucial role in implementing these tests and providing appropriate follow-up care.

Carrier Screening Market Size

 Download Free Sample Report

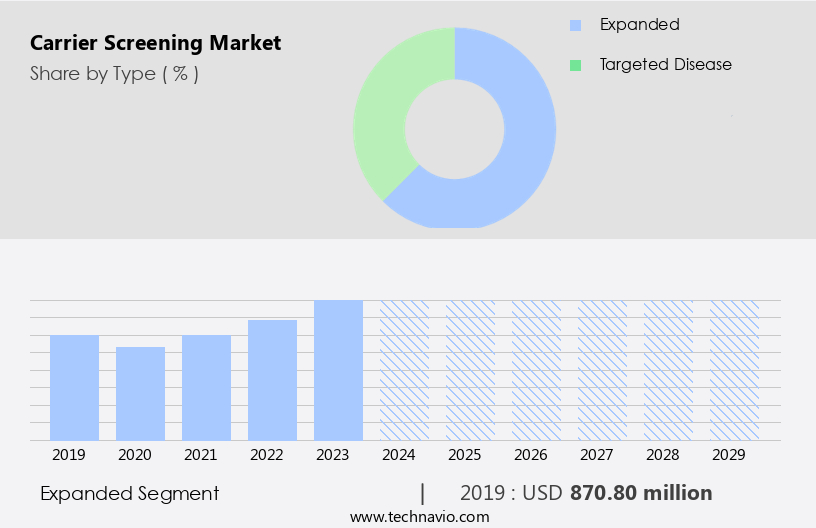
The Expanded segment was valued at USD 870.80 billion in 2019 and showed a gradual increase during the forecast period.

Regional Analysis

North America is estimated to contribute 38% to the growth of the global market during the forecast period. Technavio's analysts have elaborately explained the regional trends and drivers that shape the market during the forecast period.

Carrier Screening Market Share by Geography

View Free PDF Sample

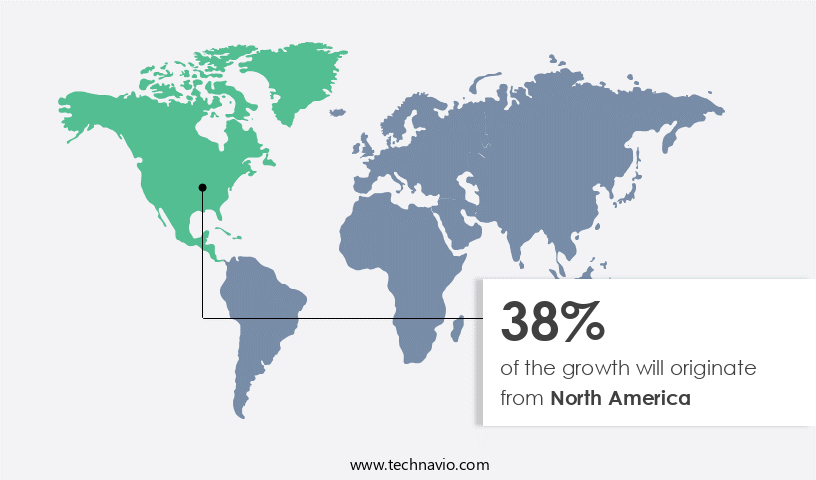
The market in North America is experiencing significant growth, with the US leading the region due to increasing concerns for early disease diagnosis and a rise in commercial approvals for advanced carrier screening. The use of pharmacogenomic testing is also contributing to market expansion. Rising cases of birth defects, such as fetal growth restriction, neural tube defects, and congenital heart defects, have fueled the demand for prenatal testing and newborn screening. In this context, the Centers for Disease Control and Prevention (CDC) reports that approximately 5% of births in the US are affected by birth defects, and 3% of infants are born with genetic disorders.

Carrier screening tests, including those for chromosomal abnormalities like Klinefelter syndrome and Turner syndrome, single gene disorders like cystic fibrosis and sickle cell anemia, and recessive genes like Tay-Sachs disease and Fragile X syndrome, are essential in identifying potential risks and enabling early interventions. Patient education and informed consent are crucial components of the screening process, with genetic counselors playing a vital role in explaining test results and providing guidance. Data security and data analysis are also essential considerations in the market, as sensitive patient information must be protected. Integrated screening, which combines first-trimester and second-trimester screening, as well as sequential screening, fetal anomaly screening, and diagnostic testing, offers improved accuracy and reduces false positives and false negatives.

Ethical considerations are an ongoing concern in the market, with healthcare providers emphasizing the importance of clinical interpretation, positive and negative predictive values, and the implications of testing for families and future generations.

Market Dynamics

Our researchers analyzed the data with 2024 as the base year, along with the key drivers, trends, and challenges. A holistic analysis of drivers will help companies refine their marketing strategies to gain a competitive advantage.

What are the Carrier Screening market drivers leading to the rise in the adoption of Industry?

  • The escalating incidence of genetic diseases and disorders serves as the primary catalyst for market growth. Carrier screening is experiencing growing demand in laboratories and hospitals due to the rising incidence of genetic disorders such as cystic fibrosis, Tay-Sachs disease, and sickle cell anemia. Prenatal carrier screening procedures are a significant contributor to this trend, as they enable early detection and treatment of manageable genetic conditions. According to the Centers for Disease Control and Prevention (CDC), approximately 1 in every 33 babies born in the US has a birth defect. The World Health Organization (WHO) estimates that around 8 million babies are born with a birth defect globally each year. Data analysis plays a crucial role in carrier screening, ensuring accurate results and reducing false positives and false negatives.
  • Negative predictive value and false positive rate are essential metrics for diagnostic testing. Patient education is another essential aspect, as healthcare providers must communicate the benefits and limitations of carrier screening effectively. Data security is a critical concern in carrier screening, as sensitive patient information must be protected. Turner syndrome and Down syndrome are common genetic disorders that can be detected through carrier screening. Ensuring data security through robust cybersecurity measures and compliance with regulations such as HIPAA is essential. The increasing prevalence of genetic disorders, the benefits of prenatal testing, and the importance of data analysis, patient education, and data security are driving the demand for carrier screening in the healthcare industry.

What are the Carrier Screening market trends shaping the Industry?

  • Next-generation sequencing (NGS) technology is experiencing a significant rise in carrier screening applications, marking a notable trend in the industry. This innovative approach to genetic testing is gaining increasing attention and adoption due to its improved accuracy and efficiency compared to traditional methods. The Human Genome Project and the emergence of next-generation sequencing (NGS) technologies have significantly advanced carrier screening in the medical field. NGS allows for large-scale sequencing of the human genome to identify mutations and gene variants linked to various diseases and disorders. This technological advancement has led to a reduction in the cost of sequencing and genomic analysis, making carrier screening more accessible. Fetal anomaly screening, including the detection of recessive genes associated with conditions such as cystic fibrosis and fragile X syndrome, is a primary application of carrier screening. First-trimester screening and chromosomal microarray analysis are other essential techniques used to identify potential genetic risks.
  • Informed consent and genetic counselors play a crucial role in the carrier screening process, ensuring individuals fully understand the implications of the test results. NGS has transformed the market by providing a comprehensive understanding of genetic functionalities and structures. It enables the detection of intermediate to large-sized mutations and gene variants, contributing to the early identification and prevention of genetic disorders. With the emphasis on personalized medicine and the growing awareness of genetic conditions, the demand for carrier screening is expected to continue growing. Positive predictive value, a critical metric in carrier screening, is significantly influenced by the accuracy and comprehensiveness of the testing methods.

How does Carrier Screening market face challenges during its growth?

  • The varying regulations on carrier screening and research, which are subject to significant global differences, pose a significant challenge to the industry's growth trajectory. The market is subject to varying regulatory standards and compliances worldwide, posing significant challenges for market participants. Carrier screening results significantly influence the diagnostic process for critical health conditions, making accuracy, safety, and reliability essential. Consequently, stringent and complex regulations have been imposed by regulatory authorities such as the US Food and Drug Administration (FDA), European Medicines Agency (EMA), European Agency for the Evaluation of Medicinal Products (EAEMP), Australia Therapeutic Goods Administration (ATGA), World Health Organization (WHO), International Organization for Standardization (ISO), and China Food and Drug Administration (CFDA).
  • These regulations cover aspects like genetic testing, clinical interpretation, and genetic counseling for conditions like phenylketonuria (PKU) and sickle cell anemia. Biochemical markers play a crucial role in carrier screening, and their interpretation necessitates expertise to ensure correct diagnosis. Ethical considerations are also essential, as carrier screening can reveal information about dominant genes and potential health risks for future generations. DNA sequencing, a crucial component of NGS, plays a vital role in improving the positive predictive value by providing a more precise analysis of the genetic material. The integration of these advanced technologies in carrier screening is expected to lead to more accurate diagnoses and better health outcomes.

Exclusive Customer Landscape

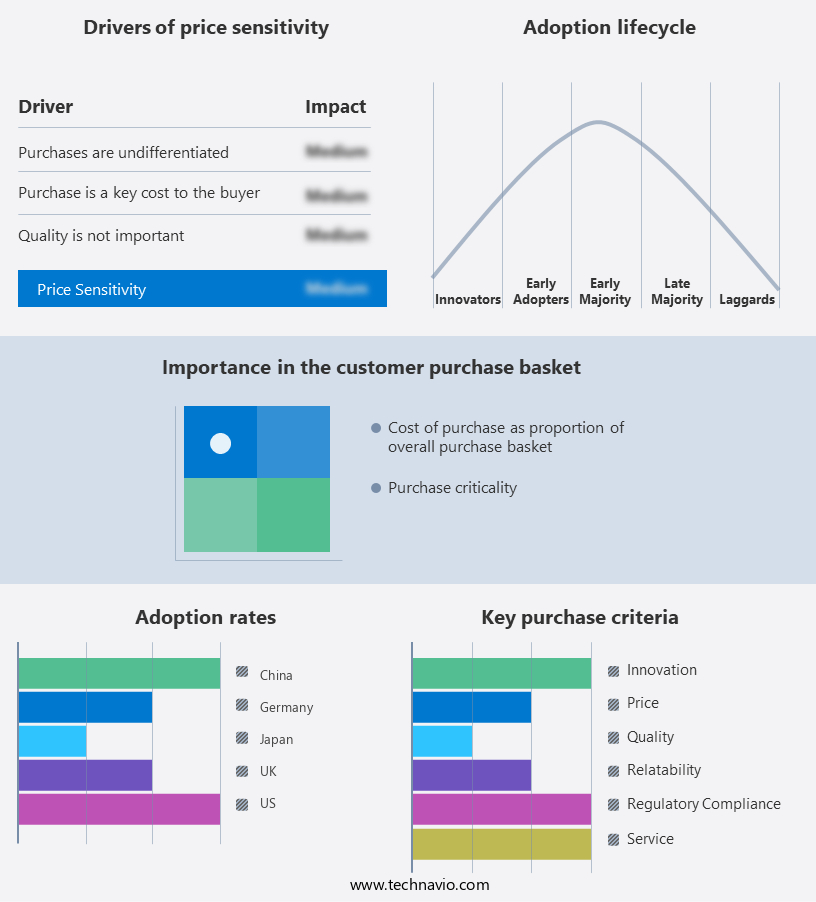
The carrier screening market forecasting report includes the adoption lifecycle of the market, covering from the innovator's stage to the laggard's stage. It focuses on adoption rates in different regions based on penetration. Furthermore, the carrier screening market report also includes key purchase criteria and drivers of price sensitivity to help companies evaluate and develop their market growth analysis strategies.

Carrier Screening Market Share by Geography

 Customer Landscape

Key Companies & Market Insights

Companies are implementing various strategies, such as strategic alliances, carrier screening market forecast, partnerships, mergers and acquisitions, geographical expansion, and product/service launches, to enhance their presence in the industry.

Abbott Laboratories - The company specializes in advanced genetic testing, specifically carrier screening for aneuploidies in amniotic fluid samples.

The industry research and growth report includes detailed analyses of the competitive landscape of the market and information about key companies, including:

  • Abbott Laboratories
  • Agilent Technologies Inc.
  • CENTOGENE NV
  • Danaher Corp.
  • DiaSorin SpA
  • Eurofins Scientific SE
  • F. Hoffmann La Roche Ltd.
  • Fulgent Genetics Inc.
  • Gene By Gene Ltd
  • Illumina Inc.
  • Invitae Corp.
  • Laboratory Corp. of America Holdings
  • MedGenome Labs Ltd.
  • Myriad Genetics Inc.
  • Natera Inc.
  • OPKO Health Inc.
  • Otogenetics Corporation
  • Quest Diagnostics Inc.
  • Sema4 OpCo Inc.
  • Thermo Fisher Scientific Inc.

Qualitative and quantitative analysis of companies has been conducted to help clients understand the wider business environment as well as the strengths and weaknesses of key industry players. Data is qualitatively analyzed to categorize companies as pure play, category-focused, industry-focused, and diversified; it is quantitatively analyzed to categorize companies as dominant, leading, strong, tentative, and weak.

Recent Development and News in Carrier Screening Market

  • In January 2024, Illumina, a leading genetics technology company, announced the launch of its new carrier screening solution, "Grail CarrierScreen NGS," which uses next-generation sequencing technology to detect genetic conditions with higher accuracy and efficiency (Illumina Press Release).
  • In March 2024, Thermo Fisher Scientific and Invitrogen, two prominent players in the market, entered into a strategic partnership to integrate Invitrogen's carrier screening panels with Thermo Fisher's Ion Torrent Genomic Solutions. This collaboration aimed to enhance the efficiency and accessibility of carrier screening services (Thermo Fisher Scientific Press Release).
  • In May 2025, Myriad Genetics, a major player in genetic testing, completed the acquisition of Counsyl, a leading carrier screening company, for approximately USD800 million. This acquisition expanded Myriad's carrier screening offerings and strengthened its position in the market (Myriad Genetics Press Release).
  • In May 2025, the European Union's In Vitro Diagnostic Medical Devices Regulation (IVDR) came into effect, mandating stricter regulations for carrier screening tests. This regulatory change is expected to increase the demand for high-quality, reliable carrier screening solutions from approved manufacturers (European Commission Press Release).

Research Analyst Overview

Carrier screening tests, a subset of laboratory testing, continue to evolve in response to advancements in genetics and healthcare. These tests identify individuals who carry genes associated with various genetic disorders, including fetal anomalies, chromosomal abnormalities, and single gene disorders. Fetal anomaly screening, often performed during the second trimester, aims to detect structural defects, while recessive genes, such as cystic fibrosis and fragile X syndrome, require sequential screening. Risk stratification plays a crucial role in carrier screening, guiding healthcare providers in offering testing based on an individual's ethnicity and family history. Conditions like Klinefelter syndrome and Turner syndrome are among the chromosomal abnormalities screened for.

Informed consent and genetic counselors are integral components of the screening process, ensuring patients receive accurate information and support. First-trimester screening offers early detection for certain conditions, such as neural tube defects and gestational diabetes. Diagnostic testing, including chromosomal microarray analysis and DNA sequencing, provides confirmatory results when initial screening indicates a potential issue. False positive and false negative rates are essential considerations in the context of data analysis and clinical interpretation. Healthcare providers employ integrated screening strategies, combining biochemical markers and genetic testing, to enhance the accuracy and efficiency of carrier screening. Ethical considerations, including data security, are essential as the volume of genetic data grows.

Dominant genes, like sickle cell anemia and phenylketonuria (PKU), are also screened for, emphasizing the continuous dynamism of this evolving market.

Dive into Technavio's robust research methodology, blending expert interviews, extensive data synthesis, and validated models for unparalleled Carrier Screening Market insights. See full methodology.

Market Scope

Report Coverage

Details

Page number

208

Base year

2024

Historic period

2019-2023

Forecast period

2025-2029

Growth momentum & CAGR

Accelerate at a CAGR of 22.5%

Market growth 2025-2029

USD 3.9 billion

Market structure

Fragmented

YoY growth 2024-2025(%)

18.1

Key countries

US, Germany, UK, Canada, Japan, France, China, Italy, Spain, and India

Competitive landscape

Leading Companies, Market Positioning of Companies, Competitive Strategies, and Industry Risks

Request Free Sample

What are the Key Data Covered in this Carrier Screening Market Research and Growth Report?

  • CAGR of the Carrier Screening industry during the forecast period
  • Detailed information on factors that will drive the growth and forecasting between 2025 and 2029
  • Precise estimation of the size of the market and its contribution of the industry in focus to the parent market
  • Accurate predictions about upcoming growth and trends and changes in consumer behaviour
  • Growth of the market across North America, Europe, Asia, and Rest of World (ROW)
  • Thorough analysis of the market's competitive landscape and detailed information about companies
  • Comprehensive analysis of factors that will challenge the carrier screening market growth of industry companies

We can help! Our analysts can customize this carrier screening market research report to meet your requirements.

Get in touch

1 Executive Summary

  • 1.1 Market overview
    • Executive Summary - Chart on Market Overview
    • Executive Summary - Data Table on Market Overview
    • Executive Summary - Chart on Global Market Characteristics
    • Executive Summary - Chart on Market by Geography
    • Executive Summary - Chart on Market Segmentation by Type
    • Executive Summary - Chart on Market Segmentation by Technology
    • Executive Summary - Chart on Market Segmentation by Test
    • Executive Summary - Chart on Incremental Growth
    • Executive Summary - Data Table on Incremental Growth
    • Executive Summary - Chart on Company Market Positioning

2 Technavio Analysis

  • 2.1 Analysis of price sensitivity, lifecycle, customer purchase basket, adoption rates, and purchase criteria
    • Analysis of price sensitivity, lifecycle, customer purchase basket, adoption rates, and purchase criteria
  • 2.2 Criticality of inputs and Factors of differentiation
    • Overview on criticality of inputs and factors of differentiation
  • 2.3 Factors of disruption
    • Overview on factors of disruption
  • 2.4 Impact of drivers and challenges
    • Impact of drivers and challenges in 2024 and 2029

3 Market Landscape

  • 3.1 Market ecosystem
    • Parent Market
    • Data Table on - Parent Market
  • 3.2 Market characteristics
    • Market characteristics analysis
  • 3.3 Value chain analysis
    • Value chain analysis

4 Market Sizing

  • 4.1 Market definition
    • Offerings of companies included in the market definition
  • 4.2 Market segment analysis
    • Market segments
  • 4.3 Market size 2024
    • 4.4 Market outlook: Forecast for 2024-2029
      • Chart on Global - Market size and forecast 2024-2029 ($ million)
      • Data Table on Global - Market size and forecast 2024-2029 ($ million)
      • Chart on Global Market: Year-over-year growth 2024-2029 (%)
      • Data Table on Global Market: Year-over-year growth 2024-2029 (%)

    5 Historic Market Size

    • 5.1 Global Carrier Screening Market 2019 - 2023
      • Historic Market Size - Data Table on Global Carrier Screening Market 2019 - 2023 ($ million)
    • 5.2 Type segment analysis 2019 - 2023
      • Historic Market Size - Type Segment 2019 - 2023 ($ million)
    • 5.3 Technology segment analysis 2019 - 2023
      • Historic Market Size - Technology Segment 2019 - 2023 ($ million)
    • 5.4 Test segment analysis 2019 - 2023
      • Historic Market Size - Test Segment 2019 - 2023 ($ million)
    • 5.5 Geography segment analysis 2019 - 2023
      • Historic Market Size - Geography Segment 2019 - 2023 ($ million)
    • 5.6 Country segment analysis 2019 - 2023
      • Historic Market Size - Country Segment 2019 - 2023 ($ million)

    6 Qualitative Analysis

    • 6.1 The impact of AI in the global carrier screening market

      7 Five Forces Analysis

      • 7.1 Five forces summary
        • Five forces analysis - Comparison between 2024 and 2029
      • 7.2 Bargaining power of buyers
        • Bargaining power of buyers - Impact of key factors 2024 and 2029
      • 7.3 Bargaining power of suppliers
        • Bargaining power of suppliers - Impact of key factors in 2024 and 2029
      • 7.4 Threat of new entrants
        • Threat of new entrants - Impact of key factors in 2024 and 2029
      • 7.5 Threat of substitutes
        • Threat of substitutes - Impact of key factors in 2024 and 2029
      • 7.6 Threat of rivalry
        • Threat of rivalry - Impact of key factors in 2024 and 2029
      • 7.7 Market condition
        • Chart on Market condition - Five forces 2024 and 2029

      8 Market Segmentation by Type

      • 8.1 Market segments
        • Chart on Type - Market share 2024-2029 (%)
        • Data Table on Type - Market share 2024-2029 (%)
      • 8.2 Comparison by Type
        • Chart on Comparison by Type
        • Data Table on Comparison by Type
      • 8.3 Expanded - Market size and forecast 2024-2029
        • Chart on Expanded - Market size and forecast 2024-2029 ($ million)
        • Data Table on Expanded - Market size and forecast 2024-2029 ($ million)
        • Chart on Expanded - Year-over-year growth 2024-2029 (%)
        • Data Table on Expanded - Year-over-year growth 2024-2029 (%)
      • 8.4 Targeted disease - Market size and forecast 2024-2029
        • Chart on Targeted disease - Market size and forecast 2024-2029 ($ million)
        • Data Table on Targeted disease - Market size and forecast 2024-2029 ($ million)
        • Chart on Targeted disease - Year-over-year growth 2024-2029 (%)
        • Data Table on Targeted disease - Year-over-year growth 2024-2029 (%)
      • 8.5 Market opportunity by Type
        • Market opportunity by Type ($ million)
        • Data Table on Market opportunity by Type ($ million)

      9 Market Segmentation by Technology

      • 9.1 Market segments
        • Chart on Technology - Market share 2024-2029 (%)
        • Data Table on Technology - Market share 2024-2029 (%)
      • 9.2 Comparison by Technology
        • Chart on Comparison by Technology
        • Data Table on Comparison by Technology
      • 9.3 DNA sequencing - Market size and forecast 2024-2029
        • Chart on DNA sequencing - Market size and forecast 2024-2029 ($ million)
        • Data Table on DNA sequencing - Market size and forecast 2024-2029 ($ million)
        • Chart on DNA sequencing - Year-over-year growth 2024-2029 (%)
        • Data Table on DNA sequencing - Year-over-year growth 2024-2029 (%)
      • 9.4 Polymerase chain reaction (PCR) - Market size and forecast 2024-2029
        • Chart on Polymerase chain reaction (PCR) - Market size and forecast 2024-2029 ($ million)
        • Data Table on Polymerase chain reaction (PCR) - Market size and forecast 2024-2029 ($ million)
        • Chart on Polymerase chain reaction (PCR) - Year-over-year growth 2024-2029 (%)
        • Data Table on Polymerase chain reaction (PCR) - Year-over-year growth 2024-2029 (%)
      • 9.5 Microarrays - Market size and forecast 2024-2029
        • Chart on Microarrays - Market size and forecast 2024-2029 ($ million)
        • Data Table on Microarrays - Market size and forecast 2024-2029 ($ million)
        • Chart on Microarrays - Year-over-year growth 2024-2029 (%)
        • Data Table on Microarrays - Year-over-year growth 2024-2029 (%)
      • 9.6 Others - Market size and forecast 2024-2029
        • Chart on Others - Market size and forecast 2024-2029 ($ million)
        • Data Table on Others - Market size and forecast 2024-2029 ($ million)
        • Chart on Others - Year-over-year growth 2024-2029 (%)
        • Data Table on Others - Year-over-year growth 2024-2029 (%)
      • 9.7 Market opportunity by Technology
        • Market opportunity by Technology ($ million)
        • Data Table on Market opportunity by Technology ($ million)

      10 Market Segmentation by Test

      • 10.1 Market segments
        • Chart on Test - Market share 2024-2029 (%)
        • Data Table on Test - Market share 2024-2029 (%)
      • 10.2 Comparison by Test
        • Chart on Comparison by Test
        • Data Table on Comparison by Test
      • 10.3 Molecular screening tests - Market size and forecast 2024-2029
        • Chart on Molecular screening tests - Market size and forecast 2024-2029 ($ million)
        • Data Table on Molecular screening tests - Market size and forecast 2024-2029 ($ million)
        • Chart on Molecular screening tests - Year-over-year growth 2024-2029 (%)
        • Data Table on Molecular screening tests - Year-over-year growth 2024-2029 (%)
      • 10.4 Biochemical screening tests - Market size and forecast 2024-2029
        • Chart on Biochemical screening tests - Market size and forecast 2024-2029 ($ million)
        • Data Table on Biochemical screening tests - Market size and forecast 2024-2029 ($ million)
        • Chart on Biochemical screening tests - Year-over-year growth 2024-2029 (%)
        • Data Table on Biochemical screening tests - Year-over-year growth 2024-2029 (%)
      • 10.5 Market opportunity by Test
        • Market opportunity by Test ($ million)
        • Data Table on Market opportunity by Test ($ million)

      11 Customer Landscape

      • 11.1 Customer landscape overview
        • Analysis of price sensitivity, lifecycle, customer purchase basket, adoption rates, and purchase criteria

      12 Geographic Landscape

      • 12.1 Geographic segmentation
        • Chart on Market share by geography 2024-2029 (%)
        • Data Table on Market share by geography 2024-2029 (%)
      • 12.2 Geographic comparison
        • Chart on Geographic comparison
        • Data Table on Geographic comparison
      • 12.3 North America - Market size and forecast 2024-2029
        • Chart on North America - Market size and forecast 2024-2029 ($ million)
        • Data Table on North America - Market size and forecast 2024-2029 ($ million)
        • Chart on North America - Year-over-year growth 2024-2029 (%)
        • Data Table on North America - Year-over-year growth 2024-2029 (%)
      • 12.4 Europe - Market size and forecast 2024-2029
        • Chart on Europe - Market size and forecast 2024-2029 ($ million)
        • Data Table on Europe - Market size and forecast 2024-2029 ($ million)
        • Chart on Europe - Year-over-year growth 2024-2029 (%)
        • Data Table on Europe - Year-over-year growth 2024-2029 (%)
      • 12.5 Asia - Market size and forecast 2024-2029
        • Chart on Asia - Market size and forecast 2024-2029 ($ million)
        • Data Table on Asia - Market size and forecast 2024-2029 ($ million)
        • Chart on Asia - Year-over-year growth 2024-2029 (%)
        • Data Table on Asia - Year-over-year growth 2024-2029 (%)
      • 12.6 Rest of World (ROW) - Market size and forecast 2024-2029
        • Chart on Rest of World (ROW) - Market size and forecast 2024-2029 ($ million)
        • Data Table on Rest of World (ROW) - Market size and forecast 2024-2029 ($ million)
        • Chart on Rest of World (ROW) - Year-over-year growth 2024-2029 (%)
        • Data Table on Rest of World (ROW) - Year-over-year growth 2024-2029 (%)
      • 12.7 US - Market size and forecast 2024-2029
        • Chart on US - Market size and forecast 2024-2029 ($ million)
        • Data Table on US - Market size and forecast 2024-2029 ($ million)
        • Chart on US - Year-over-year growth 2024-2029 (%)
        • Data Table on US - Year-over-year growth 2024-2029 (%)
      • 12.8 Japan - Market size and forecast 2024-2029
        • Chart on Japan - Market size and forecast 2024-2029 ($ million)
        • Data Table on Japan - Market size and forecast 2024-2029 ($ million)
        • Chart on Japan - Year-over-year growth 2024-2029 (%)
        • Data Table on Japan - Year-over-year growth 2024-2029 (%)
      • 12.9 Germany - Market size and forecast 2024-2029
        • Chart on Germany - Market size and forecast 2024-2029 ($ million)
        • Data Table on Germany - Market size and forecast 2024-2029 ($ million)
        • Chart on Germany - Year-over-year growth 2024-2029 (%)
        • Data Table on Germany - Year-over-year growth 2024-2029 (%)
      • 12.10 Canada - Market size and forecast 2024-2029
        • Chart on Canada - Market size and forecast 2024-2029 ($ million)
        • Data Table on Canada - Market size and forecast 2024-2029 ($ million)
        • Chart on Canada - Year-over-year growth 2024-2029 (%)
        • Data Table on Canada - Year-over-year growth 2024-2029 (%)
      • 12.11 UK - Market size and forecast 2024-2029
        • Chart on UK - Market size and forecast 2024-2029 ($ million)
        • Data Table on UK - Market size and forecast 2024-2029 ($ million)
        • Chart on UK - Year-over-year growth 2024-2029 (%)
        • Data Table on UK - Year-over-year growth 2024-2029 (%)
      • 12.12 China - Market size and forecast 2024-2029
        • Chart on China - Market size and forecast 2024-2029 ($ million)
        • Data Table on China - Market size and forecast 2024-2029 ($ million)
        • Chart on China - Year-over-year growth 2024-2029 (%)
        • Data Table on China - Year-over-year growth 2024-2029 (%)
      • 12.13 France - Market size and forecast 2024-2029
        • Chart on France - Market size and forecast 2024-2029 ($ million)
        • Data Table on France - Market size and forecast 2024-2029 ($ million)
        • Chart on France - Year-over-year growth 2024-2029 (%)
        • Data Table on France - Year-over-year growth 2024-2029 (%)
      • 12.14 India - Market size and forecast 2024-2029
        • Chart on India - Market size and forecast 2024-2029 ($ million)
        • Data Table on India - Market size and forecast 2024-2029 ($ million)
        • Chart on India - Year-over-year growth 2024-2029 (%)
        • Data Table on India - Year-over-year growth 2024-2029 (%)
      • 12.15 Italy - Market size and forecast 2024-2029
        • Chart on Italy - Market size and forecast 2024-2029 ($ million)
        • Data Table on Italy - Market size and forecast 2024-2029 ($ million)
        • Chart on Italy - Year-over-year growth 2024-2029 (%)
        • Data Table on Italy - Year-over-year growth 2024-2029 (%)
      • 12.16 Spain - Market size and forecast 2024-2029
        • Chart on Spain - Market size and forecast 2024-2029 ($ million)
        • Data Table on Spain - Market size and forecast 2024-2029 ($ million)
        • Chart on Spain - Year-over-year growth 2024-2029 (%)
        • Data Table on Spain - Year-over-year growth 2024-2029 (%)
      • 12.17 Market opportunity by geography
        • Market opportunity by geography ($ million)
        • Data Tables on Market opportunity by geography ($ million)

      13 Drivers, Challenges, and Opportunity/Restraints

      • 13.1 Market drivers
        • 13.2 Market challenges
          • 13.3 Impact of drivers and challenges
            • Impact of drivers and challenges in 2024 and 2029
          • 13.4 Market opportunities/restraints

            14 Competitive Landscape

            • 14.1 Overview
              • 14.2 Competitive Landscape
                • Overview on criticality of inputs and factors of differentiation
              • 14.3 Landscape disruption
                • Overview on factors of disruption
              • 14.4 Industry risks
                • Impact of key risks on business

              15 Competitive Analysis

              • 15.1 Companies profiled
                • Companies covered
              • 15.2 Company ranking index
                • Company ranking index
              • 15.3 Market positioning of companies
                • Matrix on companies position and classification
              • 15.4 Abbott Laboratories
                • Abbott Laboratories - Overview
                • Abbott Laboratories - Business segments
                • Abbott Laboratories - Key news
                • Abbott Laboratories - Key offerings
                • Abbott Laboratories - Segment focus
                • SWOT
              • 15.5 Agilent Technologies Inc.
                • Agilent Technologies Inc. - Overview
                • Agilent Technologies Inc. - Business segments
                • Agilent Technologies Inc. - Key news
                • Agilent Technologies Inc. - Key offerings
                • Agilent Technologies Inc. - Segment focus
                • SWOT
              • 15.6 Danaher Corp.
                • Danaher Corp. - Overview
                • Danaher Corp. - Business segments
                • Danaher Corp. - Key news
                • Danaher Corp. - Key offerings
                • Danaher Corp. - Segment focus
                • SWOT
              • 15.7 DiaSorin SpA
                • DiaSorin SpA - Overview
                • DiaSorin SpA - Business segments
                • DiaSorin SpA - Key news
                • DiaSorin SpA - Key offerings
                • DiaSorin SpA - Segment focus
                • SWOT
              • 15.8 Eurofins Scientific SE
                • Eurofins Scientific SE - Overview
                • Eurofins Scientific SE - Business segments
                • Eurofins Scientific SE - Key offerings
                • Eurofins Scientific SE - Segment focus
                • SWOT
              • 15.9 F. Hoffmann La Roche Ltd.
                • F. Hoffmann La Roche Ltd. - Overview
                • F. Hoffmann La Roche Ltd. - Business segments
                • F. Hoffmann La Roche Ltd. - Key news
                • F. Hoffmann La Roche Ltd. - Key offerings
                • F. Hoffmann La Roche Ltd. - Segment focus
                • SWOT
              • 15.10 Fulgent Genetics Inc.
                • Fulgent Genetics Inc. - Overview
                • Fulgent Genetics Inc. - Product / Service
                • Fulgent Genetics Inc. - Key offerings
                • SWOT
              • 15.11 Illumina Inc.
                • Illumina Inc. - Overview
                • Illumina Inc. - Business segments
                • Illumina Inc. - Key news
                • Illumina Inc. - Key offerings
                • Illumina Inc. - Segment focus
                • SWOT
              • 15.12 Invitae Corp.
                • Invitae Corp. - Overview
                • Invitae Corp. - Product / Service
                • Invitae Corp. - Key offerings
                • SWOT
              • 15.13 Laboratory Corp. of America Holdings
                • Laboratory Corp. of America Holdings - Overview
                • Laboratory Corp. of America Holdings - Business segments
                • Laboratory Corp. of America Holdings - Key news
                • Laboratory Corp. of America Holdings - Key offerings
                • Laboratory Corp. of America Holdings - Segment focus
                • SWOT
              • 15.14 Myriad Genetics Inc.
                • Myriad Genetics Inc. - Overview
                • Myriad Genetics Inc. - Product / Service
                • Myriad Genetics Inc. - Key news
                • Myriad Genetics Inc. - Key offerings
                • SWOT
              • 15.15 OPKO Health Inc.
                • OPKO Health Inc. - Overview
                • OPKO Health Inc. - Business segments
                • OPKO Health Inc. - Key offerings
                • OPKO Health Inc. - Segment focus
                • SWOT
              • 15.16 Otogenetics Corporation
                • Otogenetics Corporation - Overview
                • Otogenetics Corporation - Product / Service
                • Otogenetics Corporation - Key offerings
                • SWOT
              • 15.17 Quest Diagnostics Inc.
                • Quest Diagnostics Inc. - Overview
                • Quest Diagnostics Inc. - Business segments
                • Quest Diagnostics Inc. - Key offerings
                • Quest Diagnostics Inc. - Segment focus
                • SWOT
              • 15.18 Thermo Fisher Scientific Inc.
                • Thermo Fisher Scientific Inc. - Overview
                • Thermo Fisher Scientific Inc. - Business segments
                • Thermo Fisher Scientific Inc. - Key news
                • Thermo Fisher Scientific Inc. - Key offerings
                • Thermo Fisher Scientific Inc. - Segment focus
                • SWOT

              16 Appendix

              • 16.1 Scope of the report
                • 16.2 Inclusions and exclusions checklist
                  • Inclusions checklist
                  • Exclusions checklist
                • 16.3 Currency conversion rates for US$
                  • Currency conversion rates for US$
                • 16.4 Research methodology
                  • Research methodology
                • 16.5 Data procurement
                  • Information sources
                • 16.6 Data validation
                  • Data validation
                • 16.7 Validation techniques employed for market sizing
                  • Validation techniques employed for market sizing
                • 16.8 Data synthesis
                  • Data synthesis
                • 16.9 360 degree market analysis
                  • 360 degree market analysis
                • 16.10 List of abbreviations
                  • List of abbreviations

                Research Methodology

                Technavio presents a detailed picture of the market by way of study, synthesis, and summation of data from multiple sources. The analysts have presented the various facets of the market with a particular focus on identifying the key industry influencers. The data thus presented is comprehensive, reliable, and the result of extensive research, both primary and secondary.

                INFORMATION SOURCES

                Primary sources

                • Manufacturers and suppliers
                • Channel partners
                • Industry experts
                • Strategic decision makers

                Secondary sources

                • Industry journals and periodicals
                • Government data
                • Financial reports of key industry players
                • Historical data
                • Press releases

                DATA ANALYSIS

                Data Synthesis

                • Collation of data
                • Estimation of key figures
                • Analysis of derived insights

                Data Validation

                • Triangulation with data models
                • Reference against proprietary databases
                • Corroboration with industry experts

                REPORT WRITING

                Qualitative

                • Market drivers
                • Market challenges
                • Market trends
                • Five forces analysis

                Quantitative

                • Market size and forecast
                • Market segmentation
                • Geographical insights
                • Competitive landscape

                Interested in this report?

                Get your sample now to see our research methodology and insights!

                Download Now

                Frequently Asked Questions

                Carrier Screening market growth will increase by $ 3897.9 mn during 2025-2029.

                The Carrier Screening market is expected to grow at a CAGR of 22.5% during 2025-2029.

                Carrier Screening market is segmented by Type( Expanded, Targeted disease) Technology( DNA sequencing, Polymerase chain reaction (PCR), Microarrays, Others) Test( Molecular screening tests, Biochemical screening tests)

                Abbott Laboratories, Agilent Technologies Inc., CENTOGENE NV, Danaher Corp., DiaSorin SpA, Eurofins Scientific SE, F. Hoffmann La Roche Ltd., Fulgent Genetics Inc., Gene By Gene Ltd, Illumina Inc., Invitae Corp., Laboratory Corp. of America Holdings, MedGenome Labs Ltd., Myriad Genetics Inc., Natera Inc., OPKO Health Inc., Otogenetics Corporation, Quest Diagnostics Inc., Sema4 OpCo Inc., Thermo Fisher Scientific Inc. are a few of the key vendors in the Carrier Screening market.

                North America will register the highest growth rate of 38% among the other regions. Therefore, the Carrier Screening market in North America is expected to garner significant business opportunities for the vendors during the forecast period.

                US, Germany, UK, Canada, Japan, France, China, Italy, Spain, India

                • Rising prevalence of genetic diseases and disordersLaboratories and hospitals are witnessing an increasing demand for carrier screening owing to the rising prevalence of genetic diseases such as cystic fibrosis is the driving factor this market.
                • Tay-Sachs disease is the driving factor this market.
                • and sickle cell anemia. Furthermore is the driving factor this market.
                • the significant demand for carrier screening can be attributed to prenatal carrier screening procedures. The increasing incidence of disabilities in newborns has surged the adoption of prenatal testing to quickly treat manageable genetic disorders and diseases. For instance is the driving factor this market.
                • according to the Centers for Disease Control and Prevention (CDC) is the driving factor this market.
                • approximately 1 in every 33 babies (about 3.0%) born in the United States each year is affected by a birth defect. Globally is the driving factor this market.
                • the World Health Organization (WHO) estimates that around 8 million babies are born with a birth defect annually. Congenital disorders are responsible for approximately 10% of all newborn deaths worldwide is the driving factor this market.
                • and many survivors may face lifelong disabilities if they do not have timely access to high-quality care. Birth defects are the leading cause of infant deaths in the U.S. is the driving factor this market.
                • accounting for 20% of all infant deaths. Moreover is the driving factor this market.
                • parents with inheritable genetic conditions such as autosomal dominant and recessive disorders prefer early disease diagnosis through prenatal testing procedures. For instance is the driving factor this market.
                • either parent having a gene with the autosomal dominant condition has a 50% chance of inheriting disorder to their offspring. This creates a necessity among parents to opt for preventive is the driving factor this market.
                • diagnostic procedures such as prenatal carrier screening. For instance is the driving factor this market.
                • in July 2023 is the driving factor this market.
                • Quest Diagnostics introduced its first consumer-initiated genetic test is the driving factor this market.
                • Genetic Insights is the driving factor this market.
                • available exclusively through its consumer health platform is the driving factor this market.
                • questhealth.com. This offering empowers individuals to assess their genetic predisposition to various inherited health conditions is the driving factor this market.
                • including breast and colon cancer is the driving factor this market.
                • heart and blood disorders is the driving factor this market.
                • and carrier status for diseases like cystic fibrosis is the driving factor this market.
                • sickle cell anemia is the driving factor this market.
                • and Tay-Sachs disease. Thus is the driving factor this market.
                • the rising prevalence of genetic diseases and disorders is expected to drive the growth of the market during the forecast period. is the driving factor this market.

                The Carrier Screening market vendors should focus on grabbing business opportunities from the Expanded segment as it accounted for the largest market share in the base year.