Carbon Black In Lead-acid Battery Market Analysis, Size, and Forecast 2026-2030: APAC (China, India, and Japan), North America (US, Canada, and Mexico), Europe (Germany, UK, and France), South America (Brazil, Argentina, and Colombia), Middle East and Africa (South Africa, Saudi Arabia, and Turkey), and Rest of World (ROW)

Carbon Black In Lead-acid Battery Market Analysis, Size, and Forecast 2026-2030:
APAC (China, India, and Japan), North America (US, Canada, and Mexico), Europe (Germany, UK, and France), South America (Brazil, Argentina, and Colombia), Middle East and Africa (South Africa, Saudi Arabia, and Turkey), and Rest of World (ROW)

Published: Jan 2026 265 Pages SKU: IRTNTR73813

Market Overview at a Glance

$129.3 Mn
Market Opportunity
4.5%
CAGR 2025 - 2030
46.9%
APAC Growth
$340 Mn
Flooded lead-acid battery segment 2024

Carbon Black In Lead-acid Battery Market Size 2026-2030

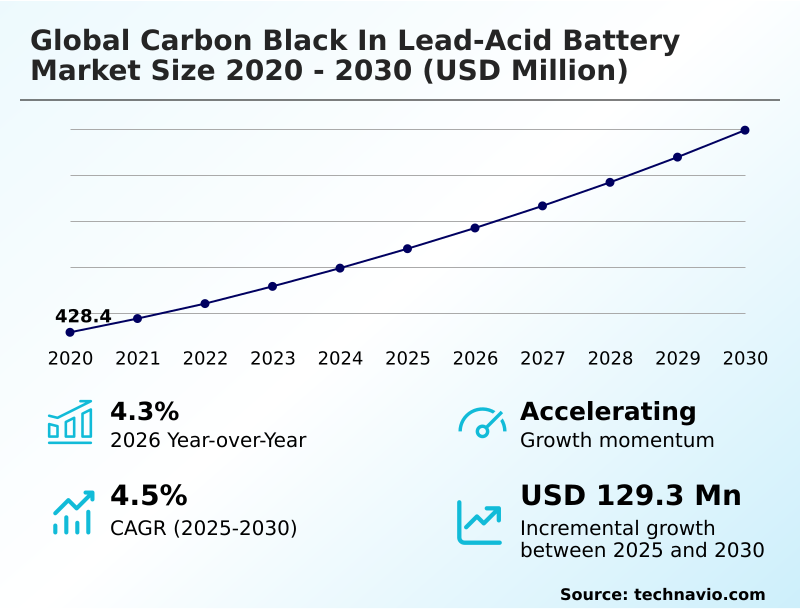
The carbon black in lead-acid battery market size is valued to increase by USD 129.3 million, at a CAGR of 4.5% from 2025 to 2030. Increasing demand from automotive industry will drive the carbon black in lead-acid battery market.

Major Market Trends & Insights

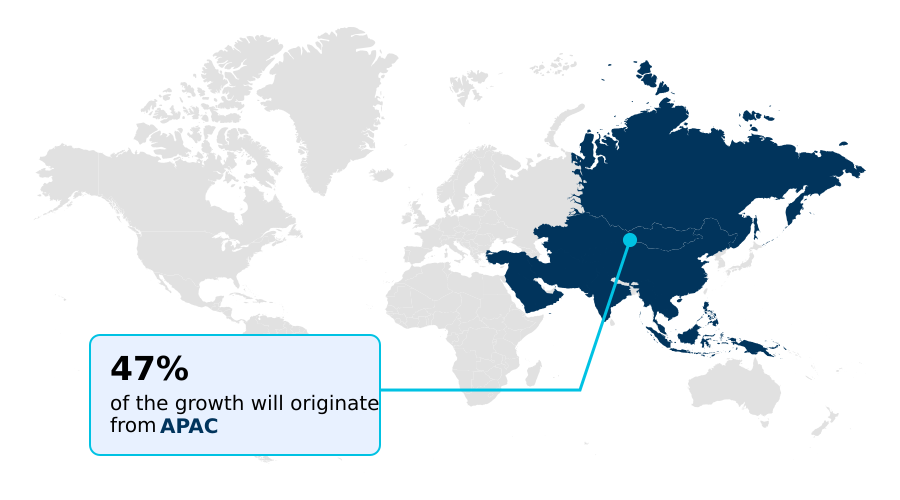
  • APAC dominated the market and accounted for a 46.9% growth during the forecast period.
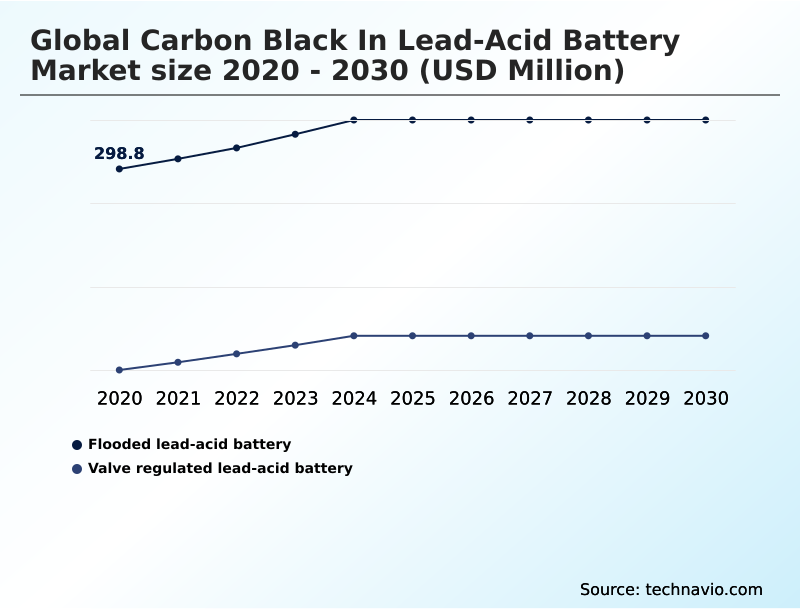
  • By Battery Type - Flooded lead-acid battery segment was valued at USD 340 million in 2024
  • By Application - Automotive batteries segment accounted for the largest market revenue share in 2024

Market Size & Forecast

  • Market Opportunities: USD 220.5 million
  • Market Future Opportunities: USD 129.3 million
  • CAGR from 2025 to 2030 : 4.5%

Market Summary

  • The carbon black in lead-acid battery market is defined by the material's critical role in enhancing battery performance and longevity. Carbon black additives are integral to the negative active mass, where they improve electrode paste conductivity and mitigate sulfation, a common failure mode.
  • This is particularly vital for applications demanding high-rate partial-state-of-charge operation, such as automotive start-stop vehicle systems and industrial uninterruptible power supplies (UPS). For instance, an automotive OEM developing vehicles with regenerative braking requires batteries capable of rapid recharge pulse acceptance, a characteristic directly improved by specialty carbon blacks.
  • The market is shaped by a continuous effort to balance cost with performance, as advanced lead-acid battery chemistry competes with emerging technologies. This involves optimizing carbon black dispersion in battery paste to create a stable conductive network, thereby extending battery cycle life and ensuring reliability.
  • The development of next-generation lead-acid technology hinges on these material science advancements, making it a key focus for battery manufacturers aiming to meet evolving energy storage demands.

What will be the Size of the Carbon Black In Lead-acid Battery Market during the forecast period?

Get Key Insights on Market Forecast (PDF) Request Free Sample

How is the Carbon Black In Lead-acid Battery Market Segmented?

The carbon black in lead-acid battery industry research report provides comprehensive data (region-wise segment analysis), with forecasts and estimates in "USD million" for the period 2026-2030, as well as historical data from 2020-2024 for the following segments.

  • Battery type
    • Flooded lead-acid battery
    • Valve regulated lead-acid battery
  • Application
    • Automotive batteries
    • Industrial batteries
    • Energy storage systems
  • Grade type
    • Standard grade
    • High purity grade
    • Customized grade
  • Geography
    • APAC
      • China
      • India
      • Japan
    • North America
      • US
      • Canada
      • Mexico
    • Europe
      • Germany
      • UK
      • France
    • South America
      • Brazil
      • Argentina
      • Colombia
    • Middle East and Africa
      • South Africa
      • Saudi Arabia
      • Turkey
    • Rest of World (ROW)

By Battery Type Insights

The flooded lead-acid battery segment is estimated to witness significant growth during the forecast period.

The flooded lead-acid battery segment is foundational to the market, driven by its widespread use in automotive SLI batteries and industrial traction batteries.

Within this segment, the inclusion of specific carbon black additives in the negative active mass is a technical necessity for improving lead-acid battery performance and battery cycle life extension.

This conductive carbon material creates a conductive network in battery plates, enhancing electrode paste conductivity and mitigating the formation of lead sulfate crystals, a primary cause of lead-acid battery failure modes.

As manufacturers work on optimizing battery paste formulation to compete with alternative technologies, the use of these additives to improve dynamic charge acceptance by up to 15% has become standard, ensuring reliable operation in demanding applications and improving PSoC performance.

Request Free Sample

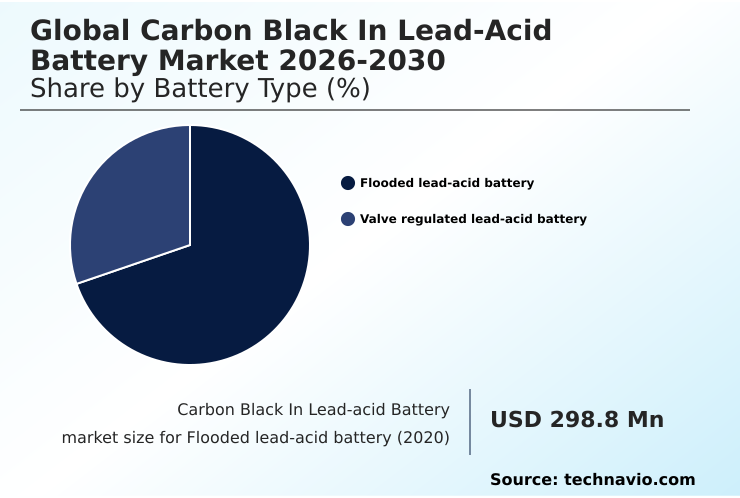
The Flooded lead-acid battery segment was valued at USD 340 million in 2024 and showed a gradual increase during the forecast period.

Request Free Sample

Regional Analysis

APAC is estimated to contribute 46.9% to the growth of the global market during the forecast period.Technavio’s analysts have elaborately explained the regional trends and drivers that shape the market during the forecast period.

See How Carbon Black In Lead-acid Battery Market Demand is Rising in APAC Request Free Sample

Geographically, the market is dominated by the APAC region, which accounts for 46.87% of the global opportunity, significantly outpacing North America at 16.78%.

This leadership is driven by the vast automotive manufacturing sectors in China and India, where carbon black additives are essential for both conventional internal combustion engine vehicles and the 12-volt auxiliary batteries in electric vehicles.

In this region, porous structure enhancement is a key area of R&D. The rapid expansion of telecommunications infrastructure and data centers across APAC also fuels demand for reliable industrial batteries. Improving energy density with carbon is a crucial factor.

In North America and Europe, stringent emissions regulations drive the adoption of start-stop vehicle systems, necessitating batteries with high recharge pulse acceptance and robust battery performance optimization, thereby sustaining demand for high-performance carbon black for automotive batteries.

Market Dynamics

Our researchers analyzed the data with 2025 as the base year, along with the key drivers, trends, and challenges. A holistic analysis of drivers will help companies refine their marketing strategies to gain a competitive advantage.

  • Understanding the global carbon black in lead-acid battery market requires an analysis of the specific benefits of using carbon black additives. A key technical advantage is the material's impact on mitigating irreversible sulfation, which addresses how carbon black impact on battery cycle life. This is particularly relevant when using carbon black in deep-cycle batteries for stationary storage applications.
  • For automotive battery technology material advancements, the focus is on how to enhance charge acceptance in batteries to support start-stop systems. This involves using conductive additives for SLI batteries that reduce internal resistance, with some advanced materials demonstrating a two-fold improvement over standard grades, a crucial factor in automotive supply chain planning.
  • While carbon nanotubes vs carbon black performance is a topic of research, carbon black remains the cost-effective choice. Similarly, while graphene additives in lead-acid battery plates show promise, their commercial-scale use is limited. Therefore, current R&D focuses on specific formulations for lead-carbon batteries and analyzing the cost of carbon black additives to deliver ways to optimize lead-acid battery efficiency.
  • This extends to industrial battery performance material enhancement, where improving PSoC performance in industrial batteries and understanding the environmental impact of lead battery additives are key considerations for manufacturers.

What are the key market drivers leading to the rise in the adoption of Carbon Black In Lead-acid Battery Industry?

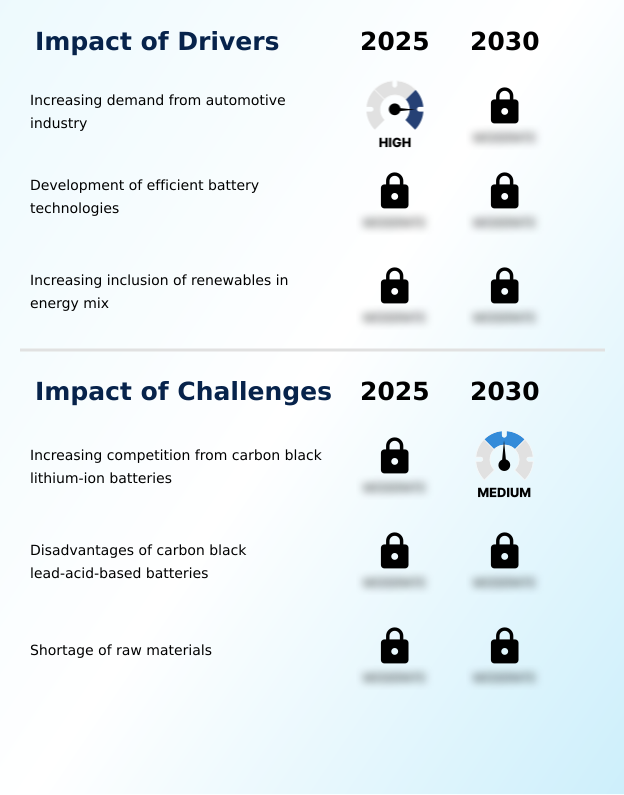
  • Increasing demand from the automotive industry, particularly for vehicles with advanced start-stop systems that require enhanced battery performance, serves as a key driver for the market.

  • The primary driver for the market is the escalating demand from the automotive industry, where carbon black's role in PSoC performance is crucial.
  • Modern vehicles equipped with start-stop systems, now present in over 60% of new vehicles in regions like Europe, require batteries capable of high dynamic charge acceptance.
  • The addition of high surface area carbon improves battery performance under these conditions by more than 20%. This has reinvigorated the utility of flooded lead-acid battery technology, enabling it to meet stringent OEM requirements.
  • Battery additive manufacturing techniques allow for the precise integration of negative plate expanders, ensuring consistent quality and performance.
  • This focus on improving charge acceptance in SLI batteries has solidified the role of carbon additives as indispensable components in advanced lead-acid battery chemistry for automotive applications.

What are the market trends shaping the Carbon Black In Lead-acid Battery Industry?

  • The increasing adoption of hybrid power systems in telecom towers represents a significant market trend, driven by the need for reliable and cost-effective energy in remote locations with poor grid connectivity.

  • A key trend shaping the market is the rising adoption of hybrid power systems, particularly for telecom towers and industrial UPS applications, where cost-effective battery enhancers are critical. This shift is driven by the need for reliable, off-grid power solutions and the lower environmental impact of next-generation lead-acid technology.
  • Hybrid systems incorporating advanced lead-acid batteries can reduce carbon emissions by up to 40% compared to traditional diesel generators. Furthermore, lead-acid batteries utilizing VRLA battery technology and enhanced flooded battery additives offer a 25% lower cost per kilowatt-hour cycle than some alternatives, making them a financially viable option for large-scale energy storage.
  • The role of carbon in battery electrodes is pivotal in achieving the extended cycle life required for such applications, promoting their use in carbon black for energy storage.

What challenges does the Carbon Black In Lead-acid Battery Industry face during its growth?

  • Intensifying competition from alternative energy storage solutions, notably lithium-ion batteries that are experiencing rapid cost reduction and technological advancement, presents a significant challenge to market growth.

  • A significant challenge confronting the market is the intensifying competition from lithium-ion batteries, which are increasingly seen as a direct substitute. Technological advancements are driving lithium-ion battery pack costs toward the sub-$100 per kWh threshold, a stark contrast to lead-acid technologies that typically range from $180-220 per kWh. This price differential creates a formidable performance-to-cost challenge.
  • The market for lead-acid vs lithium-ion additives is thus under pressure, as the rapid decline in lithium-ion prices—over 85% in the last decade—fuels their adoption in data centers and electric vehicles.
  • Consequently, manufacturers of carbon black for traction batteries face the need for continuous innovation in areas like porous structure enhancement to maintain the relevance and cost-effectiveness of lead-carbon batteries in an increasingly competitive landscape.

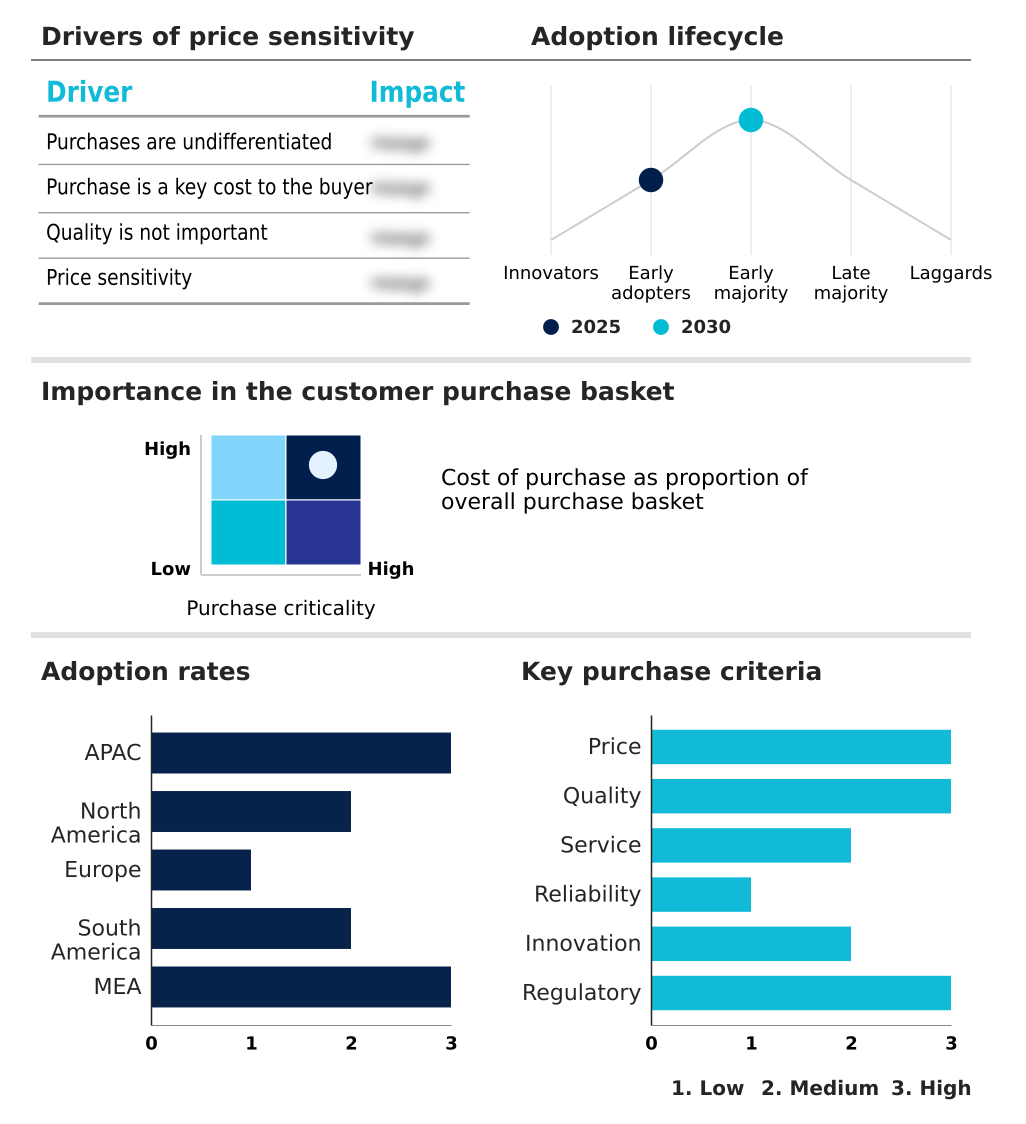
Exclusive Technavio Analysis on Customer Landscape

The carbon black in lead-acid battery market forecasting report includes the adoption lifecycle of the market, covering from the innovator’s stage to the laggard’s stage. It focuses on adoption rates in different regions based on penetration. Furthermore, the carbon black in lead-acid battery market report also includes key purchase criteria and drivers of price sensitivity to help companies evaluate and develop their market growth analysis strategies.

Customer Landscape of Carbon Black In Lead-acid Battery Industry

Competitive Landscape

Companies are implementing various strategies, such as strategic alliances, carbon black in lead-acid battery market forecast, partnerships, mergers and acquisitions, geographical expansion, and product/service launches, to enhance their presence in the industry.

Birla Carbon USA Inc - Specialized conductive carbon materials are engineered to enhance lead-acid battery performance, focusing on improved conductivity and charge acceptance for modern applications.

The industry research and growth report includes detailed analyses of the competitive landscape of the market and information about key companies, including:

  • Birla Carbon USA Inc
  • Cabot Corp.
  • Denka Co. Ltd.
  • Imerys S.A.
  • Orion Engineered Carbons SA
  • SGL Carbon SE
  • Shandong Jinkeli Power Ltd.
  • Superior graphite co

Qualitative and quantitative analysis of companies has been conducted to help clients understand the wider business environment as well as the strengths and weaknesses of key industry players. Data is qualitatively analyzed to categorize companies as pure play, category-focused, industry-focused, and diversified; it is quantitatively analyzed to categorize companies as dominant, leading, strong, tentative, and weak.

Recent Development and News in Carbon black in lead-acid battery market

  • In May 2025, Cabot Corp. launched a new line of specialty carbon blacks engineered to improve the dynamic charge acceptance and cycle life of valve-regulated lead-acid batteries used in energy storage systems.
  • In April 2025, Amara Raja Energy and Mobility commissioned a new manufacturing plant in Telangana, India, dedicated to producing advanced lead-carbon batteries that integrate specialized carbon black formulations for industrial and telecom applications.
  • In January 2025, Orion Engineered Carbons SA announced a strategic partnership with a major European automotive manufacturer to co-develop next-generation conductive additives for 12-volt auxiliary batteries in electric vehicles, aiming to enhance reliability and performance.
  • In October 2024, Birla Carbon completed a capacity expansion at its facility in North America to meet the growing demand for high-purity conductive carbon additives used in automotive start-stop vehicle systems.

Dive into Technavio’s robust research methodology, blending expert interviews, extensive data synthesis, and validated models for unparalleled Carbon Black In Lead-acid Battery Market insights. See full methodology.

Market Scope
Page number 265
Base year 2025
Historic period 2020-2024
Forecast period 2026-2030
Growth momentum & CAGR Accelerate at a CAGR of 4.5%
Market growth 2026-2030 USD 129.3 million
Market structure Concentrated
YoY growth 2025-2026(%) 4.3%
Key countries China, India, Japan, South Korea, Australia, Indonesia, US, Canada, Mexico, Germany, UK, France, Italy, Spain, The Netherlands, Brazil, Argentina, Colombia, South Africa, Nigeria, Saudi Arabia, Egypt and Turkey
Competitive landscape Leading Companies, Market Positioning of Companies, Competitive Strategies, and Industry Risks

Request Free Sample

Research Analyst Overview

  • The carbon black in lead-acid battery market is evolving beyond a commodity-driven space into one defined by material science and application-specific engineering. The integration of specialty carbon blacks into the negative active mass is now a standard practice to achieve significant battery performance optimization.
  • These conductive additives are critical for creating a stable conductive network within the electrode paste, which is essential for sulfation mitigation and achieving superior battery cycle life extension in demanding high-rate partial-state-of-charge conditions.
  • In the automotive sector, the proliferation of start-stop vehicle systems has made dynamic charge acceptance a primary metric, with advanced conductive carbon material enabling improvements of over 30% in recharge pulse acceptance. This trend has elevated the conversation in boardrooms, compelling battery manufacturers to shift product strategy toward high-performance lead-carbon batteries to remain competitive.
  • This focus on porous structure enhancement is vital for both automotive SLI batteries and large-scale energy storage systems, where reliability and efficiency are paramount.

What are the Key Data Covered in this Carbon Black In Lead-acid Battery Market Research and Growth Report?

  • What is the expected growth of the Carbon Black In Lead-acid Battery Market between 2026 and 2030?

    • USD 129.3 million, at a CAGR of 4.5%

  • What segmentation does the market report cover?

    • The report is segmented by Battery Type (Flooded lead-acid battery, and Valve regulated lead-acid battery), Application (Automotive batteries, Industrial batteries, and Energy storage systems), Grade Type (Standard grade, High purity grade, and Customized grade) and Geography (APAC, North America, Europe, South America, Middle East and Africa)

  • Which regions are analyzed in the report?

    • APAC, North America, Europe, South America and Middle East and Africa

  • What are the key growth drivers and market challenges?

    • Increasing demand from automotive industry, Increasing competition from carbon black lithium-ion batteries

  • Who are the major players in the Carbon Black In Lead-acid Battery Market?

    • Birla Carbon USA Inc, Cabot Corp., Denka Co. Ltd., Imerys S.A., Orion Engineered Carbons SA, SGL Carbon SE, Shandong Jinkeli Power Ltd. and Superior graphite co

Market Research Insights

  • The market's trajectory is influenced by the persistent need for improving lead-acid battery performance through advanced material science. The integration of high-conductivity carbon black grades enhances dynamic charge acceptance in automotive SLI batteries by over 20%, a critical metric for OEM partners.
  • Furthermore, optimizing battery paste formulation with specific conductive additives can reduce early failure modes by 15%, significantly lowering warranty-related costs for manufacturers. This focus on advanced lead-acid battery chemistry is essential for applications ranging from industrial UPS systems to the auxiliary power units in electric vehicles.
  • The role of carbon in battery electrodes is central to these improvements, defining the competitive positioning of lead-acid technology against alternatives. The market is expanding as cost-effective battery enhancers enable broader deployment in energy storage systems, especially in regions prioritizing grid stability and renewable energy integration.

We can help! Our analysts can customize this carbon black in lead-acid battery market research report to meet your requirements.

Get in touch

1. Executive Summary

1.1 Market overview

Executive Summary - Chart on Market Overview
Executive Summary - Data Table on Market Overview
Executive Summary - Chart on Global Market Characteristics
Executive Summary - Chart on Market by Geography
Executive Summary - Chart on Market Segmentation by Battery Type
Executive Summary - Chart on Market Segmentation by Application
Executive Summary - Chart on Market Segmentation by Grade Type
Executive Summary - Chart on Incremental Growth
Executive Summary - Data Table on Incremental Growth
Executive Summary - Chart on Company Market Positioning

2. Technavio Analysis

2.1 Analysis of price sensitivity, lifecycle, customer purchase basket, adoption rates, and purchase criteria

2.2 Criticality of inputs and Factors of differentiation

Chart on Overview on criticality of inputs and factors of differentiation

2.3 Factors of disruption

Chart on Overview on factors of disruption

2.4 Impact of drivers and challenges

Chart on Impact of drivers and challenges in 2025 and 2030

3. Market Landscape

3.1 Market ecosystem

Chart on Parent Market
Data Table on - Parent Market

3.2 Market characteristics

Chart on Market characteristics analysis

3.3 Value chain analysis

Chart on Value chain analysis

4. Market Sizing

4.1 Market definition

Data Table on Offerings of companies included in the market definition

4.2 Market segment analysis

Market segments

4.3 Market size 2025

4.4 Market outlook: Forecast for 2025-2030

Chart on Global - Market size and forecast 2025-2030 ($ million)
Data Table on Global - Market size and forecast 2025-2030 ($ million)
Chart on Global Market: Year-over-year growth 2025-2030 (%)
Data Table on Global Market: Year-over-year growth 2025-2030 (%)

5. Historic Market Size

5.1 Global Carbon Black In Lead-Acid Battery Market 2020 - 2024

Historic Market Size - Data Table on Global Carbon Black In Lead-Acid Battery Market 2020 - 2024 ($ million)

5.2 Battery Type segment analysis 2020 - 2024

Historic Market Size - Battery Type Segment 2020 - 2024 ($ million)

5.3 Application segment analysis 2020 - 2024

Historic Market Size - Application Segment 2020 - 2024 ($ million)

5.4 Grade Type segment analysis 2020 - 2024

Historic Market Size - Grade Type Segment 2020 - 2024 ($ million)

5.5 Geography segment analysis 2020 - 2024

Historic Market Size - Geography Segment 2020 - 2024 ($ million)

5.6 Country segment analysis 2020 - 2024

Historic Market Size - Country Segment 2020 - 2024 ($ million)

6. Qualitative Analysis

6.1 The AI impact on Global Carbon Black in Lead-acid Battery Market

7. Five Forces Analysis

7.1 Five forces summary

Five forces analysis - Comparison between 2025 and 2030

7.2 Bargaining power of buyers

Bargaining power of buyers - Impact of key factors 2025 and 2030

7.3 Bargaining power of suppliers

Bargaining power of suppliers - Impact of key factors in 2025 and 2030

7.4 Threat of new entrants

Threat of new entrants - Impact of key factors in 2025 and 2030

7.5 Threat of substitutes

Threat of substitutes - Impact of key factors in 2025 and 2030

7.6 Threat of rivalry

Threat of rivalry - Impact of key factors in 2025 and 2030

7.7 Market condition

Chart on Market condition - Five forces 2025 and 2030

8. Market Segmentation by Battery Type

8.1 Market segments

Chart on Battery Type - Market share 2025-2030 (%)
Data Table on Battery Type - Market share 2025-2030 (%)

8.2 Comparison by Battery Type

Chart on Comparison by Battery Type
Data Table on Comparison by Battery Type

8.3 Flooded lead-acid battery - Market size and forecast 2025-2030

Chart on Flooded lead-acid battery - Market size and forecast 2025-2030 ($ million)
Data Table on Flooded lead-acid battery - Market size and forecast 2025-2030 ($ million)
Chart on Flooded lead-acid battery - Year-over-year growth 2025-2030 (%)
Data Table on Flooded lead-acid battery - Year-over-year growth 2025-2030 (%)

8.4 Valve regulated lead-acid battery - Market size and forecast 2025-2030

Chart on Valve regulated lead-acid battery - Market size and forecast 2025-2030 ($ million)
Data Table on Valve regulated lead-acid battery - Market size and forecast 2025-2030 ($ million)
Chart on Valve regulated lead-acid battery - Year-over-year growth 2025-2030 (%)
Data Table on Valve regulated lead-acid battery - Year-over-year growth 2025-2030 (%)

8.5 Market opportunity by Battery Type

Market opportunity by Battery Type ($ million)
Data Table on Market opportunity by Battery Type ($ million)

9. Market Segmentation by Application

9.1 Market segments

Chart on Application - Market share 2025-2030 (%)
Data Table on Application - Market share 2025-2030 (%)

9.2 Comparison by Application

Chart on Comparison by Application
Data Table on Comparison by Application

9.3 Automotive batteries - Market size and forecast 2025-2030

Chart on Automotive batteries - Market size and forecast 2025-2030 ($ million)
Data Table on Automotive batteries - Market size and forecast 2025-2030 ($ million)
Chart on Automotive batteries - Year-over-year growth 2025-2030 (%)
Data Table on Automotive batteries - Year-over-year growth 2025-2030 (%)

9.4 Industrial batteries - Market size and forecast 2025-2030

Chart on Industrial batteries - Market size and forecast 2025-2030 ($ million)
Data Table on Industrial batteries - Market size and forecast 2025-2030 ($ million)
Chart on Industrial batteries - Year-over-year growth 2025-2030 (%)
Data Table on Industrial batteries - Year-over-year growth 2025-2030 (%)

9.5 Energy storage systems - Market size and forecast 2025-2030

Chart on Energy storage systems - Market size and forecast 2025-2030 ($ million)
Data Table on Energy storage systems - Market size and forecast 2025-2030 ($ million)
Chart on Energy storage systems - Year-over-year growth 2025-2030 (%)
Data Table on Energy storage systems - Year-over-year growth 2025-2030 (%)

9.6 Market opportunity by Application

Market opportunity by Application ($ million)
Data Table on Market opportunity by Application ($ million)

10. Market Segmentation by Grade Type

10.1 Market segments

Chart on Grade Type - Market share 2025-2030 (%)
Data Table on Grade Type - Market share 2025-2030 (%)

10.2 Comparison by Grade Type

Chart on Comparison by Grade Type
Data Table on Comparison by Grade Type

10.3 Standard grade - Market size and forecast 2025-2030

Chart on Standard grade - Market size and forecast 2025-2030 ($ million)
Data Table on Standard grade - Market size and forecast 2025-2030 ($ million)
Chart on Standard grade - Year-over-year growth 2025-2030 (%)
Data Table on Standard grade - Year-over-year growth 2025-2030 (%)

10.4 High purity grade - Market size and forecast 2025-2030

Chart on High purity grade - Market size and forecast 2025-2030 ($ million)
Data Table on High purity grade - Market size and forecast 2025-2030 ($ million)
Chart on High purity grade - Year-over-year growth 2025-2030 (%)
Data Table on High purity grade - Year-over-year growth 2025-2030 (%)

10.5 Customized grade - Market size and forecast 2025-2030

Chart on Customized grade - Market size and forecast 2025-2030 ($ million)
Data Table on Customized grade - Market size and forecast 2025-2030 ($ million)
Chart on Customized grade - Year-over-year growth 2025-2030 (%)
Data Table on Customized grade - Year-over-year growth 2025-2030 (%)

10.6 Market opportunity by Grade Type

Market opportunity by Grade Type ($ million)
Data Table on Market opportunity by Grade Type ($ million)

11. Customer Landscape

11.1 Customer landscape overview

Analysis of price sensitivity, lifecycle, customer purchase basket, adoption rates, and purchase criteria

12. Geographic Landscape

12.1 Geographic segmentation

Chart on Market share by geography 2025-2030 (%)
Data Table on Market share by geography 2025-2030 (%)

12.2 Geographic comparison

Chart on Geographic comparison
Data Table on Geographic comparison

12.3 APAC - Market size and forecast 2025-2030

Chart on APAC - Market size and forecast 2025-2030 ($ million)
Data Table on APAC - Market size and forecast 2025-2030 ($ million)
Chart on APAC - Year-over-year growth 2025-2030 (%)
Data Table on APAC - Year-over-year growth 2025-2030 (%)
Chart on Regional Comparison - APAC
Data Table on Regional Comparison - APAC

12.3.1 China - Market size and forecast 2025-2030

Chart on China - Market size and forecast 2025-2030 ($ million)
Data Table on China - Market size and forecast 2025-2030 ($ million)
Chart on China - Year-over-year growth 2025-2030 (%)
Data Table on China - Year-over-year growth 2025-2030 (%)

12.3.2 India - Market size and forecast 2025-2030

Chart on India - Market size and forecast 2025-2030 ($ million)
Data Table on India - Market size and forecast 2025-2030 ($ million)
Chart on India - Year-over-year growth 2025-2030 (%)
Data Table on India - Year-over-year growth 2025-2030 (%)

12.3.3 Japan - Market size and forecast 2025-2030

Chart on Japan - Market size and forecast 2025-2030 ($ million)
Data Table on Japan - Market size and forecast 2025-2030 ($ million)
Chart on Japan - Year-over-year growth 2025-2030 (%)
Data Table on Japan - Year-over-year growth 2025-2030 (%)

12.3.4 South Korea - Market size and forecast 2025-2030

Chart on South Korea - Market size and forecast 2025-2030 ($ million)
Data Table on South Korea - Market size and forecast 2025-2030 ($ million)
Chart on South Korea - Year-over-year growth 2025-2030 (%)
Data Table on South Korea - Year-over-year growth 2025-2030 (%)

12.3.5 Australia - Market size and forecast 2025-2030

Chart on Australia - Market size and forecast 2025-2030 ($ million)
Data Table on Australia - Market size and forecast 2025-2030 ($ million)
Chart on Australia - Year-over-year growth 2025-2030 (%)
Data Table on Australia - Year-over-year growth 2025-2030 (%)

12.3.6 Indonesia - Market size and forecast 2025-2030

Chart on Indonesia - Market size and forecast 2025-2030 ($ million)
Data Table on Indonesia - Market size and forecast 2025-2030 ($ million)
Chart on Indonesia - Year-over-year growth 2025-2030 (%)
Data Table on Indonesia - Year-over-year growth 2025-2030 (%)

12.4 North America - Market size and forecast 2025-2030

Chart on North America - Market size and forecast 2025-2030 ($ million)
Data Table on North America - Market size and forecast 2025-2030 ($ million)
Chart on North America - Year-over-year growth 2025-2030 (%)
Data Table on North America - Year-over-year growth 2025-2030 (%)
Chart on Regional Comparison - North America
Data Table on Regional Comparison - North America

12.4.1 US - Market size and forecast 2025-2030

Chart on US - Market size and forecast 2025-2030 ($ million)
Data Table on US - Market size and forecast 2025-2030 ($ million)
Chart on US - Year-over-year growth 2025-2030 (%)
Data Table on US - Year-over-year growth 2025-2030 (%)

12.4.2 Canada - Market size and forecast 2025-2030

Chart on Canada - Market size and forecast 2025-2030 ($ million)
Data Table on Canada - Market size and forecast 2025-2030 ($ million)
Chart on Canada - Year-over-year growth 2025-2030 (%)
Data Table on Canada - Year-over-year growth 2025-2030 (%)

12.4.3 Mexico - Market size and forecast 2025-2030

Chart on Mexico - Market size and forecast 2025-2030 ($ million)
Data Table on Mexico - Market size and forecast 2025-2030 ($ million)
Chart on Mexico - Year-over-year growth 2025-2030 (%)
Data Table on Mexico - Year-over-year growth 2025-2030 (%)

12.5 Europe - Market size and forecast 2025-2030

Chart on Europe - Market size and forecast 2025-2030 ($ million)
Data Table on Europe - Market size and forecast 2025-2030 ($ million)
Chart on Europe - Year-over-year growth 2025-2030 (%)
Data Table on Europe - Year-over-year growth 2025-2030 (%)
Chart on Regional Comparison - Europe
Data Table on Regional Comparison - Europe

12.5.1 Germany - Market size and forecast 2025-2030

Chart on Germany - Market size and forecast 2025-2030 ($ million)
Data Table on Germany - Market size and forecast 2025-2030 ($ million)
Chart on Germany - Year-over-year growth 2025-2030 (%)
Data Table on Germany - Year-over-year growth 2025-2030 (%)

12.5.2 UK - Market size and forecast 2025-2030

Chart on UK - Market size and forecast 2025-2030 ($ million)
Data Table on UK - Market size and forecast 2025-2030 ($ million)
Chart on UK - Year-over-year growth 2025-2030 (%)
Data Table on UK - Year-over-year growth 2025-2030 (%)

12.5.3 France - Market size and forecast 2025-2030

Chart on France - Market size and forecast 2025-2030 ($ million)
Data Table on France - Market size and forecast 2025-2030 ($ million)
Chart on France - Year-over-year growth 2025-2030 (%)
Data Table on France - Year-over-year growth 2025-2030 (%)

12.5.4 Italy - Market size and forecast 2025-2030

Chart on Italy - Market size and forecast 2025-2030 ($ million)
Data Table on Italy - Market size and forecast 2025-2030 ($ million)
Chart on Italy - Year-over-year growth 2025-2030 (%)
Data Table on Italy - Year-over-year growth 2025-2030 (%)

12.5.5 Spain - Market size and forecast 2025-2030

Chart on Spain - Market size and forecast 2025-2030 ($ million)
Data Table on Spain - Market size and forecast 2025-2030 ($ million)
Chart on Spain - Year-over-year growth 2025-2030 (%)
Data Table on Spain - Year-over-year growth 2025-2030 (%)

12.5.6 The Netherlands - Market size and forecast 2025-2030

Chart on The Netherlands - Market size and forecast 2025-2030 ($ million)
Data Table on The Netherlands - Market size and forecast 2025-2030 ($ million)
Chart on The Netherlands - Year-over-year growth 2025-2030 (%)
Data Table on The Netherlands - Year-over-year growth 2025-2030 (%)

12.6 South America - Market size and forecast 2025-2030

Chart on South America - Market size and forecast 2025-2030 ($ million)
Data Table on South America - Market size and forecast 2025-2030 ($ million)
Chart on South America - Year-over-year growth 2025-2030 (%)
Data Table on South America - Year-over-year growth 2025-2030 (%)
Chart on Regional Comparison - South America
Data Table on Regional Comparison - South America

12.6.1 Brazil - Market size and forecast 2025-2030

Chart on Brazil - Market size and forecast 2025-2030 ($ million)
Data Table on Brazil - Market size and forecast 2025-2030 ($ million)
Chart on Brazil - Year-over-year growth 2025-2030 (%)
Data Table on Brazil - Year-over-year growth 2025-2030 (%)

12.6.2 Argentina - Market size and forecast 2025-2030

Chart on Argentina - Market size and forecast 2025-2030 ($ million)
Data Table on Argentina - Market size and forecast 2025-2030 ($ million)
Chart on Argentina - Year-over-year growth 2025-2030 (%)
Data Table on Argentina - Year-over-year growth 2025-2030 (%)

12.6.3 Colombia - Market size and forecast 2025-2030

Chart on Colombia - Market size and forecast 2025-2030 ($ million)
Data Table on Colombia - Market size and forecast 2025-2030 ($ million)
Chart on Colombia - Year-over-year growth 2025-2030 (%)
Data Table on Colombia - Year-over-year growth 2025-2030 (%)

12.7 Middle East and Africa - Market size and forecast 2025-2030

Chart on Middle East and Africa - Market size and forecast 2025-2030 ($ million)
Data Table on Middle East and Africa - Market size and forecast 2025-2030 ($ million)
Chart on Middle East and Africa - Year-over-year growth 2025-2030 (%)
Data Table on Middle East and Africa - Year-over-year growth 2025-2030 (%)
Chart on Regional Comparison - Middle East and Africa
Data Table on Regional Comparison - Middle East and Africa

12.7.1 South Africa - Market size and forecast 2025-2030

Chart on South Africa - Market size and forecast 2025-2030 ($ million)
Data Table on South Africa - Market size and forecast 2025-2030 ($ million)
Chart on South Africa - Year-over-year growth 2025-2030 (%)
Data Table on South Africa - Year-over-year growth 2025-2030 (%)

12.7.2 Nigeria - Market size and forecast 2025-2030

Chart on Nigeria - Market size and forecast 2025-2030 ($ million)
Data Table on Nigeria - Market size and forecast 2025-2030 ($ million)
Chart on Nigeria - Year-over-year growth 2025-2030 (%)
Data Table on Nigeria - Year-over-year growth 2025-2030 (%)

12.7.3 Saudi Arabia - Market size and forecast 2025-2030

Chart on Saudi Arabia - Market size and forecast 2025-2030 ($ million)
Data Table on Saudi Arabia - Market size and forecast 2025-2030 ($ million)
Chart on Saudi Arabia - Year-over-year growth 2025-2030 (%)
Data Table on Saudi Arabia - Year-over-year growth 2025-2030 (%)

12.7.4 Egypt - Market size and forecast 2025-2030

Chart on Egypt - Market size and forecast 2025-2030 ($ million)
Data Table on Egypt - Market size and forecast 2025-2030 ($ million)
Chart on Egypt - Year-over-year growth 2025-2030 (%)
Data Table on Egypt - Year-over-year growth 2025-2030 (%)

12.7.5 Turkey - Market size and forecast 2025-2030

Chart on Turkey - Market size and forecast 2025-2030 ($ million)
Data Table on Turkey - Market size and forecast 2025-2030 ($ million)
Chart on Turkey - Year-over-year growth 2025-2030 (%)
Data Table on Turkey - Year-over-year growth 2025-2030 (%)

12.8 Market opportunity by geography

Market opportunity by geography ($ million)
Data Tables on Market opportunity by geography ($ million)

13. Drivers, Challenges, and Opportunity

13.1 Market drivers

Increasing demand from automotive industry
Development of efficient battery technologies
Increasing inclusion of renewables in energy mix

13.2 Market challenges

Increasing competition from carbon black lithium-ion batteries
Disadvantages of carbon black lead-acid-based batteries
Shortage of raw materials

13.3 Impact of drivers and challenges

Impact of drivers and challenges in 2025 and 2030

13.4 Market opportunities

Increasing adoption of hybrid power systems in telecom towers
Rising adoption in UPS systems and manufacturing industry
Surging demand from submarine vessel manufacturers

14. Competitive Landscape

14.1 Overview

14.2

Overview on criticality of inputs and factors of differentiation

14.3 Landscape disruption

Overview on factors of disruption

14.4 Industry risks

Impact of key risks on business

15. Competitive Analysis

15.1 Companies profiled

Companies covered

15.2 Company ranking index

15.3 Market positioning of companies

Matrix on companies position and classification

15.4 Birla Carbon USA Inc

Birla Carbon USA Inc - Overview
Birla Carbon USA Inc - Product / Service
Birla Carbon USA Inc - Key offerings
SWOT

15.5 Cabot Corp.

Cabot Corp. - Overview
Cabot Corp. - Business segments
Cabot Corp. - Key news
Cabot Corp. - Key offerings
Cabot Corp. - Segment focus
SWOT

15.6 Denka Co. Ltd.

Denka Co. Ltd. - Overview
Denka Co. Ltd. - Business segments
Denka Co. Ltd. - Key offerings
Denka Co. Ltd. - Segment focus
SWOT

15.7 Imerys S.A.

Imerys S.A. - Overview
Imerys S.A. - Business segments
Imerys S.A. - Key offerings
Imerys S.A. - Segment focus
SWOT

15.8 Orion Engineered Carbons SA

Orion Engineered Carbons SA - Overview
Orion Engineered Carbons SA - Business segments
Orion Engineered Carbons SA - Key offerings
Orion Engineered Carbons SA - Segment focus
SWOT

15.9 SGL Carbon SE

SGL Carbon SE - Overview
SGL Carbon SE - Business segments
SGL Carbon SE - Key news
SGL Carbon SE - Key offerings
SGL Carbon SE - Segment focus
SWOT

15.10 Shandong Jinkeli Power Ltd.

Shandong Jinkeli Power Ltd. - Overview
Shandong Jinkeli Power Ltd. - Product / Service
Shandong Jinkeli Power Ltd. - Key offerings
SWOT

15.11 Superior graphite co

Superior graphite co - Overview
Superior graphite co - Product / Service
Superior graphite co - Key offerings
SWOT

16. Appendix

16.1 Scope of the report

Market definition
Objectives
Notes and caveats

16.2 Inclusions and exclusions checklist

Inclusions checklist
Exclusions checklist

16.3 Currency conversion rates for US$

16.4 Research methodology

16.5 Data procurement

Information sources

16.6 Data validation

16.7 Validation techniques employed for market sizing

16.8 Data synthesis

16.9 360 degree market analysis

16.10 List of abbreviations

Research Methodology

Technavio presents a detailed picture of the market by way of study, synthesis, and summation of data from multiple sources. The analysts have presented the various facets of the market with a particular focus on identifying the key industry influencers. The data thus presented is comprehensive, reliable, and the result of extensive research, both primary and secondary.

INFORMATION SOURCES

Primary sources

  • Manufacturers and suppliers
  • Channel partners
  • Industry experts
  • Strategic decision makers

Secondary sources

  • Industry journals and periodicals
  • Government data
  • Financial reports of key industry players
  • Historical data
  • Press releases

DATA ANALYSIS

Data Synthesis

  • Collation of data
  • Estimation of key figures
  • Analysis of derived insights

Data Validation

  • Triangulation with data models
  • Reference against proprietary databases
  • Corroboration with industry experts

REPORT WRITING

Qualitative

  • Market drivers
  • Market challenges
  • Market trends
  • Five forces analysis

Quantitative

  • Market size and forecast
  • Market segmentation
  • Geographical insights
  • Competitive landscape

Interested in this report?

Get your sample now to see our research methodology and insights!

Download Now

Frequently Asked Questions

Carbon Black In Lead-acid Battery market growth will increase by USD 129.3 million during 2026-2030.

The Carbon Black In Lead-acid Battery market is expected to grow at a CAGR of 4.5% during 2026-2030.

Carbon Black In Lead-acid Battery market is segmented by Battery type (Flooded lead-acid battery, Valve regulated lead-acid battery) Application (Automotive batteries, Industrial batteries, Energy storage systems) Grade type (Standard grade, High purity grade, Customized grade)

Birla Carbon USA Inc, Cabot Corp., Denka Co. Ltd., Imerys S.A., Orion Engineered Carbons SA, SGL Carbon SE, Shandong Jinkeli Power Ltd., Superior graphite co are a few of the key vendors in the Carbon Black In Lead-acid Battery market.

APAC will register the highest growth rate of 46.9% among the other regions. Therefore, the Carbon Black In Lead-acid Battery market in APAC is expected to garner significant business opportunities for the vendors during the forecast period.

China, India, Japan, South Korea, Australia, Indonesia, US, Canada, Mexico, Germany, UK, France, Italy, Spain, The Netherlands, Brazil, Argentina, Colombia, South Africa, Nigeria, Saudi Arabia, Egypt, Turkey

  • Increasing demand from automotive industry is the driving factor this market.

The Carbon Black In Lead-acid Battery market vendors should focus on grabbing business opportunities from the Battery type segment as it accounted for the largest market share in the base year.