Bunker Fuel Market Analysis, Size, and Forecast 2025-2029: North America (US), Europe (France, Germany, The Netherlands, and UK), Middle East and Africa (UAE), APAC (China, India, Japan, and Singapore), and Rest of World (ROW)

Bunker Fuel Market Analysis, Size, and Forecast 2025-2029:
North America (US), Europe (France, Germany, The Netherlands, and UK), Middle East and Africa (UAE), APAC (China, India, Japan, and Singapore), and Rest of World (ROW)

Published: Jun 2025 230 Pages SKU: IRTNTR40326

Market Overview at a Glance

$33.8 B
Market Opportunity
4.5%
CAGR
4.1
YoY growth 2024-2025(%)

Bunker Fuel Market Size 2025-2029

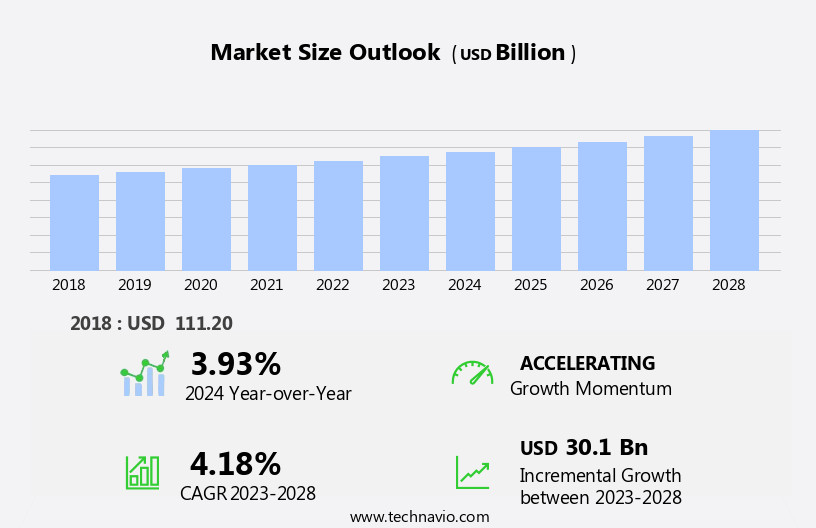
The bunker fuel market size is forecast to increase by USD 33.8 billion, at a CAGR of 4.5% between 2024 and 2029.

  • The market is driven by several key factors, including the increasing naval expenditure and the growing LNG industry. Naval forces worldwide continue to expand their fleets, necessitating a significant demand for bunker fuel to power their operations. Furthermore, the transition towards cleaner energy sources in the maritime sector is gaining momentum, with the LNG industry experiencing robust growth. However, this market landscape is not without challenges. Fluctuations in oil and gas prices pose a significant threat to market stability, as bunker fuel is derived from these commodities. These price volatilities can impact the profitability of bunker fuel suppliers and consumers alike, necessitating effective risk management strategies. Additionally, the growing demand for LNG is leading to an increase in demand for bunker fuel as LNG carriers require large quantities of fuel for their operations. 
  • Companies seeking to capitalize on market opportunities must stay abreast of these trends and challenges, adapting their business models and operations accordingly. Navigating the complexities of the market requires a deep understanding of its underlying dynamics and the ability to respond swiftly to market shifts. Fleet management and optimization are crucial for minimizing fuel consumption and maximizing efficiency. The industry is exploring various solutions to reduce emissions, from fuel efficiency improvements to alternative fuels like liquefied natural gas (LNG) and biofuels.

What will be the Size of the Bunker Fuel Market during the forecast period?

Bunker Fuel Market Size

Explore in-depth regional segment analysis with market size data - historical 2019-2023 and forecasts 2025-2029 - in the full report.  
Request Free Sample

The market continues to evolve, driven by a complex interplay of factors. Liquefied petroleum gas (LPG) is gaining traction as a cleaner alternative to heavy fuel oil (HFO), aligning with International Maritime Organization (IMO) regulations. Ship management companies are increasingly focusing on fuel optimization, incorporating advanced technologies to enhance engine performance and reduce emissions. Bunkering operations and infrastructure are adapting to accommodate various fuel types, including marine gasoil (MGO) and LPG. Freight rates and shipping economics are influenced by fuel costs and the ongoing shift towards cleaner fuels. Fuel delivery methods, from traditional bunkering vessels to new technologies like fuel cell trucks, are evolving to meet changing market demands. IMO regulations, such as Marpol Annex VI and Marpol Annex IV, are driving the maritime industry towards stricter emissions standards.

 Fuel quality and handling are critical aspects of ensuring compliance, with fuel testing and optimization playing essential roles. Ship design and hull optimization are also key factors, as new technologies like hybrid propulsion, shaft generators, and carbon capture are gaining traction. Ballast water management and emissions reduction technologies are also becoming increasingly important, as the industry strives for sustainable shipping practices. The market is a dynamic and evolving landscape, with ongoing activities and unfolding patterns shaping its future. From fuel optimization and emissions reduction to the adoption of new technologies and alternative fuels, the market is poised for continuous change.

How is this Bunker Fuel Industry segmented?

The bunker fuel industry research report provides comprehensive data (region-wise segment analysis), with forecasts and estimates in "USD billion" for the period 2025-2029, as well as historical data from 2019-2023 for the following segments.

  • Type
    • MGO
    • HSFO
    • VLSFO
  • Application
    • Container
    • Bulk carrier
    • Oil tanker
    • General cargo
    • Chemical tanker
  • Distribution Channel
    • IOC/NOC
    • Large independent distributor
    • Small independent distributor
  • Geography
    • North America
      • US
    • Europe
      • France
      • Germany
      • The Netherlands
      • UK
    • Middle East and Africa
      • UAE
    • APAC
      • China
      • India
      • Japan
      • Singapore
    • Rest of World (ROW)

By Type Insights

The MGO segment is estimated to witness significant growth during the forecast period. Marine gas oil (MGO), a distillate fuel derived from crude oil through refining, is widely used in ships and marine vessels due to its lower sulfur content, ensuring compliance with stricter emissions regulations, particularly in Emission Control Areas (ECAs). MGO's cleaner properties, including lower viscosity and density compared to heavy fuel oils (HFO), facilitate easier handling and combustion. Environmental compliance is a significant factor driving the demand for MGO in the maritime industry. Fuel costs, a crucial component of shipping economics, influence the choice between MGO and HFO. Fuel oil blending and bunkering infrastructure adapt to meet the demand for MGO, with bunkering terminals and bunkering vessels playing essential roles in its supply.

Ship design, including combustion chambers and engine performance, is optimized for MGO use. Gas engines and hybrid propulsion systems are gaining popularity for their emissions reduction capabilities, leading to increased demand for MGO as a cleaner alternative. IMO regulations, such as Marpol Annex VI, set strict emissions standards that MGO helps ships meet. Ship management, fleet management, and route optimization are crucial aspects of the shipping industry that consider fuel consumption and emissions. Fuel testing and stabilization ensure the quality and performance of MGO, while carbon capture, green shipping, and sustainable shipping initiatives promote its use.

Marine gasoil optimization, fuel handling, and emissions reduction technologies further contribute to the evolving market dynamics. Sulfur fuel with lower emissions is becoming increasingly popular, as logistics and economic performance increasingly hinge on adherence to emission regulations.

Bunker Fuel Market Size

Request Free Sample

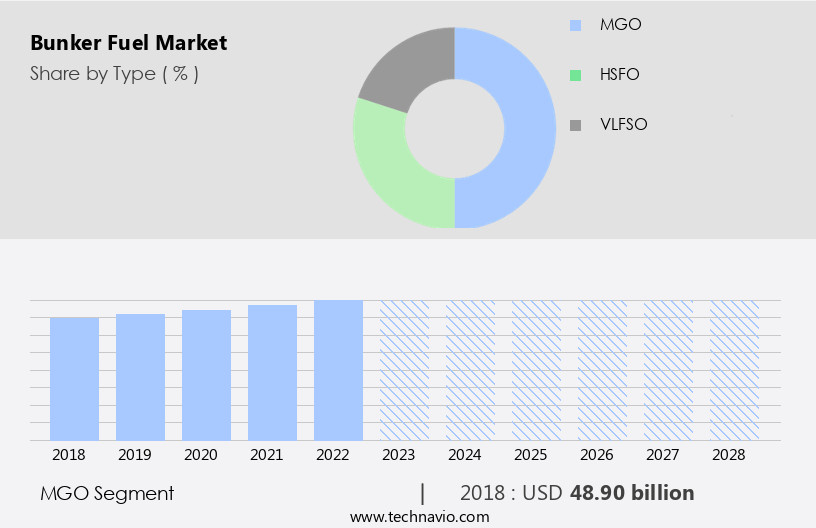
The MGO segment was valued at USD 50.50 billion in 2019 and showed a gradual increase during the forecast period.

The Bunker Fuel market is evolving rapidly to meet stringent environmental regulations and operational demands. The shift toward low sulfur fuel oil is driven by global efforts to reduce SOX and NOX emissions, key contributors to air pollution from maritime transport. To comply with standards, shipping companies are increasingly adopting fuel additives and exhaust gas cleaning systems (scrubbers) that curb harmful pollutants. Efficient fuel storage solutions are also being developed to accommodate diverse fuel types and improve logistics. Additionally, the emergence of electric propulsion systems is reshaping vessel design and cutting reliance on traditional fuels. As cleaner technologies emerge, rising shipping costs remain a challenge, but innovation is propelling a greener, more compliant future in ship emissions management. LNG bunkering is poised to play a pivotal role in the future of marine fuels, with liquefied bio-methane emerging as a potential alternative.

Regional Analysis

APAC is estimated to contribute 37% to the growth of the global market during the forecast period. Technavio's analysts have elaborately explained the regional trends and drivers that shape the market during the forecast period.

Bunker Fuel Market Share by Geography

 Request Free Sample

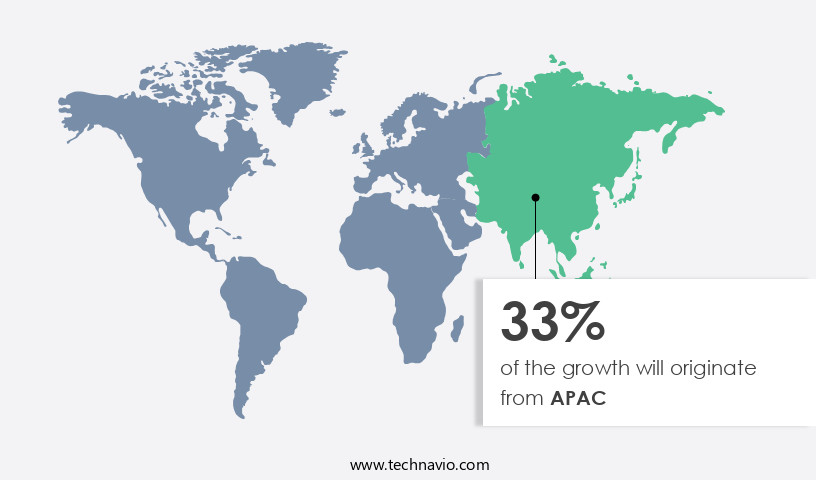
The market in the Asia-Pacific (APAC) region is experiencing significant growth due to the increasing seaborne trade and the region's dominance in global maritime activity. APAC is home to some of the world's busiest ports, including Shanghai, Tianjin, and Dalian in China; Busan in South Korea; Hong Kong; and Singapore. The rising fuel demand in China and India, driven by their expanding economies, is fueling the crude oil and petroleum products trade in these countries, creating a substantial opportunity for bunker fuel implementation in marine vessels. Moreover, the shift towards liquefied natural gas (LNG)-based vessels and the expanding LNG trade is another growth factor for the market in APAC. Environmental compliance, fuel efficiency, and emissions reduction technologies are also influencing the market dynamics, with stricter regulations such as Marpol Annex VI and IMO regulations driving the demand for cleaner fuels.

Fuel costs, fleet management, and shipping economics are critical factors impacting the market. Marine engines, fuel oil blending, ship design, combustion chambers, bunkering terminals, fuel quality, and ship performance are essential considerations in the bunker fuel value chain. Fuel testing, gas engines, bunkering vessels, and fuel handling are key components of the bunkering infrastructure. Hybrid propulsion, carbon capture, green shipping, and sustainable shipping are emerging trends in the maritime industry, which are expected to influence the market in the future. Furthermore, fluctuations in oil and gas prices, including oil and gas storage, continue to impact the market, with price volatility creating both opportunities and challenges for market participants.

The market is also witnessing the adoption of fuel cell technology, diesel engines, liquefied petroleum gas, and liquefied natural gas as alternative fuel options. Bunkering services, fuel consumption, charter rates, and emissions reduction technologies are other critical aspects of the market. The market in APAC is witnessing significant growth due to the increasing seaborne trade, the shift towards cleaner fuels, and the expanding LNG trade. The market is influenced by various factors, including fuel costs, fleet management, shipping economics, fuel quality, and emissions regulations. The market is also witnessing the adoption of new technologies and alternative fuel options to reduce emissions and improve fuel efficiency.

Market Dynamics

Our researchers analyzed the data with 2024 as the base year, along with the key drivers, trends, and challenges. A holistic analysis of drivers will help companies refine their marketing strategies to gain a competitive advantage.

What are the key market drivers leading to the rise in the adoption of Bunker Fuel Industry?

  • A significant increase in naval expenditures serves as the primary catalyst for market growth. Increasing naval expenditures, a key driver in the market, significantly contributes to its growth. The market's expansion is primarily fueled by escalating naval expenditures. Naval expenditures, a significant market influencer, are driving the market's growth through increased investment. The market's expansion is predominantly driven by the escalating naval expenditures. The maritime industry plays a pivotal role in global shipping economics, and the demand for bunker fuel remains high due to the extensive use of heavy fuel oil in shaft generators and gas engines.
  • Fuel handling and fuel injection systems are being upgraded to meet these requirements. Furthermore, the shift towards hybrid propulsion systems and carbon trading schemes is expected to influence the market dynamics. Despite these challenges, the market for bunker fuel is expected to grow steadily due to the increasing demand for maritime transportation and the ongoing modernization of bunkering infrastructure. Bunkering infrastructure is essential for the seamless supply of fuel to ships, and bunkering vessels are increasingly being used to meet this demand. However, stringent regulations, such as those related to SOx and CO2 emissions, are driving the need for fuel testing and fuel efficiency improvements.

What are the market trends shaping the Bunker Fuel Industry?

  • The LNG industry is experiencing significant growth and is becoming a prominent trend in the energy market. This upward trajectory is a noteworthy development in the global energy sector. The use of liquefied petroleum gas (LNG) as a marine fuel is experiencing notable growth due to its environmental benefits and compliance with International Maritime Organization (IMO) regulations. LNG is an odorless, non-toxic, and non-corrosive fuel that leaves no residue when evaporated. While oil-based fuels remain the primary choice for ocean-going vessels, LNG is gaining significance as a viable alternative. The rise in LNG projects under execution and planning is driving the increase in the number of vessels using LNG as fuel. The global shift towards decarbonization goals is driving the demand for cleaner marine fuels over bunker oil.
  • The fuel optimization and engine performance benefits of LNG are also crucial factors in its adoption. Ship management companies are focusing on fuel supply chain efficiency, hull optimization, and route optimization to minimize costs and enhance performance. Freight rates and fuel delivery logistics are also being considered in the transition to LNG as a marine fuel. Overall, LNG's environmental advantages, regulatory compliance, and performance benefits are making it an increasingly attractive alternative fuel option for the shipping industry. LNG's importance lies in its ability to reduce sulfur oxides (SOx), nitrogen oxides (NOx), and carbon dioxide (CO2) emissions, making it a preferred choice for meeting current emission norms.

What challenges does the Bunker Fuel Industry face during its growth?

  • The volatility of oil and gas prices poses a significant challenge to the industry's growth trajectory. The market is influenced by marine emissions regulations and the subsequent demand for fuel stabilization. Bunkering ports play a crucial role in facilitating the supply of bunker fuel to ships. With the increasing focus on emissions reduction, there is growing interest in fuel cell technology and liquefied natural gas as alternatives to diesel engines. Bunkering services are essential for ensuring the continuous operation of ships, and the cost of fuel consumption significantly impacts charter rates. Emissions reduction technologies, such as carbon capture and green shipping, are gaining traction in the shipping industry. Furthermore, the shift towards LNG-powered vessels and the expansion of LNG trade and LNG infrastructure contribute to the growth of the market in APAC.
  • The price of bunker fuel is directly linked to crude oil prices, and its fluctuations can significantly impact the shipping industry's profitability. The recent decline in crude oil prices has resulted in reduced revenues for upstream oil and gas companies, but it has also benefited the shipping industry due to the lower cost of fuel and increased demand for oil tanker storage space. Companies are focusing on operational and technological efficiencies, enabling them to purchase vessels with greater cargo capacity and explore new routes that were previously unprofitable. Ship propulsion systems are being optimized to improve fuel efficiency and reduce emissions.

Exclusive Customer Landscape

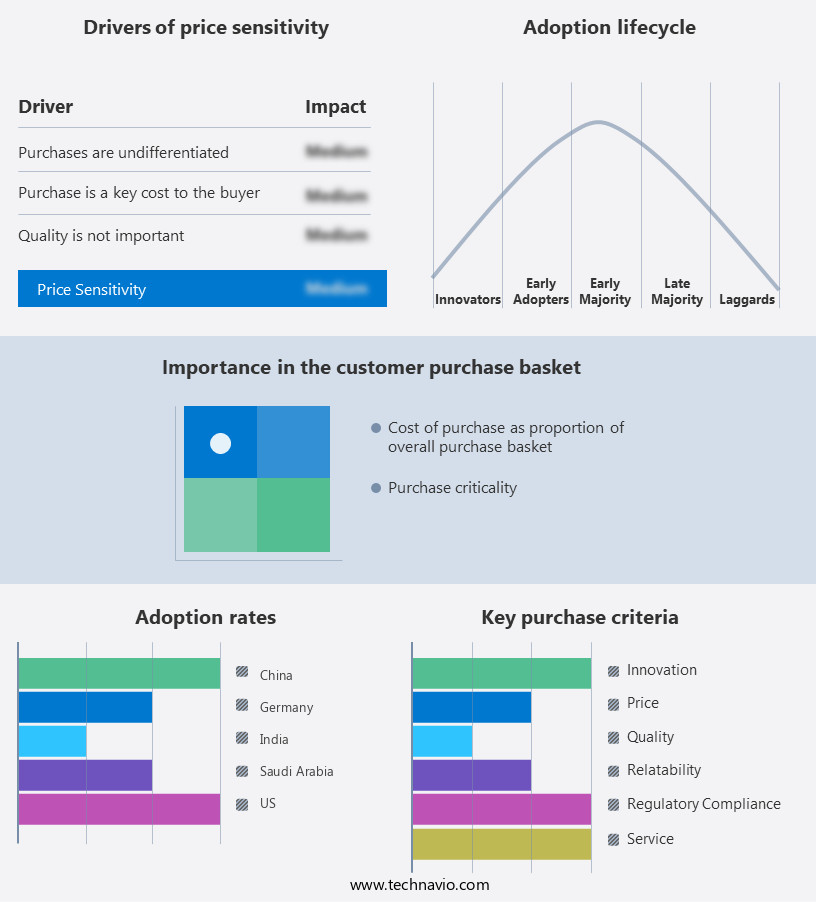
The bunker fuel market forecasting report includes the adoption lifecycle of the market, covering from the innovator's stage to the laggard's stage. It focuses on adoption rates in different regions based on penetration. Furthermore, the bunker fuel market report also includes key purchase criteria and drivers of price sensitivity to help companies evaluate and develop their market growth analysis strategies.

Bunker Fuel Market Share by Geography

 Customer Landscape

Key Companies & Market Insights

Companies are implementing various strategies, such as strategic alliances, bunker fuel market forecast, partnerships, mergers and acquisitions, geographical expansion, and product/service launches, to enhance their presence in the industry.

BP Plc - This company specializes in providing a diverse range of bunker fuels, including Low Sulphur Fuel Oil (LSFO), Very Low Sulphur Fuel Oil (VLSFO), and Marine Gas Oil (MGO), catering to the global shipping industry's demands.

The industry research and growth report includes detailed analyses of the competitive landscape of the market and information about key companies, including:

  • BP Plc
  • Chevron Corp.
  • Eni SpA
  • Exxon Mobil Corp.
  • Gulf Agency Co. Ltd.
  • Indian Oil Corp. Ltd.
  • Marathon Petroleum Corp.
  • Marquard and Bahls AG
  • Neste Corp.
  • PETRONAS Chemicals Group Berhad
  • PJSC LUKOIL
  • Rosneft Oil Co.
  • Saudi Arabian Oil Co.
  • Shell plc
  • TotalEnergies SE

Qualitative and quantitative analysis of companies has been conducted to help clients understand the wider business environment as well as the strengths and weaknesses of key industry players. Data is qualitatively analyzed to categorize companies as pure play, category-focused, industry-focused, and diversified; it is quantitatively analyzed to categorize companies as dominant, leading, strong, tentative, and weak.

Recent Development and News in Bunker Fuel Market

  • In January 2024, Shell Trading (United Kingdom) Limited and TotalEnergies Marine Fuels announced a strategic partnership to jointly develop and operate a new LNG bunkering vessel, marking a significant step towards reducing greenhouse gas emissions in the market (Shell press release, 2024).
  • In March 2024, ExxonMobil Corporation received approval from the U.S. Maritime Administration to construct and operate the first large-scale, commercial-scale carbon capture utilization and storage (CCUS) facility for bunker fuel at its Baytown, Texas, refinery. This initiative is expected to reduce carbon emissions from maritime transportation by approximately 1 million metric tons per year (ExxonMobil press release, 2024).
  • In May 2024, BP and Mitsui O.S.K. Lines, Ltd. (MOL) signed a memorandum of understanding (MoU) to collaborate on the development of a new LNG bunkering vessel. The vessel, which is expected to be the world's largest, will serve the growing demand for low-carbon bunker fuels in the Asia-Pacific region (BP press release, 2024).
  • In April 2025, the European Union (EU) passed the Alternative Fuels Infrastructure Regulation, which mandates the installation of alternative fuel infrastructure, including LNG and hydrogen refueling stations, at a minimum density of 1 station per 150,000 inhabitants by 2030. This policy change is expected to significantly boost the demand for low-carbon bunker fuels in Europe (EU press release, 2025).

Research Analyst Overview

The bunker market encompasses fuel oil suppliers and their deliveries, governed by intricate bunker delivery notes. The quality of fuel oil is paramount, with key specifications including pour point, water content, sulfur content, and calorific value. Fuel oil production is influenced by refineries, certification processes, and fuel oil standards. Bunkering disputes can arise from inaccurate bunker quantity measurement or non-compliance with fuel oil specifications. Bunker prices and fuel oil supply are subject to market dynamics, with fluctuations driven by global trends and fuel oil demand. Renewable fuels and alternative fuels, such as battery electric vehicles and fuel cell vehicles, are gaining traction, potentially disrupting the traditional bunker market.

Flash point and cetane number are crucial factors in fuel oil analysis. Fuel oil trading and bunkering contracts are essential components of the fuel oil distribution network. Fuel oil pipelines play a significant role in transporting fuel oil from production sites to consumers. The bunker market is in a state of flux, with ongoing shifts in fuel oil trends and the emergence of new technologies.

The Bunker Fuel market is navigating a complex landscape shaped by regulatory compliance and global supply dynamics. Rigorous fuel oil certification processes ensure quality standards, while the bunker delivery note provides critical documentation during transfer. Fluctuating bunker price trends drive the need for strategic bunkering agreements between suppliers and shipping firms. Major fuel oil refineries play a pivotal role in maintaining supply consistency, feeding into vast networks of fuel oil storage terminals and distributing through fuel oil tankers. Volatility in fuel oil prices reflects global economic shifts, prompting deeper fuel oil market analysis to optimize procurement strategies.

Dive into Technavio's robust research methodology, blending expert interviews, extensive data synthesis, and validated models for unparalleled Bunker Fuel Market insights. See full methodology.

Market Scope

Report Coverage

Details

Page number

230

Base year

2024

Historic period

2019-2023

Forecast period

2025-2029

Growth momentum & CAGR

Accelerate at a CAGR of 4.5%

Market growth 2025-2029

USD 33.8 billion

Market structure

Fragmented

YoY growth 2024-2025(%)

4.1

Key countries

US, China, Singapore, Germany, UK, UAE, The Netherlands, Japan, France, and India

Competitive landscape

Leading Companies, Market Positioning of Companies, Competitive Strategies, and Industry Risks

Request Free Sample

What are the Key Data Covered in this Bunker Fuel Market Research and Growth Report?

  • CAGR of the Bunker Fuel industry during the forecast period
  • Detailed information on factors that will drive the growth and forecasting between 2025 and 2029
  • Precise estimation of the size of the market and its contribution of the industry in focus to the parent market
  • Accurate predictions about upcoming growth and trends and changes in consumer behaviour
  • Growth of the market across APAC, Europe, Middle East and Africa, North America, and South America
  • Thorough analysis of the market's competitive landscape and detailed information about companies
  • Comprehensive analysis of factors that will challenge the bunker fuel market growth of industry companies

We can help! Our analysts can customize this bunker fuel market research report to meet your requirements.

Get in touch

1 Executive Summary

  • 1.1 Market overview
    • Executive Summary - Chart on Market Overview
    • Executive Summary - Data Table on Market Overview
    • Executive Summary - Chart on Global Market Characteristics
    • Executive Summary - Chart on Market by Geography
    • Executive Summary - Chart on Market Segmentation by Type
    • Executive Summary - Chart on Market Segmentation by Application
    • Executive Summary - Chart on Market Segmentation by Distribution Channel
    • Executive Summary - Chart on Incremental Growth
    • Executive Summary - Data Table on Incremental Growth
    • Executive Summary - Chart on Company Market Positioning

2 Technavio Analysis

  • 2.1 Analysis of price sensitivity, lifecycle, customer purchase basket, adoption rates, and purchase criteria
    • Analysis of price sensitivity, lifecycle, customer purchase basket, adoption rates, and purchase criteria
  • 2.2 Criticality of inputs and Factors of differentiation
    • Overview on criticality of inputs and factors of differentiation
  • 2.3 Factors of disruption
    • Overview on factors of disruption
  • 2.4 Impact of drivers and challenges
    • Impact of drivers and challenges in 2024 and 2029

3 Market Landscape

  • 3.1 Market ecosystem
    • Parent Market
    • Data Table on - Parent Market
  • 3.2 Market characteristics
    • Market characteristics analysis
  • 3.3 Value chain analysis
    • Value chain analysis

4 Market Sizing

  • 4.1 Market definition
    • Offerings of companies included in the market definition
  • 4.2 Market segment analysis
    • Market segments
  • 4.3 Market size 2024
    • 4.4 Market outlook: Forecast for 2024-2029
      • Chart on Global - Market size and forecast 2024-2029 ($ billion)
      • Data Table on Global - Market size and forecast 2024-2029 ($ billion)
      • Chart on Global Market: Year-over-year growth 2024-2029 (%)
      • Data Table on Global Market: Year-over-year growth 2024-2029 (%)

    5 Historic Market Size

    • 5.1 Global Bunker Fuel Market 2019 - 2023
      • Historic Market Size - Data Table on Global Bunker Fuel Market 2019 - 2023 ($ billion)
    • 5.2 Type segment analysis 2019 - 2023
      • Historic Market Size - Type Segment 2019 - 2023 ($ billion)
    • 5.3 Application segment analysis 2019 - 2023
      • Historic Market Size - Application Segment 2019 - 2023 ($ billion)
    • 5.4 Distribution Channel segment analysis 2019 - 2023
      • Historic Market Size - Distribution Channel Segment 2019 - 2023 ($ billion)
    • 5.5 Geography segment analysis 2019 - 2023
      • Historic Market Size - Geography Segment 2019 - 2023 ($ billion)
    • 5.6 Country segment analysis 2019 - 2023
      • Historic Market Size - Country Segment 2019 - 2023 ($ billion)

    6 Qualitative Analysis

    • 6.1 Impact of AI on global bunker fuel market

      7 Five Forces Analysis

      • 7.1 Five forces summary
        • Five forces analysis - Comparison between 2024 and 2029
      • 7.2 Bargaining power of buyers
        • Bargaining power of buyers - Impact of key factors 2024 and 2029
      • 7.3 Bargaining power of suppliers
        • Bargaining power of suppliers - Impact of key factors in 2024 and 2029
      • 7.4 Threat of new entrants
        • Threat of new entrants - Impact of key factors in 2024 and 2029
      • 7.5 Threat of substitutes
        • Threat of substitutes - Impact of key factors in 2024 and 2029
      • 7.6 Threat of rivalry
        • Threat of rivalry - Impact of key factors in 2024 and 2029
      • 7.7 Market condition
        • Chart on Market condition - Five forces 2024 and 2029

      8 Market Segmentation by Type

      • 8.1 Market segments
        • Chart on Type - Market share 2024-2029 (%)
        • Data Table on Type - Market share 2024-2029 (%)
      • 8.2 Comparison by Type
        • Chart on Comparison by Type
        • Data Table on Comparison by Type
      • 8.3 MGO - Market size and forecast 2024-2029
        • Chart on MGO - Market size and forecast 2024-2029 ($ billion)
        • Data Table on MGO - Market size and forecast 2024-2029 ($ billion)
        • Chart on MGO - Year-over-year growth 2024-2029 (%)
        • Data Table on MGO - Year-over-year growth 2024-2029 (%)
      • 8.4 HSFO - Market size and forecast 2024-2029
        • Chart on HSFO - Market size and forecast 2024-2029 ($ billion)
        • Data Table on HSFO - Market size and forecast 2024-2029 ($ billion)
        • Chart on HSFO - Year-over-year growth 2024-2029 (%)
        • Data Table on HSFO - Year-over-year growth 2024-2029 (%)
      • 8.5 VLSFO - Market size and forecast 2024-2029
        • Chart on VLSFO - Market size and forecast 2024-2029 ($ billion)
        • Data Table on VLSFO - Market size and forecast 2024-2029 ($ billion)
        • Chart on VLSFO - Year-over-year growth 2024-2029 (%)
        • Data Table on VLSFO - Year-over-year growth 2024-2029 (%)
      • 8.6 Market opportunity by Type
        • Market opportunity by Type ($ billion)
        • Data Table on Market opportunity by Type ($ billion)

      9 Market Segmentation by Application

      • 9.1 Market segments
        • Chart on Application - Market share 2024-2029 (%)
        • Data Table on Application - Market share 2024-2029 (%)
      • 9.2 Comparison by Application
        • Chart on Comparison by Application
        • Data Table on Comparison by Application
      • 9.3 Container - Market size and forecast 2024-2029
        • Chart on Container - Market size and forecast 2024-2029 ($ billion)
        • Data Table on Container - Market size and forecast 2024-2029 ($ billion)
        • Chart on Container - Year-over-year growth 2024-2029 (%)
        • Data Table on Container - Year-over-year growth 2024-2029 (%)
      • 9.4 Bulk carrier - Market size and forecast 2024-2029
        • Chart on Bulk carrier - Market size and forecast 2024-2029 ($ billion)
        • Data Table on Bulk carrier - Market size and forecast 2024-2029 ($ billion)
        • Chart on Bulk carrier - Year-over-year growth 2024-2029 (%)
        • Data Table on Bulk carrier - Year-over-year growth 2024-2029 (%)
      • 9.5 Oil tanker - Market size and forecast 2024-2029
        • Chart on Oil tanker - Market size and forecast 2024-2029 ($ billion)
        • Data Table on Oil tanker - Market size and forecast 2024-2029 ($ billion)
        • Chart on Oil tanker - Year-over-year growth 2024-2029 (%)
        • Data Table on Oil tanker - Year-over-year growth 2024-2029 (%)
      • 9.6 General cargo - Market size and forecast 2024-2029
        • Chart on General cargo - Market size and forecast 2024-2029 ($ billion)
        • Data Table on General cargo - Market size and forecast 2024-2029 ($ billion)
        • Chart on General cargo - Year-over-year growth 2024-2029 (%)
        • Data Table on General cargo - Year-over-year growth 2024-2029 (%)
      • 9.7 Chemical tanker - Market size and forecast 2024-2029
        • Chart on Chemical tanker - Market size and forecast 2024-2029 ($ billion)
        • Data Table on Chemical tanker - Market size and forecast 2024-2029 ($ billion)
        • Chart on Chemical tanker - Year-over-year growth 2024-2029 (%)
        • Data Table on Chemical tanker - Year-over-year growth 2024-2029 (%)
      • 9.8 Market opportunity by Application
        • Market opportunity by Application ($ billion)
        • Data Table on Market opportunity by Application ($ billion)

      10 Market Segmentation by Distribution Channel

      • 10.1 Market segments
        • Chart on Distribution Channel - Market share 2024-2029 (%)
        • Data Table on Distribution Channel - Market share 2024-2029 (%)
      • 10.2 Comparison by Distribution Channel
        • Chart on Comparison by Distribution Channel
        • Data Table on Comparison by Distribution Channel
      • 10.3 IOC/NOC - Market size and forecast 2024-2029
        • Chart on IOC/NOC - Market size and forecast 2024-2029 ($ billion)
        • Data Table on IOC/NOC - Market size and forecast 2024-2029 ($ billion)
        • Chart on IOC/NOC - Year-over-year growth 2024-2029 (%)
        • Data Table on IOC/NOC - Year-over-year growth 2024-2029 (%)
      • 10.4 Large independent distributor - Market size and forecast 2024-2029
        • Chart on Large independent distributor - Market size and forecast 2024-2029 ($ billion)
        • Data Table on Large independent distributor - Market size and forecast 2024-2029 ($ billion)
        • Chart on Large independent distributor - Year-over-year growth 2024-2029 (%)
        • Data Table on Large independent distributor - Year-over-year growth 2024-2029 (%)
      • 10.5 Small independent distributor - Market size and forecast 2024-2029
        • Chart on Small independent distributor - Market size and forecast 2024-2029 ($ billion)
        • Data Table on Small independent distributor - Market size and forecast 2024-2029 ($ billion)
        • Chart on Small independent distributor - Year-over-year growth 2024-2029 (%)
        • Data Table on Small independent distributor - Year-over-year growth 2024-2029 (%)
      • 10.6 Market opportunity by Distribution Channel
        • Market opportunity by Distribution Channel ($ billion)
        • Data Table on Market opportunity by Distribution Channel ($ billion)

      11 Customer Landscape

      • 11.1 Customer landscape overview
        • Analysis of price sensitivity, lifecycle, customer purchase basket, adoption rates, and purchase criteria

      12 Geographic Landscape

      • 12.1 Geographic segmentation
        • Chart on Market share by geography 2024-2029 (%)
        • Data Table on Market share by geography 2024-2029 (%)
      • 12.2 Geographic comparison
        • Chart on Geographic comparison
        • Data Table on Geographic comparison
      • 12.3 APAC - Market size and forecast 2024-2029
        • Chart on APAC - Market size and forecast 2024-2029 ($ billion)
        • Data Table on APAC - Market size and forecast 2024-2029 ($ billion)
        • Chart on APAC - Year-over-year growth 2024-2029 (%)
        • Data Table on APAC - Year-over-year growth 2024-2029 (%)
      • 12.4 Europe - Market size and forecast 2024-2029
        • Chart on Europe - Market size and forecast 2024-2029 ($ billion)
        • Data Table on Europe - Market size and forecast 2024-2029 ($ billion)
        • Chart on Europe - Year-over-year growth 2024-2029 (%)
        • Data Table on Europe - Year-over-year growth 2024-2029 (%)
      • 12.5 Middle East and Africa - Market size and forecast 2024-2029
        • Chart on Middle East and Africa - Market size and forecast 2024-2029 ($ billion)
        • Data Table on Middle East and Africa - Market size and forecast 2024-2029 ($ billion)
        • Chart on Middle East and Africa - Year-over-year growth 2024-2029 (%)
        • Data Table on Middle East and Africa - Year-over-year growth 2024-2029 (%)
      • 12.6 North America - Market size and forecast 2024-2029
        • Chart on North America - Market size and forecast 2024-2029 ($ billion)
        • Data Table on North America - Market size and forecast 2024-2029 ($ billion)
        • Chart on North America - Year-over-year growth 2024-2029 (%)
        • Data Table on North America - Year-over-year growth 2024-2029 (%)
      • 12.7 South America - Market size and forecast 2024-2029
        • Chart on South America - Market size and forecast 2024-2029 ($ billion)
        • Data Table on South America - Market size and forecast 2024-2029 ($ billion)
        • Chart on South America - Year-over-year growth 2024-2029 (%)
        • Data Table on South America - Year-over-year growth 2024-2029 (%)
      • 12.8 China - Market size and forecast 2024-2029
        • Chart on China - Market size and forecast 2024-2029 ($ billion)
        • Data Table on China - Market size and forecast 2024-2029 ($ billion)
        • Chart on China - Year-over-year growth 2024-2029 (%)
        • Data Table on China - Year-over-year growth 2024-2029 (%)
      • 12.9 US - Market size and forecast 2024-2029
        • Chart on US - Market size and forecast 2024-2029 ($ billion)
        • Data Table on US - Market size and forecast 2024-2029 ($ billion)
        • Chart on US - Year-over-year growth 2024-2029 (%)
        • Data Table on US - Year-over-year growth 2024-2029 (%)
      • 12.10 Singapore - Market size and forecast 2024-2029
        • Chart on Singapore - Market size and forecast 2024-2029 ($ billion)
        • Data Table on Singapore - Market size and forecast 2024-2029 ($ billion)
        • Chart on Singapore - Year-over-year growth 2024-2029 (%)
        • Data Table on Singapore - Year-over-year growth 2024-2029 (%)
      • 12.11 Germany - Market size and forecast 2024-2029
        • Chart on Germany - Market size and forecast 2024-2029 ($ billion)
        • Data Table on Germany - Market size and forecast 2024-2029 ($ billion)
        • Chart on Germany - Year-over-year growth 2024-2029 (%)
        • Data Table on Germany - Year-over-year growth 2024-2029 (%)
      • 12.12 UK - Market size and forecast 2024-2029
        • Chart on UK - Market size and forecast 2024-2029 ($ billion)
        • Data Table on UK - Market size and forecast 2024-2029 ($ billion)
        • Chart on UK - Year-over-year growth 2024-2029 (%)
        • Data Table on UK - Year-over-year growth 2024-2029 (%)
      • 12.13 UAE - Market size and forecast 2024-2029
        • Chart on UAE - Market size and forecast 2024-2029 ($ billion)
        • Data Table on UAE - Market size and forecast 2024-2029 ($ billion)
        • Chart on UAE - Year-over-year growth 2024-2029 (%)
        • Data Table on UAE - Year-over-year growth 2024-2029 (%)
      • 12.14 The Netherlands - Market size and forecast 2024-2029
        • Chart on The Netherlands - Market size and forecast 2024-2029 ($ billion)
        • Data Table on The Netherlands - Market size and forecast 2024-2029 ($ billion)
        • Chart on The Netherlands - Year-over-year growth 2024-2029 (%)
        • Data Table on The Netherlands - Year-over-year growth 2024-2029 (%)
      • 12.15 Japan - Market size and forecast 2024-2029
        • Chart on Japan - Market size and forecast 2024-2029 ($ billion)
        • Data Table on Japan - Market size and forecast 2024-2029 ($ billion)
        • Chart on Japan - Year-over-year growth 2024-2029 (%)
        • Data Table on Japan - Year-over-year growth 2024-2029 (%)
      • 12.16 India - Market size and forecast 2024-2029
        • Chart on India - Market size and forecast 2024-2029 ($ billion)
        • Data Table on India - Market size and forecast 2024-2029 ($ billion)
        • Chart on India - Year-over-year growth 2024-2029 (%)
        • Data Table on India - Year-over-year growth 2024-2029 (%)
      • 12.17 France - Market size and forecast 2024-2029
        • Chart on France - Market size and forecast 2024-2029 ($ billion)
        • Data Table on France - Market size and forecast 2024-2029 ($ billion)
        • Chart on France - Year-over-year growth 2024-2029 (%)
        • Data Table on France - Year-over-year growth 2024-2029 (%)
      • 12.18 Market opportunity by geography
        • Market opportunity by geography ($ billion)
        • Data Tables on Market opportunity by geography ($ billion)

      13 Drivers, Challenges, and Opportunity/Restraints

      • 13.1 Market drivers
        • 13.2 Market challenges
          • 13.3 Impact of drivers and challenges
            • Impact of drivers and challenges in 2024 and 2029
          • 13.4 Market opportunities/restraints

            14 Competitive Landscape

            • 14.1 Overview
              • 14.2 Competitive Landscape
                • Overview on criticality of inputs and factors of differentiation
              • 14.3 Landscape disruption
                • Overview on factors of disruption
              • 14.4 Industry risks
                • Impact of key risks on business

              15 Competitive Analysis

              • 15.1 Companies profiled
                • Companies covered
              • 15.2 Company ranking index
                • Company ranking index
              • 15.3 Market positioning of companies
                • Matrix on companies position and classification
              • 15.4 BP Plc
                • BP Plc - Overview
                • BP Plc - Business segments
                • BP Plc - Key news
                • BP Plc - Key offerings
                • BP Plc - Segment focus
                • SWOT
              • 15.5 Chevron Corp.
                • Chevron Corp. - Overview
                • Chevron Corp. - Business segments
                • Chevron Corp. - Key news
                • Chevron Corp. - Key offerings
                • Chevron Corp. - Segment focus
                • SWOT
              • 15.6 Eni SpA
                • Eni SpA - Overview
                • Eni SpA - Business segments
                • Eni SpA - Key news
                • Eni SpA - Key offerings
                • Eni SpA - Segment focus
                • SWOT
              • 15.7 Exxon Mobil Corp.
                • Exxon Mobil Corp. - Overview
                • Exxon Mobil Corp. - Business segments
                • Exxon Mobil Corp. - Key news
                • Exxon Mobil Corp. - Key offerings
                • Exxon Mobil Corp. - Segment focus
                • SWOT
              • 15.8 Gulf Agency Co. Ltd.
                • Gulf Agency Co. Ltd. - Overview
                • Gulf Agency Co. Ltd. - Product / Service
                • Gulf Agency Co. Ltd. - Key offerings
                • SWOT
              • 15.9 Indian Oil Corp. Ltd.
                • Indian Oil Corp. Ltd. - Overview
                • Indian Oil Corp. Ltd. - Business segments
                • Indian Oil Corp. Ltd. - Key news
                • Indian Oil Corp. Ltd. - Key offerings
                • Indian Oil Corp. Ltd. - Segment focus
                • SWOT
              • 15.10 Marathon Petroleum Corp.
                • Marathon Petroleum Corp. - Overview
                • Marathon Petroleum Corp. - Business segments
                • Marathon Petroleum Corp. - Key offerings
                • Marathon Petroleum Corp. - Segment focus
                • SWOT
              • 15.11 Marquard and Bahls AG
                • Marquard and Bahls AG - Overview
                • Marquard and Bahls AG - Product / Service
                • Marquard and Bahls AG - Key offerings
                • SWOT
              • 15.12 Neste Corp.
                • Neste Corp. - Overview
                • Neste Corp. - Business segments
                • Neste Corp. - Key news
                • Neste Corp. - Key offerings
                • Neste Corp. - Segment focus
                • SWOT
              • 15.13 PETRONAS Chemicals Group Berhad
                • PETRONAS Chemicals Group Berhad - Overview
                • PETRONAS Chemicals Group Berhad - Business segments
                • PETRONAS Chemicals Group Berhad - Key offerings
                • PETRONAS Chemicals Group Berhad - Segment focus
                • SWOT
              • 15.14 PJSC LUKOIL
                • PJSC LUKOIL - Overview
                • PJSC LUKOIL - Product / Service
                • PJSC LUKOIL - Key offerings
                • SWOT
              • 15.15 Rosneft Oil Co.
                • Rosneft Oil Co. - Overview
                • Rosneft Oil Co. - Product / Service
                • Rosneft Oil Co. - Key offerings
                • SWOT
              • 15.16 Saudi Arabian Oil Co.
                • Saudi Arabian Oil Co. - Overview
                • Saudi Arabian Oil Co. - Product / Service
                • Saudi Arabian Oil Co. - Key offerings
                • SWOT
              • 15.17 Shell plc
                • Shell plc - Overview
                • Shell plc - Business segments
                • Shell plc - Key news
                • Shell plc - Key offerings
                • Shell plc - Segment focus
                • SWOT
              • 15.18 TotalEnergies SE
                • TotalEnergies SE - Overview
                • TotalEnergies SE - Business segments
                • TotalEnergies SE - Key news
                • TotalEnergies SE - Key offerings
                • TotalEnergies SE - Segment focus
                • SWOT

              16 Appendix

              • 16.1 Scope of the report
                • 16.2 Inclusions and exclusions checklist
                  • Inclusions checklist
                  • Exclusions checklist
                • 16.3 Currency conversion rates for US$
                  • Currency conversion rates for US$
                • 16.4 Research methodology
                  • Research methodology
                • 16.5 Data procurement
                  • Information sources
                • 16.6 Data validation
                  • Data validation
                • 16.7 Validation techniques employed for market sizing
                  • Validation techniques employed for market sizing
                • 16.8 Data synthesis
                  • Data synthesis
                • 16.9 360 degree market analysis
                  • 360 degree market analysis
                • 16.10 List of abbreviations
                  • List of abbreviations

                Research Methodology

                Technavio presents a detailed picture of the market by way of study, synthesis, and summation of data from multiple sources. The analysts have presented the various facets of the market with a particular focus on identifying the key industry influencers. The data thus presented is comprehensive, reliable, and the result of extensive research, both primary and secondary.

                INFORMATION SOURCES

                Primary sources

                • Manufacturers and suppliers
                • Channel partners
                • Industry experts
                • Strategic decision makers

                Secondary sources

                • Industry journals and periodicals
                • Government data
                • Financial reports of key industry players
                • Historical data
                • Press releases

                DATA ANALYSIS

                Data Synthesis

                • Collation of data
                • Estimation of key figures
                • Analysis of derived insights

                Data Validation

                • Triangulation with data models
                • Reference against proprietary databases
                • Corroboration with industry experts

                REPORT WRITING

                Qualitative

                • Market drivers
                • Market challenges
                • Market trends
                • Five forces analysis

                Quantitative

                • Market size and forecast
                • Market segmentation
                • Geographical insights
                • Competitive landscape

                Interested in this report?

                Get your sample now to see our research methodology and insights!

                Download Now

                Frequently Asked Questions

                Bunker Fuel market growth will increase by $ 33.8 bn during 2025-2029.

                The Bunker Fuel market is expected to grow at a CAGR of 4.5% during 2025-2029.

                Bunker Fuel market is segmented by Type( MGO, HSFO, VLSFO) Application( Container, Bulk carrier, Oil tanker, General cargo, Chemical tanker) Distribution Channel( IOC/NOC, Large independent distributor, Small independent distributor, North America, South America)

                BP Plc, Chevron Corp., Eni SpA, Exxon Mobil Corp., Gulf Agency Co. Ltd., Indian Oil Corp. Ltd., Marathon Petroleum Corp., Marquard and Bahls AG, Neste Corp., PETRONAS Chemicals Group Berhad, PJSC LUKOIL, Rosneft Oil Co., Saudi Arabian Oil Co., Shell plc, TotalEnergies SE are a few of the key vendors in the Bunker Fuel market.

                APAC will register the highest growth rate of 37% among the other regions. Therefore, the Bunker Fuel market in APAC is expected to garner significant business opportunities for the vendors during the forecast period.

                US, China, Singapore, Germany, UK, UAE, The Netherlands, Japan, France, India

                • Increasing naval expenditureIn the current scenario is the driving factor this market.
                • the external threats that any country faces pertain to security issues. These external threats may be another country is the driving factor this market.
                • a terrorist organization is the driving factor this market.
                • or an individual. To combat this is the driving factor this market.
                • governments in various countries are increasing their spending to raise the defense capacities of their countries. As a crucial part of the armed forces is the driving factor this market.
                • overall naval spending has also witnessed a significant increase. The global military expenditure is likely to increase during the forecast period. In 2024 is the driving factor this market.
                • the US topped the list of the largest defense-spending nations globally with $997 billion is the driving factor this market.
                • followed by China and India is the driving factor this market.
                • with $314 and $86.1 billion is the driving factor this market.
                • respectively. In addition is the driving factor this market.
                • certain countries such as Indonesia and South Korea have also increased their military spending substantially over the past few years. Most of the naval ships perform patrolling operations around the globe apart from their littoral zones; they are also conducting joint naval exercises as well as rescue operations in times of natural calamities. The increase in naval spending is the driving factor this market.
                • as well as operational activities is the driving factor this market.
                • will boost the growth of the global bunker fuel market during the forecast period. is the driving factor this market.

                The Bunker Fuel market vendors should focus on grabbing business opportunities from the MGO segment as it accounted for the largest market share in the base year.