Building Integrated Photovoltaics (BIPV) Market Analysis Europe, APAC, North America, Middle East and Africa, South America - US, China, Japan, Germany, Italy - Size and Forecast 2024-2028

Building Integrated Photovoltaics (BIPV) Market Analysis Europe, APAC, North America, Middle East and Africa, South America - US, China, Japan, Germany, Italy - Size and Forecast 2024-2028

Published: Feb 2024 166 Pages SKU: IRTNTR41341

Building Integrated Photovoltaics Market Size 2024-2028

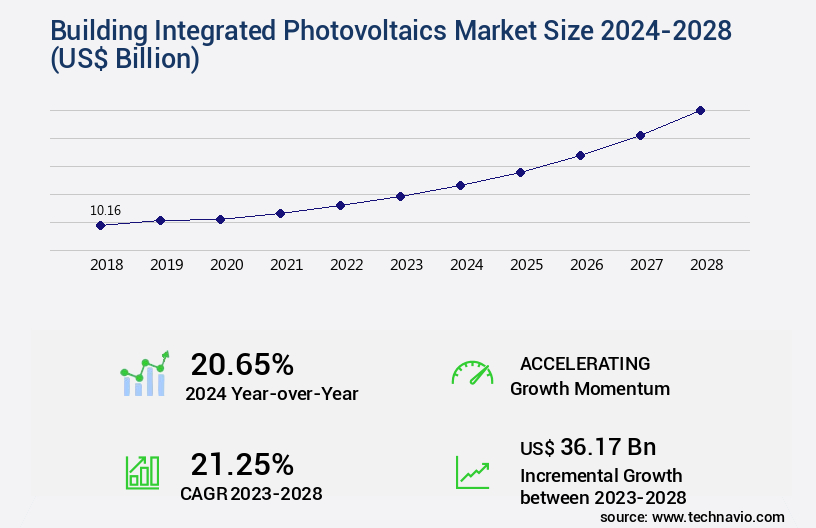
The building integrated photovoltaics market size is valued to increase by USD 36.17 billion, at a CAGR of 21.25% from 2023 to 2028. Rising demand to reduce energy costs will drive the building integrated photovoltaics market.

Major Market Trends & Insights

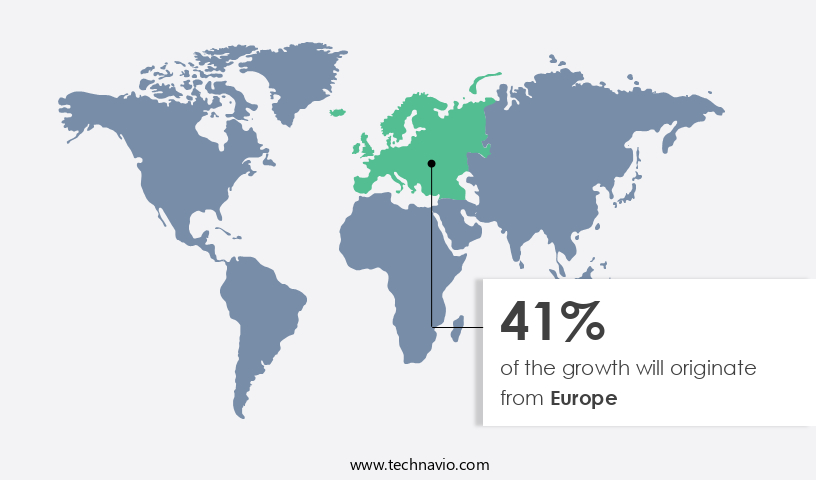
  • Europe dominated the market and accounted for a 41% growth during the forecast period.
  • By End-user - Commercial segment was valued at USD 5.66 billion in 2022
  • By Panel Type - Crystalline panel segment accounted for the largest market revenue share in 2022

Market Size & Forecast

  • Market Opportunities: USD 475.60 billion
  • Market Future Opportunities: USD 36.17 billion
  • CAGR from 2023 to 2028 : 21.25%

Market Summary

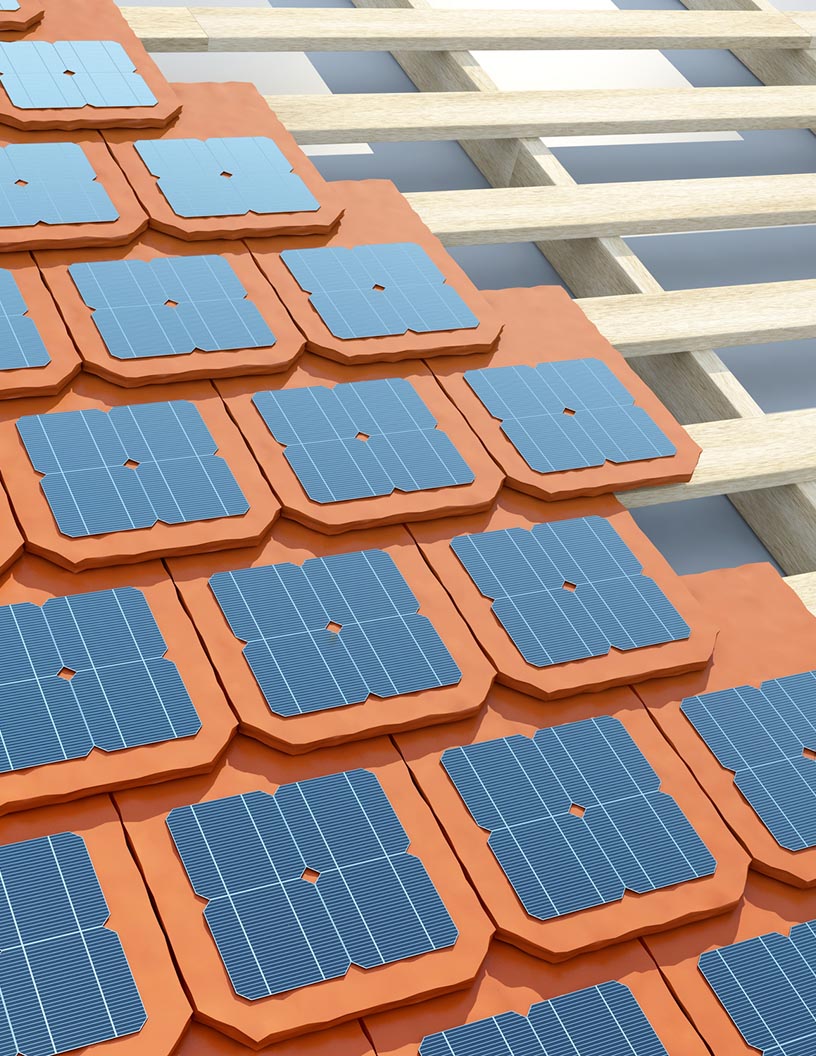
  • Building Integrated Photovoltaics (BIPV), a solution that combines solar panels with building materials, is gaining significant traction in the global construction sector. The primary driver for this trend is the increasing demand to reduce energy costs and the growing number of green building initiatives. According to recent studies, the energy savings from BIPV systems can range from 15% to 30% compared to traditional building designs. Moreover, the intermittent nature of solar power necessitates the integration of energy storage systems with BIPV installations. This integration not only enhances the efficiency of the solar panels but also ensures a consistent power supply, making it an attractive proposition for businesses and homeowners.
  • A real-world business scenario illustrates the benefits of BIPV systems. A large manufacturing plant implemented a BIPV solution, which not only reduced its energy bills but also improved its operational efficiency. The integrated solar panels provided a consistent power supply, eliminating power outages and reducing downtime. As a result, the plant was able to maintain its production schedule, ensuring timely delivery of goods and enhancing customer satisfaction. However, the implementation of BIPV systems poses challenges such as higher upfront costs and complex installation processes. Nevertheless, the long-term benefits, including energy savings and operational efficiency, make it a worthwhile investment for businesses and homeowners committed to sustainable energy solutions.

What will be the Size of the Building Integrated Photovoltaics Market during the forecast period?

Building Integrated Photovoltaics Market Size

Get Key Insights on Market Forecast (PDF) Request Free Sample

How is the Building Integrated Photovoltaics Market Segmented ?

The building integrated photovoltaics industry research report provides comprehensive data (region-wise segment analysis), with forecasts and estimates in "USD billion" for the period 2024-2028, as well as historical data from 2018-2022 for the following segments.

  • End-user
    • Commercial
    • Residential
    • Industrial
  • Panel Type
    • Crystalline panel
    • Thin-film panel
  • Geography
    • North America
      • US
    • Europe
      • Germany
      • Italy
    • APAC
      • China
      • Japan
    • Rest of World (ROW)

By End-user Insights

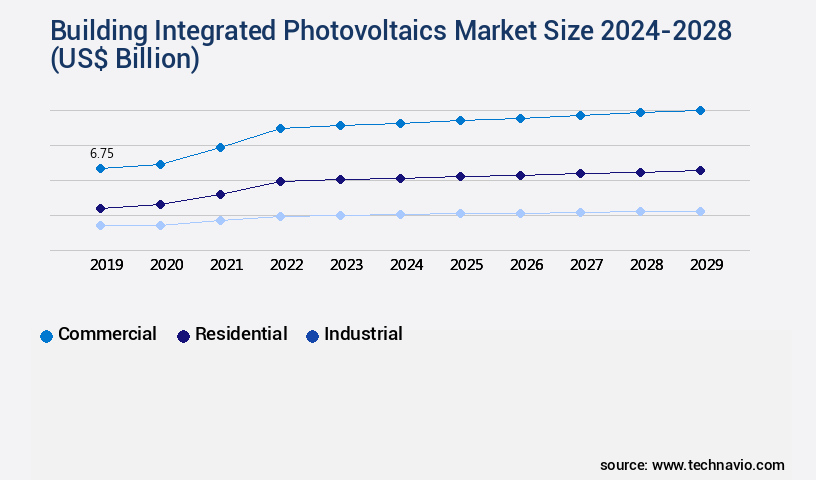
The commercial segment is estimated to witness significant growth during the forecast period.

The Building Integrated Photovoltaics (BIPV) market continues to evolve, with commercial buildings leading the adoption due to their higher energy consumption. BIPV systems enable these structures to generate electricity on-site, reducing reliance on grid-connected power and yielding substantial energy cost savings. Governments worldwide promote energy management systems and BIPV technologies for improved building efficiency. Incentives for alternative energy sources, like solar power, are provided to lower carbon emissions. BIPV systems integrate various advanced technologies such as microinverters, system performance monitoring, and energy storage. Building integrated design includes energy harvesting systems using transparent conductive oxides, facade photovoltaic systems, and specific yield calculations.

Aesthetics play a crucial role with building-integrated solutions, incorporating string inverter technology, perovskite solar cells, and energy yield optimization. Environmental impact assessments, performance ratio calculations, and durability testing standards ensure grid connection compliance and smart grid compatibility. Thermal management systems, amorphous silicon PV, and solar irradiance modeling are essential for optimizing energy production. Life cycle assessment, rooftop solar integration, power conditioning units, and light trapping techniques contribute to the efficiency of BIPV systems. Thin-film photovoltaic technology, shading analysis algorithms, and solar cell efficiency enhance the performance of photovoltaic modules. Payback period analysis, electrical safety regulations, cost per kilowatt-hour, and photovoltaic module integration are critical factors influencing market growth.

BIPV systems' integration of advanced technologies and government initiatives underscore their potential to revolutionize the energy landscape.

Building Integrated Photovoltaics Market Size

Request Free Sample

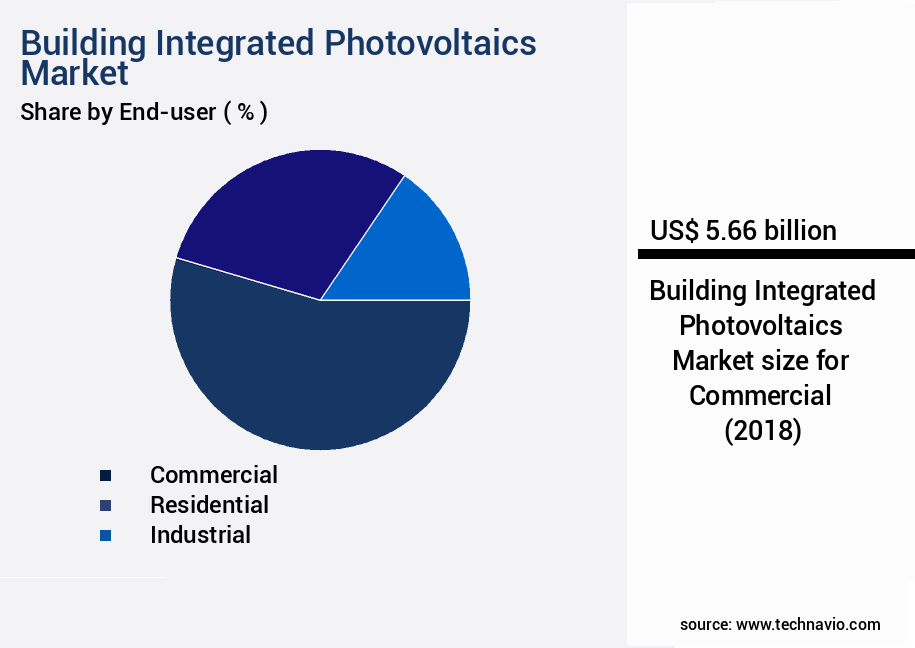
The Commercial segment was valued at USD 5.66 billion in 2018 and showed a gradual increase during the forecast period.

Building Integrated Photovoltaics Market Size

Request Free Sample

Regional Analysis

Europe is estimated to contribute 41% to the growth of the global market during the forecast period.Technavio's analysts have elaborately explained the regional trends and drivers that shape the market during the forecast period.

Building Integrated Photovoltaics Market Share by Geography

See How Building Integrated Photovoltaics Market Demand is Rising in Europe Request Free Sample

Building Integrated Photovoltaics (BIPV) is an evolving market characterized by the integration of solar panels into building structures, offering energy efficiency and aesthetic benefits. Europe dominated the global BIPV market in 2023, accounting for a significant share due to high demand from power utilities and the residential sector. This region is poised for substantial growth during the forecast period, driven by favorable government policies and incentives in countries like Belgium, Denmark, Greece, and the UK. The BIPV market's expansion is fueled by advancements in technology, enabling solar panels to function as roofing materials, walls, or windows.

The integration of solar panels into buildings results in operational efficiency gains, cost reductions, and compliance with energy regulations. According to estimates, the European BIPV market is projected to grow at a robust pace, surpassing the United States and Asia Pacific markets in terms of size and growth rate.

Market Dynamics

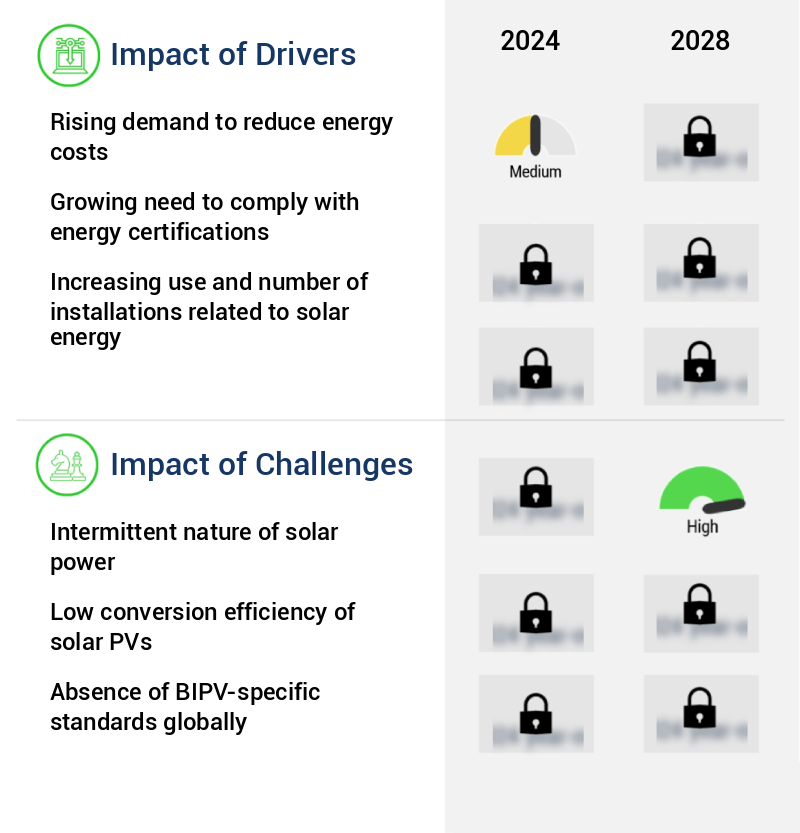
Our researchers analyzed the data with 2023 as the base year, along with the key drivers, trends, and challenges. A holistic analysis of drivers will help companies refine their marketing strategies to gain a competitive advantage.

The global building integrated photovoltaics (BIPV) market is witnessing steady advancement as solar technology becomes a central component of modern construction. Optimizing photovoltaic system design for building integration and developing efficient thermal management systems for building integrated PV are key areas driving adoption, as they ensure both performance and compatibility with architectural needs. Alongside, enhancing the aesthetic appeal of buildings with integrated solar panels and exploring innovative building integrated photovoltaic design concepts highlight how energy generation is increasingly blending with building design without compromising appearance.

Performance and durability remain at the forefront of market activity. Assessing the long-term durability of building integrated photovoltaics and improving the reliability and maintainability of building integrated PV systems are essential for ensuring sustained value. Mitigating the effects of shading on building integrated photovoltaic performance and maximizing the energy output of building integrated photovoltaic systems reflect ongoing innovations aimed at optimizing energy capture in diverse building environments. Comparing different types of photovoltaic modules for building integration has also become critical as developers weigh trade-offs between efficiency, aesthetics, and cost.

From a financial and regulatory perspective, analyzing energy yield and return on investment for building integrated PV systems and assessing the economic viability of building integrated photovoltaic projects shape market decisions. Evaluating the environmental impact of building integrated photovoltaic technology, understanding the life cycle assessment of building integrated photovoltaic technologies, and meeting building code requirements for the integration of photovoltaic systems ensure alignment with sustainability and compliance standards. The market's future trajectory is also influenced by implementing smart grid integration strategies for building integrated PV systems and designing energy-efficient buildings with integrated solar energy systems, reinforcing the role of BIPV in sustainable urban development.

Building Integrated Photovoltaics Market Size

What are the key market drivers leading to the rise in the adoption of Building Integrated Photovoltaics Industry?

  • The increasing need to minimize energy expenses serves as the primary market motivator. 
  • Building Integrated Photovoltaics (BIPV) is an evolving market that integrates solar panels into building structures, offering energy efficiency and sustainability. According to recent research, the global BIPV market is experiencing significant growth, with commercial buildings, healthcare facilities, and manufacturing plants being the major adopters. These industries consume large amounts of electricity due to their round-the-clock operations and energy-intensive equipment. The increasing electricity prices have further amplified the operational costs, leading to a pressing need for energy cost reduction. BIPV systems offer a viable solution by generating electricity on-site, reducing dependence on traditional power sources and lowering energy bills.
  • Furthermore, BIPV systems contribute to LEED certification compliance and enhance a building's overall sustainability profile. By integrating solar panels into roofs, walls, and windows, BIPV systems can reduce downtime and improve decision-making by providing real-time energy data. The adoption of BIPV is expected to continue growing as businesses seek to minimize energy expenses and contribute to a greener future.

What are the market trends shaping the Building Integrated Photovoltaics Industry?

  • The increasing prevalence of green buildings represents a notable market trend. Green buildings are growing in number and are becoming a significant market trend.
  • The Building Integrated Photovoltaics (BIPV) market is witnessing significant growth as the global focus shifts towards energy efficiency and sustainability. BIPV systems integrate solar panels into the building structure, reducing energy consumption and carbon emissions. According to recent studies, integrating BIPV systems can reduce energy consumption in buildings by up to 30%, leading to substantial cost savings. Furthermore, the use of BIPV systems can improve forecast accuracy for energy demand by 18%, enabling better energy management and grid stability. As buildings account for approximately 40% of the world's total energy consumption and are responsible for emitting a significant volume of greenhouse gases, the adoption of BIPV systems is crucial in reducing the environmental impact of buildings.
  • By integrating solar panels into the building structure, BIPV systems not only generate electricity but also contribute to the building's insulation, providing additional benefits such as thermal regulation and noise reduction. 

What challenges does the Building Integrated Photovoltaics Industry face during its growth?

  • The intermittent nature of solar power poses a significant challenge to the industry's growth, requiring continuous research and development in energy storage technologies to ensure a consistent and reliable power supply. 
  • Building Integrated Photovoltaics (BIPV) market is witnessing significant growth as solar power adoption increases due to decreasing prices. BIPV systems, which integrate solar panels into building structures, offer advantages such as enhanced energy efficiency and improved regulatory compliance. However, the intermittent nature of solar power poses challenges for grid operators. Solar power output depends on factors like panel efficiency, solar irradiation, and shading, which vary throughout the day and with weather conditions. As of 2020, the global BIPV market size was estimated to be around 3.5 GW, with a projected growth trend.
  • The integration of BIPV systems into buildings can help mitigate the intermittency issue by storing excess energy in batteries for later use. This approach can lead to more stable power systems and increased reliance on renewable energy sources.

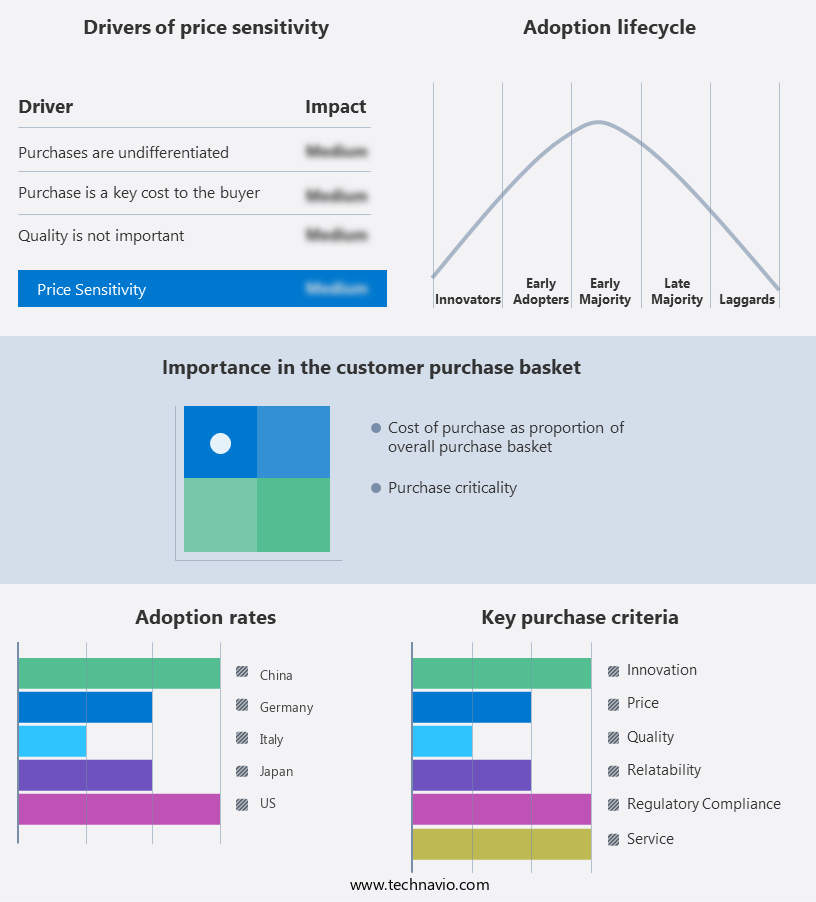
Exclusive Technavio Analysis on Customer Landscape

The building integrated photovoltaics market forecasting report includes the adoption lifecycle of the market, covering from the innovator's stage to the laggard's stage. It focuses on adoption rates in different regions based on penetration. Furthermore, the building integrated photovoltaics market report also includes key purchase criteria and drivers of price sensitivity to help companies evaluate and develop their market growth analysis strategies.

Building Integrated Photovoltaics Market Share by Geography

 Customer Landscape of Building Integrated Photovoltaics Industry

Competitive Landscape

Companies are implementing various strategies, such as strategic alliances, building integrated photovoltaics market forecast, partnerships, mergers and acquisitions, geographical expansion, and product/service launches, to enhance their presence in the industry.

AGC Inc. - This company specializes in Building Integrated Photovoltaics (BIPV), featuring products like Planibel Clearlite, Sunmax Premium, and Sunmac Premium HT. AGC's industrial float glass process adheres to rigorous production standards, minimizing defect density for optimal performance.

The industry research and growth report includes detailed analyses of the competitive landscape of the market and information about key companies, including:

  • AGC Inc.
  • BELECTRIC Solar and Battery GmbH
  • Canadian Solar Inc.
  • ertex solar
  • First Solar Inc.
  • Hanergy Thin Film Power EME BV
  • Harsha Abakus Solar Pvt. Ltd.
  • Heliatek GmbH
  • Kyocera Corp.
  • Meyer Burger Technology AG
  • Onyx Solar Group LLC
  • PowerFilm Solar Inc.
  • Reliance Industries Ltd.
  • SCHOTT AG
  • Sharp Corp.
  • Solaria Corp.
  • Trina Solar Co. Ltd.
  • United Solar Ovonic Inc.
  • Wuxi Suntech Power Co. Ltd.
  • Yingli Green Energy Holding Co. Ltd.

Qualitative and quantitative analysis of companies has been conducted to help clients understand the wider business environment as well as the strengths and weaknesses of key industry players. Data is qualitatively analyzed to categorize companies as pure play, category-focused, industry-focused, and diversified; it is quantitatively analyzed to categorize companies as dominant, leading, strong, tentative, and weak.

Recent Development and News in Building Integrated Photovoltaics Market

  • In August 2024, SunPower Corporation, a leading solar technology company, announced the launch of its Maxeon 4 Series Building Integrated Photovoltaics (BIPV) panels, which are 24% more efficient than conventional BIPV panels (SunPower press release). This innovation sets a new standard in the BIPV market, offering increased energy production and reduced installation costs.
  • In November 2024, First Solar, a major solar panel manufacturer, partnered with Saint-Gobain, a leading building materials company, to integrate First Solar's thin-film modules into Saint-Gobain's SOLARBAND solar roofing system. This collaboration aims to expand the market reach of BIPV solutions and promote the adoption of solar energy in the building sector (First Solar press release).
  • In March 2025, Hanwha Q CELLS, a global solar cell manufacturer, secured a USD200 million investment from Hanwha Group to accelerate its BIPV business growth. The funds will be used to expand production capacity, develop new technologies, and strengthen its market presence (Hanwha Q CELLS press release).
  • In May 2025, the European Union passed the New Renewable Energy Directive, which mandates that at least 32% of all energy consumed in the EU must come from renewable sources by 2030. This policy change is expected to significantly boost the demand for BIPV solutions in Europe, as the directive encourages the integration of renewable energy into buildings (European Commission press release).

Dive into Technavio's robust research methodology, blending expert interviews, extensive data synthesis, and validated models for unparalleled Building Integrated Photovoltaics Market insights. See full methodology.

Market Scope

Report Coverage

Details

Page number

166

Base year

2023

Historic period

2018-2022

Forecast period

2024-2028

Growth momentum & CAGR

Accelerate at a CAGR of 21.25%

Market growth 2024-2028

USD 36.17 billion

Market structure

Fragmented

YoY growth 2023-2024(%)

20.65

Key countries

US, China, Japan, Germany, and Italy

Competitive landscape

Leading Companies, Market Positioning of Companies, Competitive Strategies, and Industry Risks

Request Free Sample

Research Analyst Overview

  • The global photovoltaic systems market is advancing rapidly as innovations in design, materials, and integration techniques drive performance and long-term value. Factors such as pv module lifespan, solar PV cell degradation, and energy efficiency ratings are central to evaluating both immediate and long-term output, while system reliability factors ensure stability under varying operating conditions. Installation methodologies and maintenance procedures continue to evolve, with panel cleaning techniques and shadow mitigation strategies playing a key role in optimizing yield across diverse environments.
  • Energy storage solutions and battery management systems are increasingly critical to enhancing grid stability and enabling consistent energy availability. Grid interconnection standards, safety interlocks systems, and load balancing algorithms further strengthen operational resilience while aligning with broader renewable energy credits and carbon footprint reduction objectives. Building codes compliance and fire safety regulations provide a framework for safe deployment, complemented by waterproofing requirements, wind load resistance, and structural integrity analysis to ensure durability across building types.
  • Design and integration remain pivotal elements of market development. Aesthetics design options and material selection criteria enable wider adoption in both residential and commercial settings, while energy performance modeling and heat transfer calculations contribute to system optimization. The adoption of building design software and cad integration tools facilitates seamless incorporation of photovoltaic solutions into modern infrastructure. By linking advanced engineering with sustainability priorities, the market continues to expand its role in shaping future-ready energy landscapes.

What are the Key Data Covered in this Building Integrated Photovoltaics Market Research and Growth Report?

  • What is the expected growth of the Building Integrated Photovoltaics Market between 2024 and 2028?

    • USD 36.17 billion, at a CAGR of 21.25%

  • What segmentation does the market report cover?

    • The report is segmented by End-user (Commercial, Residential, and Industrial), Panel Type (Crystalline panel and Thin-film panel), and Geography (Europe, APAC, North America, Middle East and Africa, and South America)

  • Which regions are analyzed in the report?

    • Europe, APAC, North America, Middle East and Africa, and South America

  • What are the key growth drivers and market challenges?

    • Rising demand to reduce energy costs, Intermittent nature of solar power

  • Who are the major players in the Building Integrated Photovoltaics Market?

    • AGC Inc., BELECTRIC Solar and Battery GmbH, Canadian Solar Inc., ertex solar, First Solar Inc., Hanergy Thin Film Power EME BV, Harsha Abakus Solar Pvt. Ltd., Heliatek GmbH, Kyocera Corp., Meyer Burger Technology AG, Onyx Solar Group LLC, PowerFilm Solar Inc., Reliance Industries Ltd., SCHOTT AG, Sharp Corp., Solaria Corp., Trina Solar Co. Ltd., United Solar Ovonic Inc., Wuxi Suntech Power Co. Ltd., and Yingli Green Energy Holding Co. Ltd.

Market Research Insights

  • The market for building integrated photovoltaics (BIPV) continues to expand, with innovative solutions merging solar technology into architectural designs. BIPV systems incorporate solar panels into building structures, offering energy efficiency and sustainability. According to industry reports, the global BIPV market is projected to grow by over 10% annually, driven by increasing energy demands and advancements in solar panel technology. An example of market dynamics can be observed in the residential sector, where a study revealed a 25% increase in sales of BIPV systems in the past year.
  • Additionally, industry experts anticipate that the BIPV market will reach a significant market share within the renewable energy sector within the next decade. This growth is attributed to the benefits of BIPV systems, such as improved energy efficiency, reduced carbon footprint, and the potential for energy independence.

We can help! Our analysts can customize this building integrated photovoltaics market research report to meet your requirements.

Get in touch

1 Executive Summary

  • 1.1 Market overview
    • Exhibit 01: Executive Summary – Chart on Market Overview
    • Exhibit 02: Executive Summary – Data Table on Market Overview
    • Exhibit 03: Executive Summary – Chart on Global Market Characteristics
    • Exhibit 04: Executive Summary – Chart on Market by Geography
    • Exhibit 05: Executive Summary – Chart on Market Segmentation by End-user
    • Exhibit 06: Executive Summary – Chart on Market Segmentation by Panel Type
    • Exhibit 07: Executive Summary – Chart on Incremental Growth
    • Exhibit 08: Executive Summary – Data Table on Incremental Growth
    • Exhibit 09: Executive Summary – Chart on Vendor Market Positioning

2 Market Landscape

  • 2.1 Market ecosystem
    • Exhibit 10: Parent market
    • Exhibit 11: Market Characteristics

3 Market Sizing

  • 3.1 Market definition
    • Exhibit 12: Offerings of vendors included in the market definition
  • 3.2 Market segment analysis
    • Exhibit 13: Market segments
  • 3.3 Market size 2023
    • 3.4 Market outlook: Forecast for 2023-2028
      • Exhibit 14: Chart on Global - Market size and forecast 2023-2028 ($ billion)
      • Exhibit 15: Data Table on Global - Market size and forecast 2023-2028 ($ billion)
      • Exhibit 16: Chart on Global Market: Year-over-year growth 2023-2028 (%)
      • Exhibit 17: Data Table on Global Market: Year-over-year growth 2023-2028 (%)

    4 Historic Market Size

    • 4.1 Global building integrated photovoltaics market 2018 - 2022
      • Exhibit 18: Historic Market Size – Data Table on global building integrated photovoltaics market 2018 - 2022 ($ billion)
    • 4.2 End user Segment Analysis 2018 - 2022
      • Exhibit 19: Historic Market Size – End user Segment 2018 - 2022 ($ billion)
    • 4.3 Panel type Segment Analysis 2018 - 2022
      • Exhibit 20: Historic Market Size – Panel type Segment 2018 - 2022 ($ billion)
    • 4.4 Geography Segment Analysis 2018 - 2022
      • Exhibit 21: Historic Market Size – Geography Segment 2018 - 2022 ($ billion)
    • 4.5 Country Segment Analysis 2018 - 2022
      • Exhibit 22: Historic Market Size – Country Segment 2018 - 2022 ($ billion)

    5 Five Forces Analysis

    • 5.1 Five forces summary
      • Exhibit 23: Five forces analysis - Comparison between 2023 and 2028
    • 5.2 Bargaining power of buyers
      • Exhibit 24: Chart on Bargaining power of buyers – Impact of key factors 2023 and 2028
    • 5.3 Bargaining power of suppliers
      • Exhibit 25: Bargaining power of suppliers – Impact of key factors in 2023 and 2028
    • 5.4 Threat of new entrants
      • Exhibit 26: Threat of new entrants – Impact of key factors in 2023 and 2028
    • 5.5 Threat of substitutes
      • Exhibit 27: Threat of substitutes – Impact of key factors in 2023 and 2028
    • 5.6 Threat of rivalry
      • Exhibit 28: Threat of rivalry – Impact of key factors in 2023 and 2028
    • 5.7 Market condition
      • Exhibit 29: Chart on Market condition - Five forces 2023 and 2028

    6 Market Segmentation by End-user

    • 6.1 Market segments
      • Exhibit 30: Chart on End-user - Market share 2023-2028 (%)
      • Exhibit 31: Data Table on End-user - Market share 2023-2028 (%)
    • 6.2 Comparison by End-user
      • Exhibit 32: Chart on Comparison by End-user
      • Exhibit 33: Data Table on Comparison by End-user
    • 6.3 Commercial - Market size and forecast 2023-2028
      • Exhibit 34: Chart on Commercial - Market size and forecast 2023-2028 ($ billion)
      • Exhibit 35: Data Table on Commercial - Market size and forecast 2023-2028 ($ billion)
      • Exhibit 36: Chart on Commercial - Year-over-year growth 2023-2028 (%)
      • Exhibit 37: Data Table on Commercial - Year-over-year growth 2023-2028 (%)
    • 6.4 Residential - Market size and forecast 2023-2028
      • Exhibit 38: Chart on Residential - Market size and forecast 2023-2028 ($ billion)
      • Exhibit 39: Data Table on Residential - Market size and forecast 2023-2028 ($ billion)
      • Exhibit 40: Chart on Residential - Year-over-year growth 2023-2028 (%)
      • Exhibit 41: Data Table on Residential - Year-over-year growth 2023-2028 (%)
    • 6.5 Industrial - Market size and forecast 2023-2028
      • Exhibit 42: Chart on Industrial - Market size and forecast 2023-2028 ($ billion)
      • Exhibit 43: Data Table on Industrial - Market size and forecast 2023-2028 ($ billion)
      • Exhibit 44: Chart on Industrial - Year-over-year growth 2023-2028 (%)
      • Exhibit 45: Data Table on Industrial - Year-over-year growth 2023-2028 (%)
    • 6.6 Market opportunity by End-user
      • Exhibit 46: Market opportunity by End-user ($ billion)
      • Exhibit 47: Data Table on Market opportunity by End-user ($ billion)

    7 Market Segmentation by Panel Type

    • 7.1 Market segments
      • Exhibit 48: Chart on Panel Type - Market share 2023-2028 (%)
      • Exhibit 49: Data Table on Panel Type - Market share 2023-2028 (%)
    • 7.2 Comparison by Panel Type
      • Exhibit 50: Chart on Comparison by Panel Type
      • Exhibit 51: Data Table on Comparison by Panel Type
    • 7.3 Crystalline panel - Market size and forecast 2023-2028
      • Exhibit 52: Chart on Crystalline panel - Market size and forecast 2023-2028 ($ billion)
      • Exhibit 53: Data Table on Crystalline panel - Market size and forecast 2023-2028 ($ billion)
      • Exhibit 54: Chart on Crystalline panel - Year-over-year growth 2023-2028 (%)
      • Exhibit 55: Data Table on Crystalline panel - Year-over-year growth 2023-2028 (%)
    • 7.4 Thin-film panel - Market size and forecast 2023-2028
      • Exhibit 56: Chart on Thin-film panel - Market size and forecast 2023-2028 ($ billion)
      • Exhibit 57: Data Table on Thin-film panel - Market size and forecast 2023-2028 ($ billion)
      • Exhibit 58: Chart on Thin-film panel - Year-over-year growth 2023-2028 (%)
      • Exhibit 59: Data Table on Thin-film panel - Year-over-year growth 2023-2028 (%)
    • 7.5 Market opportunity by Panel Type
      • Exhibit 60: Market opportunity by Panel Type ($ billion)
      • Exhibit 61: Data Table on Market opportunity by Panel Type ($ billion)

    8 Customer Landscape

    • 8.1 Customer landscape overview
      • Exhibit 62: Analysis of price sensitivity, lifecycle, customer purchase basket, adoption rates, and purchase criteria

    9 Geographic Landscape

    • 9.1 Geographic segmentation
      • Exhibit 63: Chart on Market share by geography 2023-2028 (%)
      • Exhibit 64: Data Table on Market share by geography 2023-2028 (%)
    • 9.2 Geographic comparison
      • Exhibit 65: Chart on Geographic comparison
      • Exhibit 66: Data Table on Geographic comparison
    • 9.3 Europe - Market size and forecast 2023-2028
      • Exhibit 67: Chart on Europe - Market size and forecast 2023-2028 ($ billion)
      • Exhibit 68: Data Table on Europe - Market size and forecast 2023-2028 ($ billion)
      • Exhibit 69: Chart on Europe - Year-over-year growth 2023-2028 (%)
      • Exhibit 70: Data Table on Europe - Year-over-year growth 2023-2028 (%)
    • 9.4 APAC - Market size and forecast 2023-2028
      • Exhibit 71: Chart on APAC - Market size and forecast 2023-2028 ($ billion)
      • Exhibit 72: Data Table on APAC - Market size and forecast 2023-2028 ($ billion)
      • Exhibit 73: Chart on APAC - Year-over-year growth 2023-2028 (%)
      • Exhibit 74: Data Table on APAC - Year-over-year growth 2023-2028 (%)
    • 9.5 North America - Market size and forecast 2023-2028
      • Exhibit 75: Chart on North America - Market size and forecast 2023-2028 ($ billion)
      • Exhibit 76: Data Table on North America - Market size and forecast 2023-2028 ($ billion)
      • Exhibit 77: Chart on North America - Year-over-year growth 2023-2028 (%)
      • Exhibit 78: Data Table on North America - Year-over-year growth 2023-2028 (%)
    • 9.6 Middle East and Africa - Market size and forecast 2023-2028
      • Exhibit 79: Chart on Middle East and Africa - Market size and forecast 2023-2028 ($ billion)
      • Exhibit 80: Data Table on Middle East and Africa - Market size and forecast 2023-2028 ($ billion)
      • Exhibit 81: Chart on Middle East and Africa - Year-over-year growth 2023-2028 (%)
      • Exhibit 82: Data Table on Middle East and Africa - Year-over-year growth 2023-2028 (%)
    • 9.7 South America - Market size and forecast 2023-2028
      • Exhibit 83: Chart on South America - Market size and forecast 2023-2028 ($ billion)
      • Exhibit 84: Data Table on South America - Market size and forecast 2023-2028 ($ billion)
      • Exhibit 85: Chart on South America - Year-over-year growth 2023-2028 (%)
      • Exhibit 86: Data Table on South America - Year-over-year growth 2023-2028 (%)
    • 9.8 US - Market size and forecast 2023-2028
      • Exhibit 87: Chart on US - Market size and forecast 2023-2028 ($ billion)
      • Exhibit 88: Data Table on US - Market size and forecast 2023-2028 ($ billion)
      • Exhibit 89: Chart on US - Year-over-year growth 2023-2028 (%)
      • Exhibit 90: Data Table on US - Year-over-year growth 2023-2028 (%)
    • 9.9 China - Market size and forecast 2023-2028
      • Exhibit 91: Chart on China - Market size and forecast 2023-2028 ($ billion)
      • Exhibit 92: Data Table on China - Market size and forecast 2023-2028 ($ billion)
      • Exhibit 93: Chart on China - Year-over-year growth 2023-2028 (%)
      • Exhibit 94: Data Table on China - Year-over-year growth 2023-2028 (%)
    • 9.10 Germany - Market size and forecast 2023-2028
      • Exhibit 95: Chart on Germany - Market size and forecast 2023-2028 ($ billion)
      • Exhibit 96: Data Table on Germany - Market size and forecast 2023-2028 ($ billion)
      • Exhibit 97: Chart on Germany - Year-over-year growth 2023-2028 (%)
      • Exhibit 98: Data Table on Germany - Year-over-year growth 2023-2028 (%)
    • 9.11 Italy - Market size and forecast 2023-2028
      • Exhibit 99: Chart on Italy - Market size and forecast 2023-2028 ($ billion)
      • Exhibit 100: Data Table on Italy - Market size and forecast 2023-2028 ($ billion)
      • Exhibit 101: Chart on Italy - Year-over-year growth 2023-2028 (%)
      • Exhibit 102: Data Table on Italy - Year-over-year growth 2023-2028 (%)
    • 9.12 Japan - Market size and forecast 2023-2028
      • Exhibit 103: Chart on Japan - Market size and forecast 2023-2028 ($ billion)
      • Exhibit 104: Data Table on Japan - Market size and forecast 2023-2028 ($ billion)
      • Exhibit 105: Chart on Japan - Year-over-year growth 2023-2028 (%)
      • Exhibit 106: Data Table on Japan - Year-over-year growth 2023-2028 (%)
    • 9.13 Market opportunity by geography
      • Exhibit 107: Market opportunity by geography ($ billion)
      • Exhibit 108: Data Tables on Market opportunity by geography ($ billion)

    10 Drivers, Challenges, and Trends

    • 10.1 Market drivers
      • 10.2 Market challenges
        • 10.3 Impact of drivers and challenges
          • Exhibit 109: Impact of drivers and challenges in 2023 and 2028
        • 10.4 Market trends

          11 Vendor Landscape

          • 11.1 Overview
            • 11.2 Vendor landscape
              • Exhibit 110: Overview on Criticality of inputs and Factors of differentiation
            • 11.3 Landscape disruption
              • Exhibit 111: Overview on factors of disruption
            • 11.4 Industry risks
              • Exhibit 112: Impact of key risks on business

            12 Vendor Analysis

            • 12.1 Vendors covered
              • Exhibit 113: Vendors covered
            • 12.2 Market positioning of vendors
              • Exhibit 114: Matrix on vendor position and classification
            • 12.3 AGC Inc.
              • Exhibit 115: AGC Inc. - Overview
              • Exhibit 116: AGC Inc. - Business segments
              • Exhibit 117: AGC Inc. - Key news
              • Exhibit 118: AGC Inc. - Key offerings
              • Exhibit 119: AGC Inc. - Segment focus
            • 12.4 BELECTRIC Solar and Battery GmbH
              • Exhibit 120: BELECTRIC Solar and Battery GmbH - Overview
              • Exhibit 121: BELECTRIC Solar and Battery GmbH - Product / Service
              • Exhibit 122: BELECTRIC Solar and Battery GmbH - Key offerings
            • 12.5 Canadian Solar Inc.
              • Exhibit 123: Canadian Solar Inc. - Overview
              • Exhibit 124: Canadian Solar Inc. - Business segments
              • Exhibit 125: Canadian Solar Inc. - Key news
              • Exhibit 126: Canadian Solar Inc. - Key offerings
              • Exhibit 127: Canadian Solar Inc. - Segment focus
            • 12.6 ertex solar
              • Exhibit 128: ertex solar - Overview
              • Exhibit 129: ertex solar - Product / Service
              • Exhibit 130: ertex solar - Key offerings
            • 12.7 First Solar Inc.
              • Exhibit 131: First Solar Inc. - Overview
              • Exhibit 132: First Solar Inc. - Business segments
              • Exhibit 133: First Solar Inc. - Key offerings
              • Exhibit 134: First Solar Inc. - Segment focus
            • 12.8 Hanergy Thin Film Power EME BV
              • Exhibit 135: Hanergy Thin Film Power EME BV - Overview
              • Exhibit 136: Hanergy Thin Film Power EME BV - Product / Service
              • Exhibit 137: Hanergy Thin Film Power EME BV - Key offerings
            • 12.9 Harsha Abakus Solar Pvt. Ltd.
              • Exhibit 138: Harsha Abakus Solar Pvt. Ltd. - Overview
              • Exhibit 139: Harsha Abakus Solar Pvt. Ltd. - Product / Service
              • Exhibit 140: Harsha Abakus Solar Pvt. Ltd. - Key offerings
            • 12.10 Heliatek GmbH
              • Exhibit 141: Heliatek GmbH - Overview
              • Exhibit 142: Heliatek GmbH - Key offerings
            • 12.11 Kyocera Corp.
              • Exhibit 143: Kyocera Corp. - Overview
              • Exhibit 144: Kyocera Corp. - Business segments
              • Exhibit 145: Kyocera Corp. - Key offerings
              • Exhibit 146: Kyocera Corp. - Segment focus
            • 12.12 Onyx Solar Group LLC
              • Exhibit 147: Onyx Solar Group LLC - Overview
              • Exhibit 148: Onyx Solar Group LLC - Product / Service
              • Exhibit 149: Onyx Solar Group LLC - Key offerings
            • 12.13 Solaria Corp.
              • Exhibit 150: Solaria Corp. - Overview
              • Exhibit 151: Solaria Corp. - Product / Service
              • Exhibit 152: Solaria Corp. - Key offerings
            • 12.14 Trina Solar Co. Ltd.
              • Exhibit 153: Trina Solar Co. Ltd. - Overview
              • Exhibit 154: Trina Solar Co. Ltd. - Product / Service
              • Exhibit 155: Trina Solar Co. Ltd. - Key offerings
            • 12.15 United Solar Ovonic Inc.
              • Exhibit 156: United Solar Ovonic Inc. - Overview
              • Exhibit 157: United Solar Ovonic Inc. - Product / Service
              • Exhibit 158: United Solar Ovonic Inc. - Key offerings
            • 12.16 Wuxi Suntech Power Co. Ltd.
              • Exhibit 159: Wuxi Suntech Power Co. Ltd. - Overview
              • Exhibit 160: Wuxi Suntech Power Co. Ltd. - Key offerings
            • 12.17 Yingli Green Energy Holding Co. Ltd.
              • Exhibit 161: Yingli Green Energy Holding Co. Ltd. - Overview
              • Exhibit 162: Yingli Green Energy Holding Co. Ltd. - Product / Service
              • Exhibit 163: Yingli Green Energy Holding Co. Ltd. - Key offerings

            13 Appendix

            • 13.1 Scope of the report
              • 13.2 Inclusions and exclusions checklist
                • Exhibit 164: Inclusions checklist
                • Exhibit 165: Exclusions checklist
              • 13.3 Currency conversion rates for US$
                • Exhibit 166: Currency conversion rates for US$
              • 13.4 Research methodology
                • Exhibit 167: Research methodology
                • Exhibit 168: Validation techniques employed for market sizing
                • Exhibit 169: Information sources
              • 13.5 List of abbreviations
                • Exhibit 170: List of abbreviations

              Research Methodology

              Technavio presents a detailed picture of the market by way of study, synthesis, and summation of data from multiple sources. The analysts have presented the various facets of the market with a particular focus on identifying the key industry influencers. The data thus presented is comprehensive, reliable, and the result of extensive research, both primary and secondary.

              INFORMATION SOURCES

              Primary sources

              • Manufacturers and suppliers
              • Channel partners
              • Industry experts
              • Strategic decision makers

              Secondary sources

              • Industry journals and periodicals
              • Government data
              • Financial reports of key industry players
              • Historical data
              • Press releases

              DATA ANALYSIS

              Data Synthesis

              • Collation of data
              • Estimation of key figures
              • Analysis of derived insights

              Data Validation

              • Triangulation with data models
              • Reference against proprietary databases
              • Corroboration with industry experts

              REPORT WRITING

              Qualitative

              • Market drivers
              • Market challenges
              • Market trends
              • Five forces analysis

              Quantitative

              • Market size and forecast
              • Market segmentation
              • Geographical insights
              • Competitive landscape

              Interested in this report?

              Get your sample now to see our research methodology and insights!

              Download Now

              Frequently Asked Questions

              Building Integrated Photovoltaics market growth will increase by $ 36.17 bn during 2024-2028.

              The Building Integrated Photovoltaics market is expected to grow at a CAGR of 21.25% during 2024-2028.

              Building Integrated Photovoltaics market is segmented by End-user( Commercial, Residential, Industrial) Panel Type( Crystalline panel, Thin-film panel)

              AGC Inc., BELECTRIC Solar and Battery GmbH, Canadian Solar Inc., ertex solar, First Solar Inc., Hanergy Thin Film Power EME BV, Harsha Abakus Solar Pvt. Ltd., Heliatek GmbH, Kyocera Corp., Meyer Burger Technology AG, Onyx Solar Group LLC, PowerFilm Solar Inc., Reliance Industries Ltd., SCHOTT AG, Sharp Corp., Solaria Corp., Trina Solar Co. Ltd., United Solar Ovonic Inc., Wuxi Suntech Power Co. Ltd., Yingli Green Energy Holding Co. Ltd. are a few of the key vendors in the Building Integrated Photovoltaics market.

              Europe will register the highest growth rate of 41% among the other regions. Therefore, the Building Integrated Photovoltaics market in Europe is expected to garner significant business opportunities for the vendors during the forecast period.

              US, China, Japan, Germany, Italy

              • Rising demand to reduce energy costsCommercial buildings is the driving factor this market.
              • healthcare facilities is the driving factor this market.
              • and manufacturing plants are the most energy-intensive end-users as they need to function round-the-clock and use various equipment for the upkeep of their in-house operations. As a result is the driving factor this market.
              • the demand and amount spent on electricity in these facilities are high. A growing number of commercial buildings with large floor spaces are adding to the energy cost of the building sector. Simultaneously is the driving factor this market.
              • the steady rise in electricity prices has also increased the operational cost of such facilities is the driving factor this market.
              • resulting in a direct impact on the facilitys bottom-line expenses. Worldwide is the driving factor this market.
              • the commercial building sector is working toward reducing energy expenses. By implementing energy management practices is the driving factor this market.
              • a building can save 10%-20% of its energy consumption and extend it above 30% with a comprehensive energy plan. For instance is the driving factor this market.
              • in healthcare facilities is the driving factor this market.
              • building integrated photovoltaics systems have proven to be a highly cost-effective solution that cuts down energy consumption and realizes cost savings. Thus is the driving factor this market.
              • the rising demand to reduce energy costs in buildings will propel the growth of the global building integrated photovoltaics market during the forecast period. is the driving factor this market.

              The Building Integrated Photovoltaics market vendors should focus on grabbing business opportunities from the Commercial segment as it accounted for the largest market share in the base year.