
Broadcasting Cable TV Market Size 2026-2030
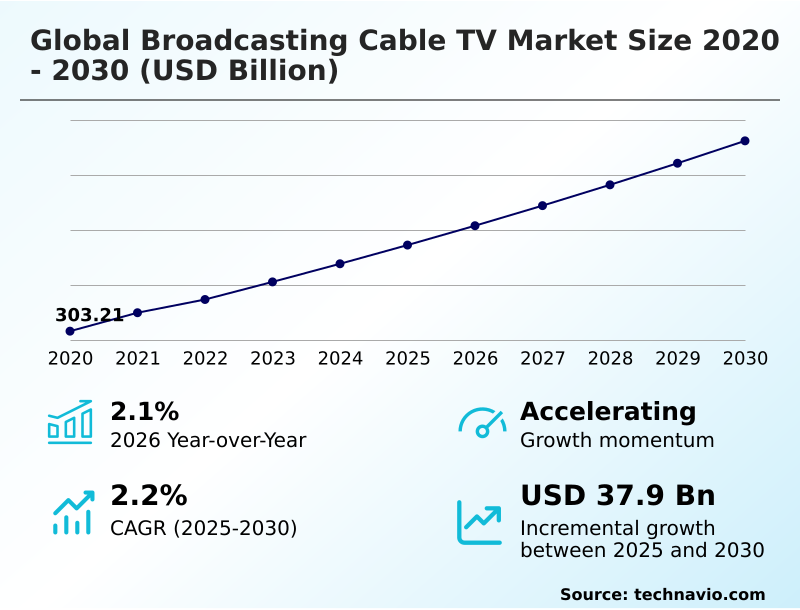
The broadcasting cable tv market size is valued to increase by USD 37.90 billion, at a CAGR of 2.2% from 2025 to 2030. Strategic aggregation of premium direct to consumer streaming platforms will drive the broadcasting cable tv market.
Major Market Trends & Insights
- APAC dominated the market and accounted for a 41.1% growth during the forecast period.
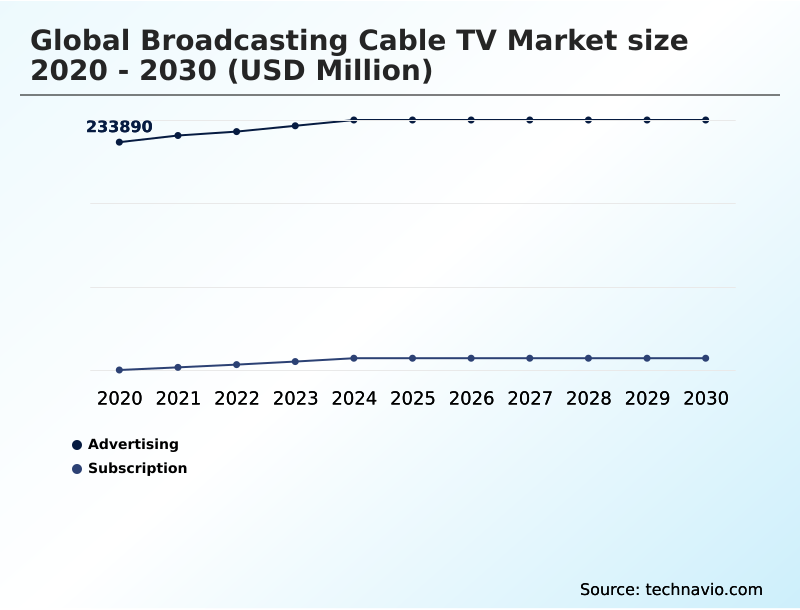
- By Revenue Stream - Advertising segment was valued at USD 249.89 billion in 2024
- By Application - Satellite TV segment accounted for the largest market revenue share in 2024
Market Size & Forecast
- Market Opportunities: USD 69.21 billion
- Market Future Opportunities: USD 37.90 billion
- CAGR from 2025 to 2030 : 2.2%
Market Summary
- The broadcasting cable tv market is navigating a period of significant transformation, driven by the shift in consumer behavior from traditional linear viewing to on-demand streaming. Key industry trends include the evolution of cable providers into centralized entertainment hubs, aggregating multiple over-the-top streaming services into a single interface to combat subscription fatigue.
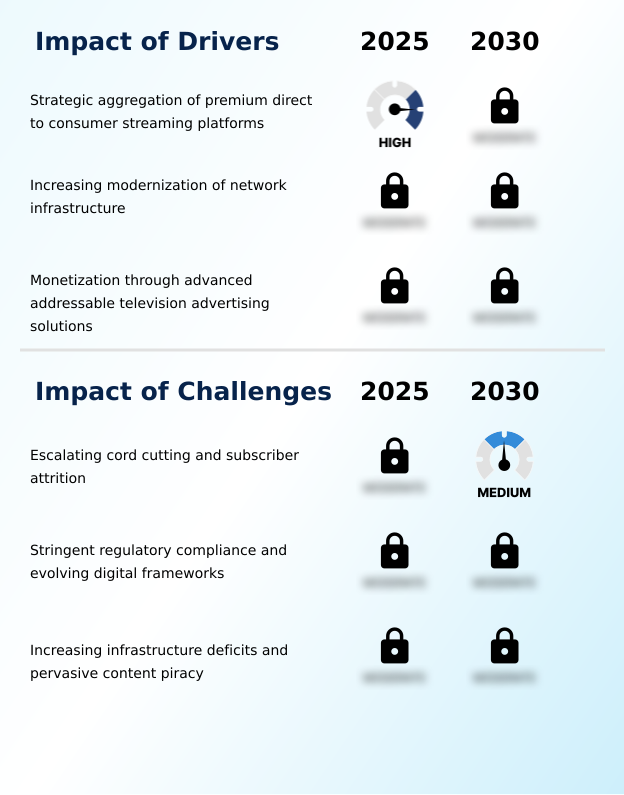
- This strategy is enabled by advanced broadcast technologies and content discovery algorithms that enhance the user experience. A primary driver is the modernization of network infrastructure, including the rollout of fiber optic cables to support high-speed broadband and ultra high definition content. However, the industry faces the persistent challenge of subscriber attrition due to the cord cutting phenomenon.
- In a typical business scenario, a provider leverages audience analytics to create flexible, genre-based packages, bundling high-margin internet services with curated content to increase customer lifetime value and reduce churn. This approach helps stabilize revenue streams in an increasingly fragmented media landscape.
What will be the Size of the Broadcasting Cable TV Market during the forecast period?
Get Key Insights on Market Forecast (PDF) Request Free Sample
How is the Broadcasting Cable TV Market Segmented?
The broadcasting cable tv industry research report provides comprehensive data (region-wise segment analysis), with forecasts and estimates in "USD million" for the period 2026-2030, as well as historical data from 2020-2024 for the following segments.
- Revenue stream
- Advertising
- Subscription
- Application
- Satellite TV
- Cable TV
- Internet Protocol TV (IPTV)
- Others
- Service
- Entertainment
- News and sports
- Educational and documentary
- Geography
- North America
- US
- Canada
- Mexico
- APAC
- China
- Japan
- India
- Europe
- UK
- France
- Germany
- South America
- Brazil
- Argentina
- Colombia
- Middle East and Africa
- Saudi Arabia
- UAE
- South Africa
- Rest of World (ROW)
- North America
By Revenue Stream Insights
The advertising segment is estimated to witness significant growth during the forecast period.
The advertising segment of the global broadcasting cable tv market 2026-2030 is adapting to new media consumption patterns.
Traditional revenue from linear television is now supplemented by programmatic ad buying and addressable television, which allows for household-level targeting and improves ad relevance by up to 15%.
This shift requires significant investment in audience analytics and cross platform advertising measurement. Broadcasters are creating unified purchasing platforms that combine digital advertising inventories with traditional spots.
This strategy aims to capture spending from brands seeking measurable returns across both on demand content and scheduled broadcast network programming, utilizing advanced data from set top boxes and viewer engagement metrics to optimize campaigns and prove their effectiveness within the evolving cable television ecosystem.
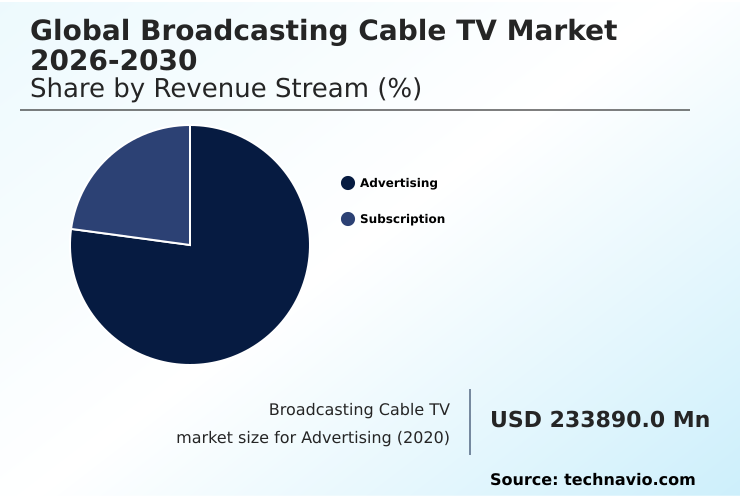
The Advertising segment was valued at USD 249.89 billion in 2024 and showed a gradual increase during the forecast period.
Regional Analysis
APAC is estimated to contribute 41.1% to the growth of the global market during the forecast period.Technavio’s analysts have elaborately explained the regional trends and drivers that shape the market during the forecast period.

See How Broadcasting Cable TV Market Demand is Rising in APAC Request Free Sample
The geographic landscape of the global broadcasting cable tv market 2026-2030 reveals distinct regional dynamics.
In North America, the focus is on network modernization efforts and managing subscriber attrition, with operators investing heavily in the data over cable service interface specification.
Conversely, the market in APAC is set for higher growth, outpacing North America by approximately 1.2 percentage points, driven by expanding telecommunications infrastructure and rising disposable incomes in countries like India and China.
Europe is witnessing a rapid transition toward hybrid viewing models that blend linear television with on-demand content.
Across all regions, the deployment of fiber optic cables and advanced broadcast technologies is a shared priority, crucial for delivering high-speed broadband and supporting the integration of premium digital streaming and regional television services, which improves service reliability by over 25% in upgraded areas.
Market Dynamics
Our researchers analyzed the data with 2025 as the base year, along with the key drivers, trends, and challenges. A holistic analysis of drivers will help companies refine their marketing strategies to gain a competitive advantage.
- Navigating the future of the broadcasting cable tv industry requires a deep understanding of its core strategic questions. The broadcasting cable tv market segmentation reveals a pivot toward high-value services, while broadcasting cable tv industry trends point toward aggregation and enhanced user experience.
- Key broadcasting cable tv market drivers, such as the demand for high-speed connectivity, are countered by broadcasting cable tv market challenges like the persistent impact of cord cutting on cable tv. A critical area of focus is the deployment of addressable tv advertising solutions to create new revenue.
- The satellite tv vs iptv comparison is increasingly relevant as operators weigh infrastructure costs against delivery quality. Discussions about the future of linear television broadcasting are central to long-term strategy, especially considering the 5g impact on media consumption. The role of ai in content discovery is no longer theoretical, becoming a key differentiator.
- To combat subscriber attrition in cable television, effective cable tv bundling strategies are essential. Evaluating the evolution of set top box technology and managing fiber optic network deployment costs are key operational hurdles.
- Finally, ensuring regulatory compliance in digital broadcasting, optimizing the monetization of on-demand content, and measuring cross-platform advertising effectiveness are vital for profitability, especially when considering the ongoing challenges of content piracy and reducing geostationary satellite operational costs.
What are the key market drivers leading to the rise in the adoption of Broadcasting Cable TV Industry?
- The strategic aggregation of premium direct-to-consumer streaming platforms is a key driver for the market.
- A primary driver for the global broadcasting cable tv market 2026-2030 is the strategic aggregation of premium digital streaming platforms. By integrating popular subscription video on demand services directly into their linear channel packages, cable operators mitigate the cord-cutting phenomenon.
- This approach simplifies the consumer experience, offering a single point of access and billing for disparate media sources. For streaming partners, it lowers customer acquisition costs by up to 30%.
- For cable providers, these comprehensive bundles, which often include high-speed broadband and other residential cable operations, increase subscriber stickiness and reduce attrition rates by a notable 12%.
- This media aggregation strategy transforms the traditional set-top box into a powerful content hub, leveraging existing telecommunications infrastructure to deliver enhanced value.
What are the market trends shaping the Broadcasting Cable TV Industry?
- A key market trend is the evolution of cable services into centralized home entertainment hubs. This transition integrates various digital services into a single, user-friendly platform.
- The evolution toward centralized entertainment hubs is a defining trend, reshaping the global broadcasting cable tv market 2026-2030. Cable operators are transitioning from mere content distributors to sophisticated aggregators, integrating over-the-top streaming services and ad-supported streaming television into a single platform. This strategy, which can increase customer retention by 10%, relies on advanced user interfaces and AI-powered content discovery algorithms.
- The goal is to provide a unified billing process and seamless navigation via voice-activated remote controls. This shift is supported by cloud-based software platforms and an ongoing push for non-video connectivity services.
- By creating these integrated ecosystems, providers address subscription fatigue and re-establish their role as the primary gateway to household entertainment, improving user satisfaction scores by an average of 18%.
What challenges does the Broadcasting Cable TV Industry face during its growth?
- Escalating cord cutting and subscriber attrition present a key challenge to industry growth.
- A significant challenge confronting the global broadcasting cable tv market 2026-2030 is subscriber attrition, driven by the consumer shift to fixed wireless access and standalone digital streaming platforms. This trend erodes traditional revenue from linear television and puts pressure on high-margin internet services.
- The proliferation of over-the-air signals and alternative video content distribution methods has intensified competition, forcing operators to innovate or risk further market share loss, with some facing churn rates as high as 5% per quarter. To counteract this, companies are exploring flexible, genre-based packages and investing in local broadcast operations to differentiate their offerings.
- However, managing the high costs of content carriage agreements while subscriber numbers decline remains a critical operational and financial challenge within the industry.
Exclusive Technavio Analysis on Customer Landscape
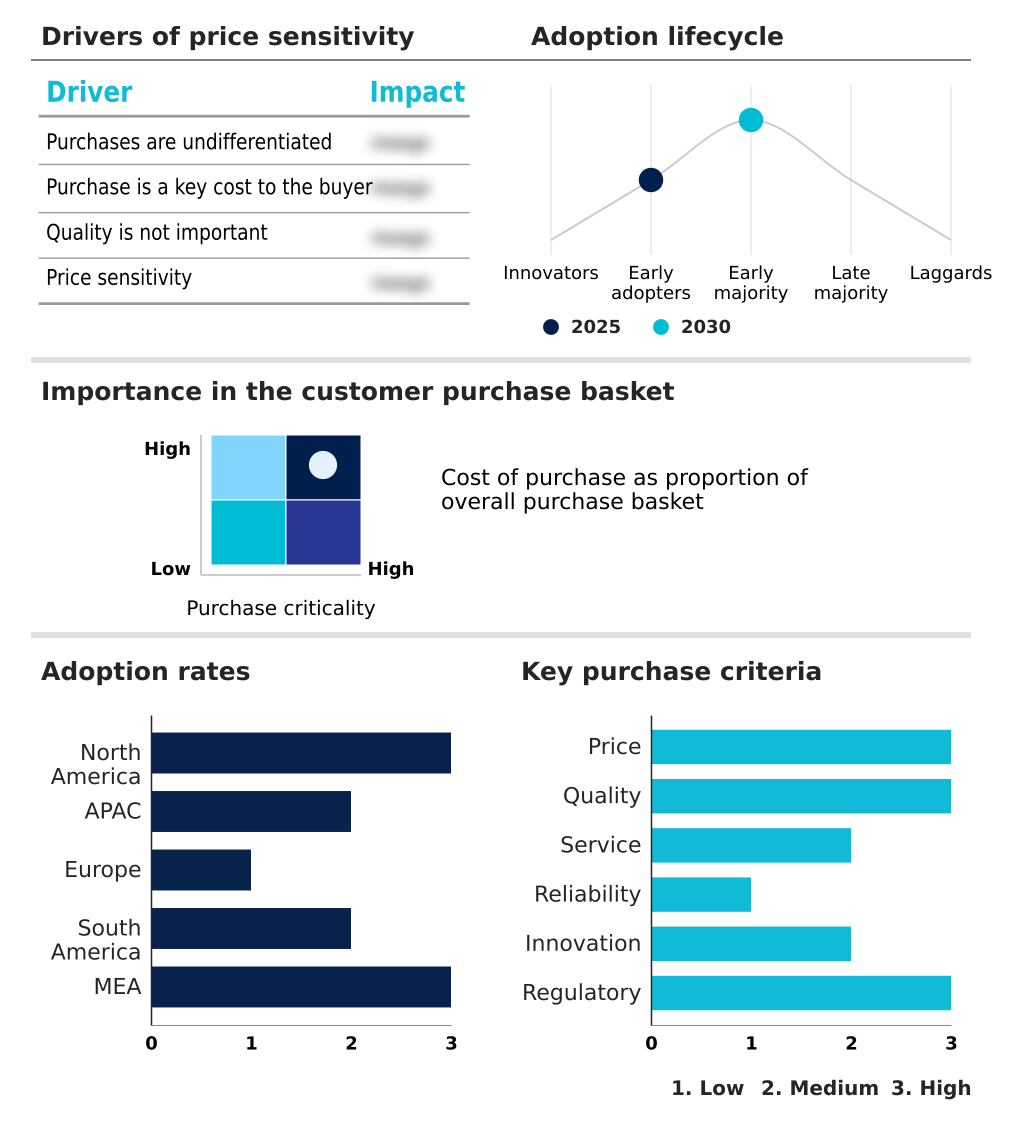
The broadcasting cable tv market forecasting report includes the adoption lifecycle of the market, covering from the innovator’s stage to the laggard’s stage. It focuses on adoption rates in different regions based on penetration. Furthermore, the broadcasting cable tv market report also includes key purchase criteria and drivers of price sensitivity to help companies evaluate and develop their market growth analysis strategies.
Customer Landscape of Broadcasting Cable TV Industry
Competitive Landscape
Companies are implementing various strategies, such as strategic alliances, broadcasting cable tv market forecast, partnerships, mergers and acquisitions, geographical expansion, and product/service launches, to enhance their presence in the industry.
AT and T Inc. - Delivers a diverse range of broadcasting and cable television services, including digital, streaming, and on-demand content accessible through integrated platforms.
The industry research and growth report includes detailed analyses of the competitive landscape of the market and information about key companies, including:
- AT and T Inc.
- Breezeline
- Charter Communications Inc.
- Comcast Corp.
- Cox Communications Inc.
- DIRECTV LLC
- DISH Network LLC
- Fox Corp.
- Google LLC
- Gray Television Inc.
- KT Corp.
- Mediacom Communications Corp.
- RTL Group SA
- SES SA
- Sparklight
- Tokyo Broadcasting System Inc.
- Verizon Communications Inc.
- Warner Bros. Discovery Inc.
- Zee Entertainment Ltd.
Qualitative and quantitative analysis of companies has been conducted to help clients understand the wider business environment as well as the strengths and weaknesses of key industry players. Data is qualitatively analyzed to categorize companies as pure play, category-focused, industry-focused, and diversified; it is quantitatively analyzed to categorize companies as dominant, leading, strong, tentative, and weak.
Recent Development and News in Broadcasting cable tv market
- In May, 2025, Charter Communications announced its intention to merge with Cox Communications to consolidate commercial fiber networks and enhance residential broadband and video delivery capabilities.
- In May, 2025, Fox Corporation unveiled its television schedule for the upcoming broadcast season, introducing new scripted dramas and expanding its unscripted competition series portfolio to strengthen viewer retention.
- In April, 2025, Comcast Advertising launched a new Media Solutions team to unify its multiscreen television advertising offerings, officially retiring the Effectv brand name.
- In April, 2025, Fox Entertainment secured a four-season renewal agreement with Disney Television Studios, ensuring the continued broadcast of several prominent animated comedy series on its network.
Dive into Technavio’s robust research methodology, blending expert interviews, extensive data synthesis, and validated models for unparalleled Broadcasting Cable TV Market insights. See full methodology.
| Market Scope | |
|---|---|
| Page number | 289 |
| Base year | 2025 |
| Historic period | 2020-2024 |
| Forecast period | 2026-2030 |
| Growth momentum & CAGR | Accelerate at a CAGR of 2.2% |
| Market growth 2026-2030 | USD 37899.9 million |
| Market structure | Fragmented |
| YoY growth 2025-2026(%) | 2.1% |
| Key countries | US, Canada, Mexico, China, Japan, India, South Korea, Australia, Indonesia, UK, France, Germany, Italy, Spain, The Netherlands, Brazil, Argentina, Colombia, Saudi Arabia, UAE, South Africa, Egypt and Nigeria |
| Competitive landscape | Leading Companies, Market Positioning of Companies, Competitive Strategies, and Industry Risks |
Research Analyst Overview
- The broadcasting cable tv market is undergoing a fundamental restructuring, moving beyond legacy video distribution toward integrated connectivity and entertainment. This evolution is defined by investments in next-generation infrastructure, including the deployment of fiber-optic cables and upgrades to the data over cable service interface specification to deliver ultra-high-definition content and high-speed broadband.
- A critical boardroom decision involves balancing CAPEX for these network modernization efforts against maintaining existing coaxial cable networks, a choice that directly impacts service quality and long-term competitiveness. For instance, prioritizing fiber expansion can reduce network latency by 40%, a key performance indicator.
- The market is also characterized by the adoption of hybrid viewing models, blending linear television with on-demand content and subscription video on demand. Operators are leveraging audience analytics and cloud digital video recording to personalize offerings and improve viewer retention.
- Success depends on effectively managing content carriage agreements and utilizing advanced technologies like satellite broadcasting and addressable television to create new revenue streams amid the shift to direct-to-consumer streaming.
What are the Key Data Covered in this Broadcasting Cable TV Market Research and Growth Report?
-
What is the expected growth of the Broadcasting Cable TV Market between 2026 and 2030?
-
USD 37.90 billion, at a CAGR of 2.2%
-
-
What segmentation does the market report cover?
-
The report is segmented by Revenue Stream (Advertising, and Subscription), Application (Satellite TV, Cable TV, Internet Protocol TV (IPTV), and Others), Service (Entertainment, News and sports, and Educational and documentary) and Geography (North America, APAC, Europe, South America, Middle East and Africa)
-
-
Which regions are analyzed in the report?
-
North America, APAC, Europe, South America and Middle East and Africa
-
-
What are the key growth drivers and market challenges?
-
Strategic aggregation of premium direct to consumer streaming platforms, Escalating cord cutting and subscriber attrition
-
-
Who are the major players in the Broadcasting Cable TV Market?
-
AT and T Inc., Breezeline, Charter Communications Inc., Comcast Corp., Cox Communications Inc., DIRECTV LLC, DISH Network LLC, Fox Corp., Google LLC, Gray Television Inc., KT Corp., Mediacom Communications Corp., RTL Group SA, SES SA, Sparklight, Tokyo Broadcasting System Inc., Verizon Communications Inc., Warner Bros. Discovery Inc. and Zee Entertainment Ltd.
-
Market Research Insights
- The dynamics of the global broadcasting cable tv market 2026-2030 are shaped by the strategic response to digital disruption. Providers are creating centralized entertainment hubs, which has been shown to reduce subscriber churn by 8% annually when bundled with high-margin internet services.
- The adoption of advanced user interfaces and content discovery algorithms is critical, as a seamless experience can increase viewer engagement metrics by over 20%. Furthermore, the move toward unified purchasing platforms for advertising allows for cross-platform measurement, with early data indicating that integrated campaigns improve return on ad spend by at least 15% compared to siloed media buys.
- These shifts highlight a pivot from simple content distribution to sophisticated management of the entire cable television ecosystem, focusing on value-added, non-video connectivity services to secure long-term viability.
We can help! Our analysts can customize this broadcasting cable tv market research report to meet your requirements.
 RIA -
RIA - 
