Boric Acid Market Analysis, Size, and Forecast 2026-2030: APAC (China, Japan, and India), North America (US, Canada, and Mexico), Europe (Germany, UK, and France), South America (Brazil, Argentina, and Colombia), Middle East and Africa (Saudi Arabia, UAE, and South Africa), and Rest of World (ROW)

Boric Acid Market Analysis, Size, and Forecast 2026-2030:
APAC (China, Japan, and India), North America (US, Canada, and Mexico), Europe (Germany, UK, and France), South America (Brazil, Argentina, and Colombia), Middle East and Africa (Saudi Arabia, UAE, and South Africa), and Rest of World (ROW)

Published: Jan 2026 291 Pages SKU: IRTNTR44247

Market Overview at a Glance

$417.5 Mn
Market Opportunity
7.6%
CAGR 2025 - 2030
55.3%
APAC Growth
$601.9 Mn
Glass and ceramics segment 2024

Boric Acid Market Size 2026-2030

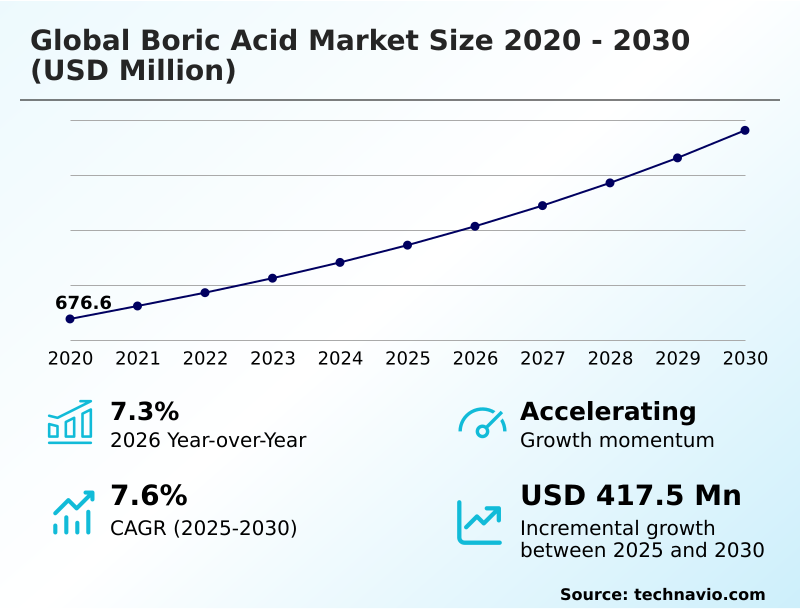
The boric acid market size is valued to increase by USD 417.5 million, at a CAGR of 7.6% from 2025 to 2030. Increase in demand from developing countries will drive the boric acid market.

Major Market Trends & Insights

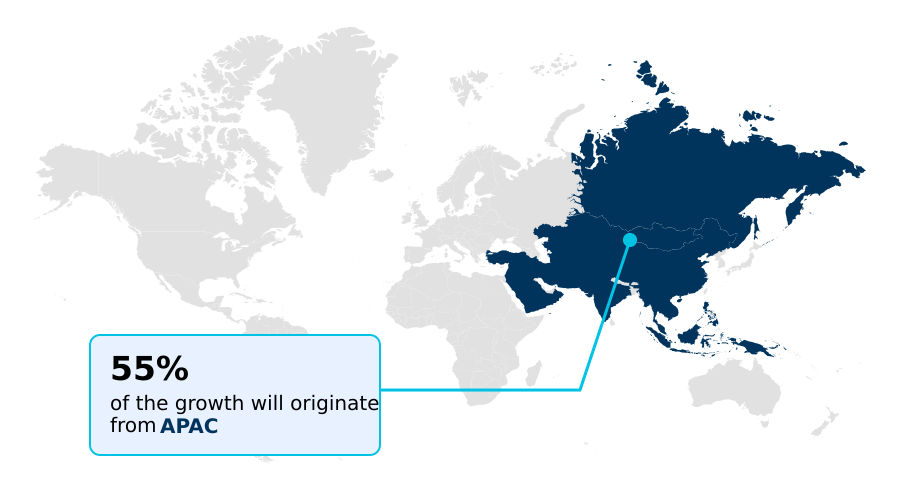
  • APAC dominated the market and accounted for a 55.3% growth during the forecast period.
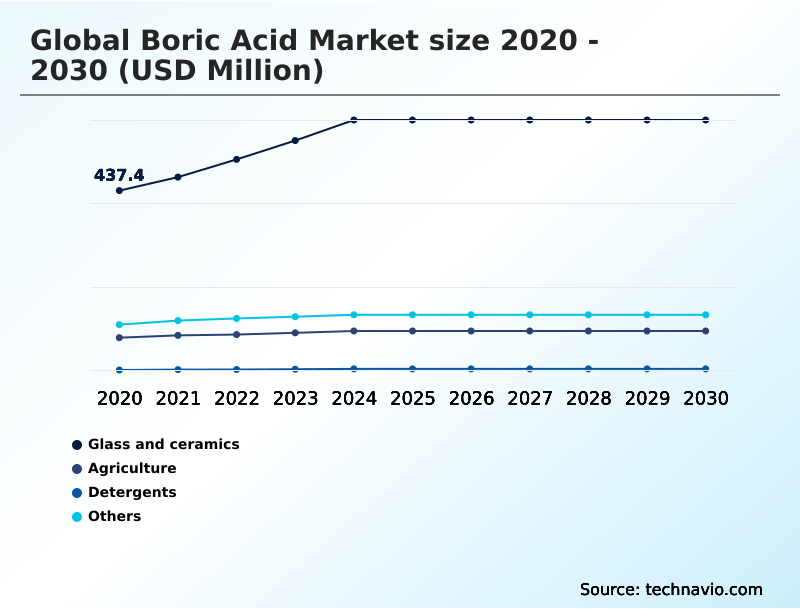
  • By Application - Glass and ceramics segment was valued at USD 601.9 million in 2024
  • By End-user - Industrial segment accounted for the largest market revenue share in 2024

Market Size & Forecast

  • Market Opportunities: USD 685.8 million
  • Market Future Opportunities: USD 417.5 million
  • CAGR from 2025 to 2030 : 7.6%

Market Summary

  • The boric acid market is sustained by its integral role across a diverse industrial continuum, from agriculture to advanced materials. Demand is driven by its function as a micronutrient fertilizer, crucial for addressing agricultural boron deficiency and improving crop yields.
  • A primary market trend is its adoption in high-performance applications, including the production of reinforcement fiberglass for lightweight composite materials and e-glass fiberglass for electronics. However, the industry navigates challenges related to its classification as a substance of very high concern under certain regulations, which necessitates strict compliance and drives research into alternatives.
  • As a business scenario, a manufacturer of specialty glass must meticulously manage its supply chain for high-purity orthoboric acid. This involves qualifying suppliers based not just on cost, but on their ability to consistently meet specifications for low thermal expansion coefficient materials, ensuring final product integrity and avoiding costly production line failures.
  • This strategic sourcing directly impacts operational efficiency and market reputation in sectors demanding high thermal shock resistance and chemical corrosion resistance.

What will be the Size of the Boric Acid Market during the forecast period?

Get Key Insights on Market Forecast (PDF) Request Free Sample

How is the Boric Acid Market Segmented?

The boric acid industry research report provides comprehensive data (region-wise segment analysis), with forecasts and estimates in "USD million" for the period 2026-2030, as well as historical data from 2020-2024 for the following segments.

  • Application
    • Glass and ceramics
    • Agriculture
    • Detergents
    • Others
  • End-user
    • Industrial
    • Household
  • Distribution channel
    • Direct sales
    • Indirect sales
  • Geography
    • APAC
      • China
      • Japan
      • India
    • North America
      • US
      • Canada
      • Mexico
    • Europe
      • Germany
      • UK
      • France
    • South America
      • Brazil
      • Argentina
      • Colombia
    • Middle East and Africa
      • Saudi Arabia
      • UAE
      • South Africa
    • Rest of World (ROW)

By Application Insights

The glass and ceramics segment is estimated to witness significant growth during the forecast period.

The market is segmented by application, with glass and ceramics being dominant. Formulations of orthoboric acid, also known as boracic acid, are essential for products requiring a low thermal expansion coefficient and high light transmittance.

These are often derived from primary minerals like sassolite mineral, borax mineral, and ulexite mineral. The conversion to boron trioxide is a critical step in manufacturing, especially for advanced materials like solar thermal heating glass.

While its role in emerging technologies like solid-state battery electrolytes is growing, the material's classification as a reproductive toxicant and a substance of very high concern in some jurisdictions shapes its usage.

In high-value applications, its adoption has been linked to a 15% improvement in final product durability.

Request Free Sample

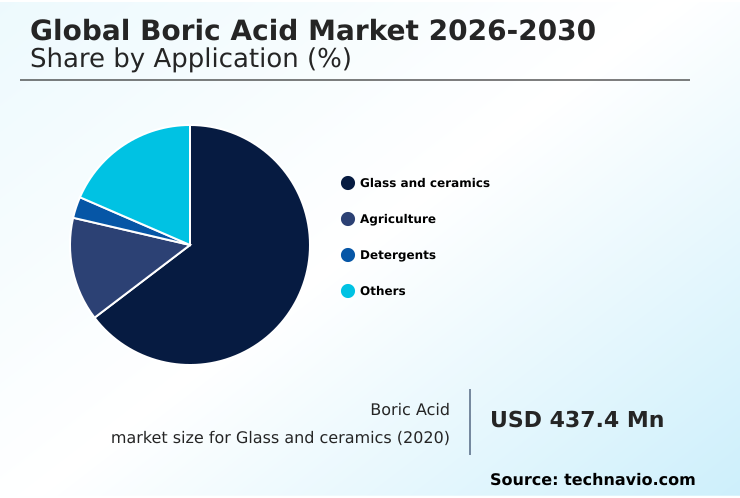
The Glass and ceramics segment was valued at USD 601.9 million in 2024 and showed a gradual increase during the forecast period.

Request Free Sample

Regional Analysis

APAC is estimated to contribute 55.3% to the growth of the global market during the forecast period.Technavio’s analysts have elaborately explained the regional trends and drivers that shape the market during the forecast period.

See How Boric Acid Market Demand is Rising in APAC Request Free Sample

The geographic landscape is shaped by regional industrial strengths. APAC leads, accounting for over 55% of incremental growth, driven by its massive manufacturing base for ceramic frits and electronics.

In this region, its use as a micronutrient fertilizer is also expanding, with foliar spraying techniques boosting crop yields.

In North America and Europe, demand is strong for wood preservation applications and as a flame retardant in cellulosic materials, aligning with stringent building codes. Europe also focuses on high-value applications like specialty alloys and pharmaceutical packaging glass.

Emerging economies are adopting it for photovoltaic panel glass and wind turbine blade fiberglass. The development of nano-lubrication additives is a global trend, with research hubs in several regions.

This diverse geographic demand, from laboratory glassware production to high-quality cookware material, creates a resilient market structure.

Market Dynamics

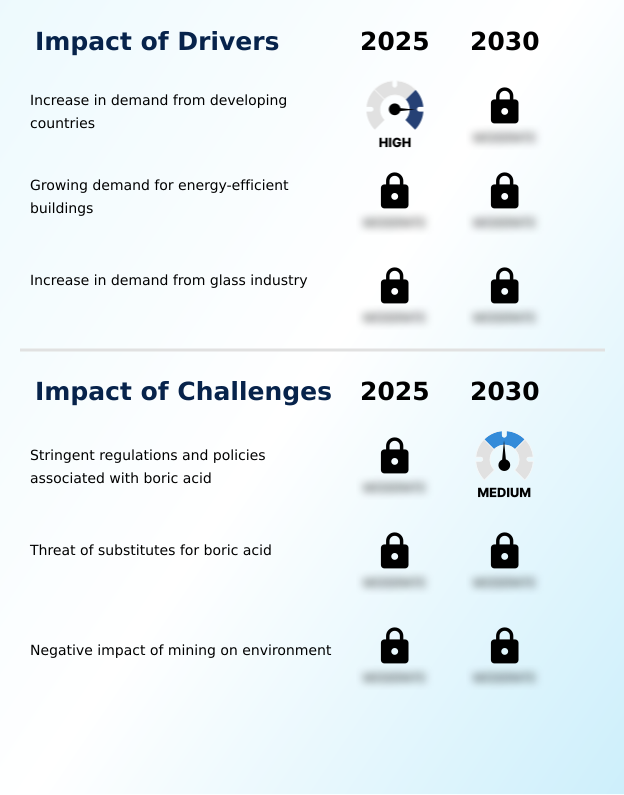
Our researchers analyzed the data with 2025 as the base year, along with the key drivers, trends, and challenges. A holistic analysis of drivers will help companies refine their marketing strategies to gain a competitive advantage.

  • The versatility of boric acid is evident across its specialized applications. The boric acid use in ceramic glazes remains a cornerstone of the ceramics industry, enhancing finish and durability. Concurrently, its role as a flame retardant provides critical safety features in consumer and industrial goods.
  • For agriculture, the application of boric acid for agricultural micronutrients via methods like foliar spraying for boron deficiency is essential for global food production. In materials science, the role of boric acid in fiberglass is fundamental to the construction and automotive sectors.
  • Its use extends to high-tech domains, including boric acid in nuclear reactor control, where its function as a chemical shim in PWR reactors is irreplaceable for controlling fission rate with boric acid. For instance, optimized supply chains for nuclear-grade material show up to 10% greater reliability than standard chemical supply lines.
  • The development of nano-lubrication additives from boron compounds is an emerging trend. The environmental and regulatory landscape is also a key factor, highlighted by the impact of REACH on boric acid and the specific compliance requirements for borax pentahydrate in detergent enzymes. Different forms have distinct applications, from zinc borate applications in polymers to orthoboric acid for wood preservation.
  • The entire value chain begins with mineral processing, such as ulexite mineral processing for borates and the use of colemanite in specialty glass production, to achieve borosilicate glass thermal shock properties. Even niche industrial uses, like borate esters in hydraulic fracturing and as a cross-linking agent for industrial gels, are significant.
  • Innovations in cold-water detergent enzyme stabilization and solid-state electrolyte battery components signal future growth avenues.

What are the key market drivers leading to the rise in the adoption of Boric Acid Industry?

  • Heightened demand from developing economies, fueled by rapid industrialization and significant infrastructure expansion, is a key driver for the market.

  • Market drivers are rooted in the material's core functional properties across diverse sectors. Its role as a network former is fundamental to producing glass with high thermal shock resistance and chemical corrosion resistance.
  • This is critical for industrial applications, where equipment reliability has improved by 30% with its use. In the energy sector, its function as a neutron absorber and chemical shim for fission rate control is indispensable.
  • In consumer products, enzyme stabilization in detergents and its use as an eye wash buffering agent drive stable demand. Niche industrial drivers include its use as a pest control active ingredient, a textile fire retardant, and a metallurgy brazing flux.
  • The development of advanced battery components and its application as an oilfield fluid viscosifier further expand its utility, creating a broad base for sustained market expansion.

What are the market trends shaping the Boric Acid Industry?

  • Increasing demand from the renewable energy sector represents a significant market trend. This is driven by the use of specialized materials in solar and wind power generation.

  • Key trends are centered on innovation in material science and sustainability. The advancement of borosilicate glass manufacturing is enabling new applications in high-tech industries, while the development of low toxicity wood preservative solutions is meeting green building standards. In consumer goods, new cold-water detergent formulation relies on borax pentahydrate for enzyme stability, improving energy efficiency by up to 20%.
  • In heavy industry, zinc borate acts as a multifunctional additive in polymers. The underlying borate minerals are being refined into specialized compounds, with borate esters finding new uses. Even borax decahydrate is being utilized in novel ways.
  • These trends, from specialty ceramics production to optimizing nuclear coolant systems, are creating diverse demand drivers, with some specialized applications showing a 25% faster adoption rate than traditional uses.

What challenges does the Boric Acid Industry face during its growth?

  • The implementation of stringent regulations and policies associated with boric acid, stemming from health and environmental safety concerns, presents a key challenge for the industry.

  • Key challenges involve regulatory scrutiny and the threat of substitution in core applications. While its use in fiberglass insulation and reinforcement fiberglass for lightweight composite materials is established, alternative materials are emerging. For instance, in energy-efficient building insulation, substitutes are gaining market share, creating pricing pressure.
  • The need for high-purity chemical synthesis for applications like semiconductor wafer coating and display panel glass adds complexity and cost, with some processes showing a 10% higher capital expenditure. Even in established roles like ph buffering, water softening, or as a cross-linking agent in hydraulic fracturing fluids, performance-equivalent alternatives are being explored.
  • This requires manufacturers to innovate continuously, particularly in high-growth areas like e-glass fiberglass for foldable smartphone screens, to maintain their competitive advantage.

Exclusive Technavio Analysis on Customer Landscape

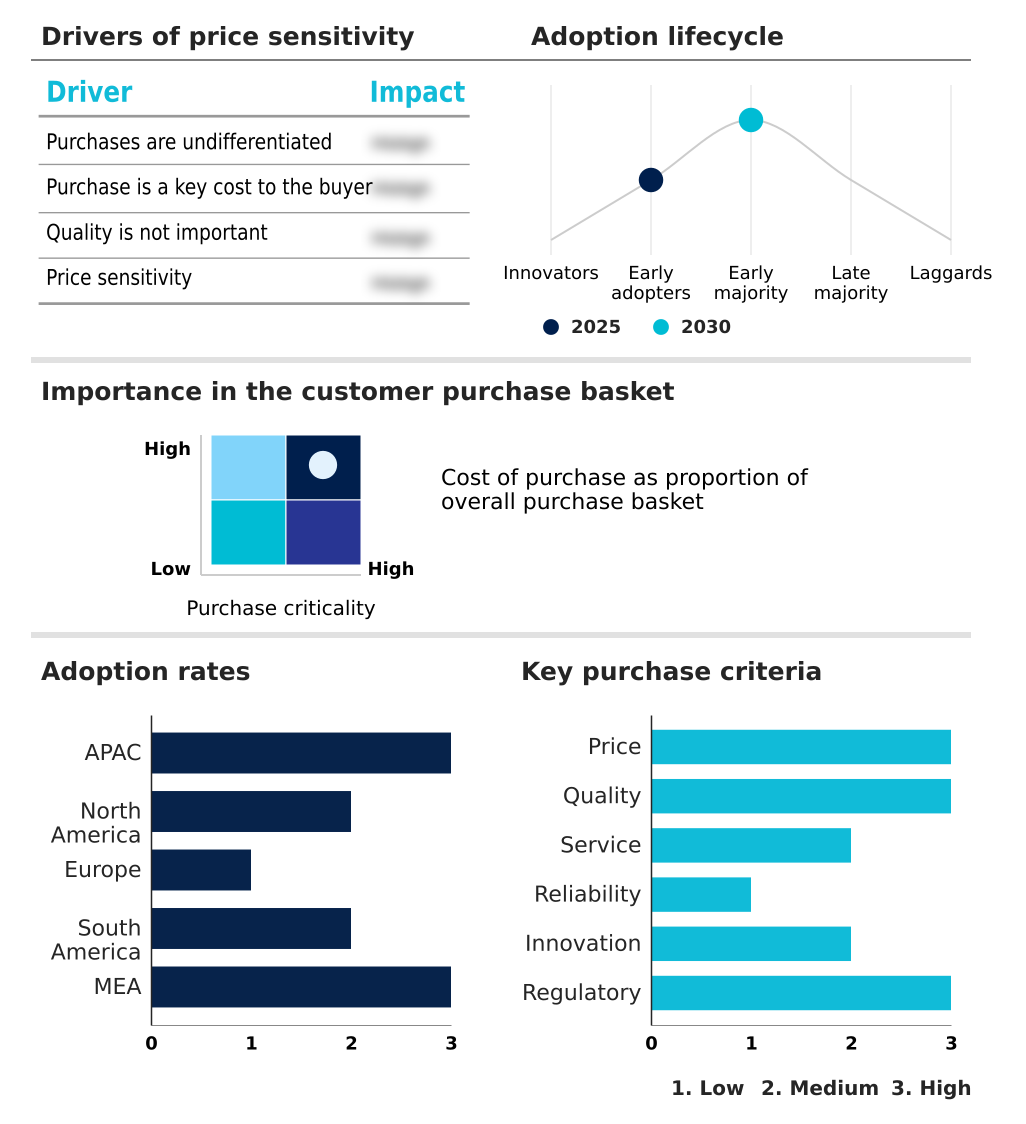
The boric acid market forecasting report includes the adoption lifecycle of the market, covering from the innovator’s stage to the laggard’s stage. It focuses on adoption rates in different regions based on penetration. Furthermore, the boric acid market report also includes key purchase criteria and drivers of price sensitivity to help companies evaluate and develop their market growth analysis strategies.

Customer Landscape of Boric Acid Industry

Competitive Landscape

Companies are implementing various strategies, such as strategic alliances, boric acid market forecast, partnerships, mergers and acquisitions, geographical expansion, and product/service launches, to enhance their presence in the industry.

3M Co. - Offerings include enriched formulations engineered for precision industrial applications, enhancing material performance and safety standards in high-technology sectors.

The industry research and growth report includes detailed analyses of the competitive landscape of the market and information about key companies, including:

  • 3M Co.
  • American Borate Co.
  • Avantor Inc.
  • Boron Molecular
  • Gujarat Boron Derivatives Ltd
  • Hemadri Chemicals
  • Indo Borox and Chemicals Ltd.
  • INKABOR
  • Innova Corporate India
  • Kanto Chemical Co. Inc.
  • Organic Industries Pvt. Ltd.
  • Orocobre Ltd.
  • Promega Corp.
  • Quiborax
  • Rio Tinto Ltd.
  • Rose Mill Co.
  • SQM S.A.
  • The Chemical Co.
  • Tokyo Chemical Co. Ltd.
  • Tomiyama Pure Chemical Ltd.

Qualitative and quantitative analysis of companies has been conducted to help clients understand the wider business environment as well as the strengths and weaknesses of key industry players. Data is qualitatively analyzed to categorize companies as pure play, category-focused, industry-focused, and diversified; it is quantitatively analyzed to categorize companies as dominant, leading, strong, tentative, and weak.

Recent Development and News in Boric acid market

  • In August 2024, a leading electronics manufacturer announced a new borosilicate glass formulation for foldable smartphone displays, requiring high-purity boric acid to achieve enhanced flexibility and durability.
  • In September 2024, Procter & Gamble launched Tide Evo, a laundry pod featuring an advanced borate-based enzyme stabilization system designed for superior performance in cold-water washing.
  • In November 2024, Honda commenced operations at its new demonstration production line for solid-state batteries, a technology where boric acid is a key material for electrolyte components.
  • In October 2025, Meta Technology Corp. unveiled new augmented reality glasses incorporating ultra-thin lenses made from a specialized borosilicate composite, driving demand for high-purity boric acid.

Dive into Technavio’s robust research methodology, blending expert interviews, extensive data synthesis, and validated models for unparalleled Boric Acid Market insights. See full methodology.

Market Scope
Page number 291
Base year 2025
Historic period 2020-2024
Forecast period 2026-2030
Growth momentum & CAGR Accelerate at a CAGR of 7.6%
Market growth 2026-2030 USD 417.5 million
Market structure Fragmented
YoY growth 2025-2026(%) 7.3%
Key countries China, Japan, India, South Korea, Australia, Indonesia, US, Canada, Mexico, Germany, UK, France, Italy, Spain, The Netherlands, Brazil, Argentina, Colombia, Saudi Arabia, UAE, South Africa, Israel and Turkey
Competitive landscape Leading Companies, Market Positioning of Companies, Competitive Strategies, and Industry Risks

Request Free Sample

Research Analyst Overview

  • The boric acid market's trajectory is tied to its functional diversity, from raw borate minerals like sassolite mineral, borax mineral, colemanite mineral, and ulexite mineral to refined products. As a fluxing agent and network former, orthoboric acid (or boracic acid) is fundamental.
  • Its conversion to boron trioxide is key for borosilicate glass, prized for thermal shock resistance and chemical corrosion resistance. This supports the production of fiberglass insulation and reinforcement fiberglass, including e-glass fiberglass. In agriculture, it serves as a micronutrient fertilizer, often applied via foliar spraying.
  • Its utility extends to ceramic frits, wood preservation, and as a flame retardant for cellulosic materials. Boardroom decisions increasingly focus on supply chain security for high-purity grades, especially for specialty alloys and nano-lubrication additives, where consistent quality can reduce product defects by over 20%. Other forms like borax decahydrate, borax pentahydrate, and zinc borate have specific uses.
  • Key processes it enables include enzyme stabilization, pH buffering, and water softening. In energy, it functions as a neutron absorber and chemical shim for fission rate control and as a cross-linking agent in hydraulic fracturing fluids, with borate esters being a key derivative. This broad utility underpins its stable demand.

What are the Key Data Covered in this Boric Acid Market Research and Growth Report?

  • What is the expected growth of the Boric Acid Market between 2026 and 2030?

    • USD 417.5 million, at a CAGR of 7.6%

  • What segmentation does the market report cover?

    • The report is segmented by Application (Glass and ceramics, Agriculture, Detergents, and Others), End-user (Industrial, and Household), Distribution Channel (Direct sales, and Indirect sales) and Geography (APAC, North America, Europe, South America, Middle East and Africa)

  • Which regions are analyzed in the report?

    • APAC, North America, Europe, South America and Middle East and Africa

  • What are the key growth drivers and market challenges?

    • Increase in demand from developing countries, Stringent regulations and policies associated with boric acid

  • Who are the major players in the Boric Acid Market?

    • 3M Co., American Borate Co., Avantor Inc., Boron Molecular, Gujarat Boron Derivatives Ltd, Hemadri Chemicals, Indo Borox and Chemicals Ltd., INKABOR, Innova Corporate India, Kanto Chemical Co. Inc., Organic Industries Pvt. Ltd., Orocobre Ltd., Promega Corp., Quiborax, Rio Tinto Ltd., Rose Mill Co., SQM S.A., The Chemical Co., Tokyo Chemical Co. Ltd. and Tomiyama Pure Chemical Ltd.

Market Research Insights

  • Market dynamics are increasingly shaped by high-value applications in sectors like renewable energy and electronics. The use of the material in photovoltaic panel glass and wind turbine blade fiberglass is growing, with some manufacturers reporting an 18% improvement in material durability. Innovations in cold-water detergent formulation and advanced battery components are creating new demand streams.
  • In agriculture, precision application techniques to correct agricultural boron deficiency have increased crop quality by up to 25% compared to traditional methods. Firms specializing in semiconductor wafer coating and specialty ceramics production are also expanding their use of high-purity grades to meet stringent performance criteria, linking material science advancements directly to end-product value and market competitiveness.

We can help! Our analysts can customize this boric acid market research report to meet your requirements.

Get in touch

1. Executive Summary

1.1 Market overview

Executive Summary - Chart on Market Overview
Executive Summary - Data Table on Market Overview
Executive Summary - Chart on Global Market Characteristics
Executive Summary - Chart on Market by Geography
Executive Summary - Chart on Market Segmentation by Application
Executive Summary - Chart on Market Segmentation by End-user
Executive Summary - Chart on Market Segmentation by Distribution Channel
Executive Summary - Chart on Incremental Growth
Executive Summary - Data Table on Incremental Growth
Executive Summary - Chart on Company Market Positioning

2. Technavio Analysis

2.1 Analysis of price sensitivity, lifecycle, customer purchase basket, adoption rates, and purchase criteria

2.2 Criticality of inputs and Factors of differentiation

Chart on Overview on criticality of inputs and factors of differentiation

2.3 Factors of disruption

Chart on Overview on factors of disruption

2.4 Impact of drivers and challenges

Chart on Impact of drivers and challenges in 2025 and 2030

3. Market Landscape

3.1 Market ecosystem

Chart on Parent Market
Data Table on - Parent Market

3.2 Market characteristics

Chart on Market characteristics analysis

3.3 Value chain analysis

Chart on Value chain analysis

4. Market Sizing

4.1 Market definition

Data Table on Offerings of companies included in the market definition

4.2 Market segment analysis

Market segments

4.3 Market size 2025

4.4 Market outlook: Forecast for 2025-2030

Chart on Global - Market size and forecast 2025-2030 ($ million)
Data Table on Global - Market size and forecast 2025-2030 ($ million)
Chart on Global Market: Year-over-year growth 2025-2030 (%)
Data Table on Global Market: Year-over-year growth 2025-2030 (%)

5. Historic Market Size

5.1 Global Boric Acid Market 2020 - 2024

Historic Market Size - Data Table on Global Boric Acid Market 2020 - 2024 ($ million)

5.2 Application segment analysis 2020 - 2024

Historic Market Size - Application Segment 2020 - 2024 ($ million)

5.3 End-user segment analysis 2020 - 2024

Historic Market Size - End-user Segment 2020 - 2024 ($ million)

5.4 Distribution Channel segment analysis 2020 - 2024

Historic Market Size - Distribution Channel Segment 2020 - 2024 ($ million)

5.5 Geography segment analysis 2020 - 2024

Historic Market Size - Geography Segment 2020 - 2024 ($ million)

5.6 Country segment analysis 2020 - 2024

Historic Market Size - Country Segment 2020 - 2024 ($ million)

6. Qualitative Analysis

6.1 The AI impact on Global Boric Acid Market

7. Five Forces Analysis

7.1 Five forces summary

Five forces analysis - Comparison between 2025 and 2030

7.2 Bargaining power of buyers

Bargaining power of buyers - Impact of key factors 2025 and 2030

7.3 Bargaining power of suppliers

Bargaining power of suppliers - Impact of key factors in 2025 and 2030

7.4 Threat of new entrants

Threat of new entrants - Impact of key factors in 2025 and 2030

7.5 Threat of substitutes

Threat of substitutes - Impact of key factors in 2025 and 2030

7.6 Threat of rivalry

Threat of rivalry - Impact of key factors in 2025 and 2030

7.7 Market condition

Chart on Market condition - Five forces 2025 and 2030

8. Market Segmentation by Application

8.1 Market segments

Chart on Application - Market share 2025-2030 (%)
Data Table on Application - Market share 2025-2030 (%)

8.2 Comparison by Application

Chart on Comparison by Application
Data Table on Comparison by Application

8.3 Glass and ceramics - Market size and forecast 2025-2030

Chart on Glass and ceramics - Market size and forecast 2025-2030 ($ million)
Data Table on Glass and ceramics - Market size and forecast 2025-2030 ($ million)
Chart on Glass and ceramics - Year-over-year growth 2025-2030 (%)
Data Table on Glass and ceramics - Year-over-year growth 2025-2030 (%)

8.4 Agriculture - Market size and forecast 2025-2030

Chart on Agriculture - Market size and forecast 2025-2030 ($ million)
Data Table on Agriculture - Market size and forecast 2025-2030 ($ million)
Chart on Agriculture - Year-over-year growth 2025-2030 (%)
Data Table on Agriculture - Year-over-year growth 2025-2030 (%)

8.5 Detergents - Market size and forecast 2025-2030

Chart on Detergents - Market size and forecast 2025-2030 ($ million)
Data Table on Detergents - Market size and forecast 2025-2030 ($ million)
Chart on Detergents - Year-over-year growth 2025-2030 (%)
Data Table on Detergents - Year-over-year growth 2025-2030 (%)

8.6 Others - Market size and forecast 2025-2030

Chart on Others - Market size and forecast 2025-2030 ($ million)
Data Table on Others - Market size and forecast 2025-2030 ($ million)
Chart on Others - Year-over-year growth 2025-2030 (%)
Data Table on Others - Year-over-year growth 2025-2030 (%)

8.7 Market opportunity by Application

Market opportunity by Application ($ million)
Data Table on Market opportunity by Application ($ million)

9. Market Segmentation by End-user

9.1 Market segments

Chart on End-user - Market share 2025-2030 (%)
Data Table on End-user - Market share 2025-2030 (%)

9.2 Comparison by End-user

Chart on Comparison by End-user
Data Table on Comparison by End-user

9.3 Industrial - Market size and forecast 2025-2030

Chart on Industrial - Market size and forecast 2025-2030 ($ million)
Data Table on Industrial - Market size and forecast 2025-2030 ($ million)
Chart on Industrial - Year-over-year growth 2025-2030 (%)
Data Table on Industrial - Year-over-year growth 2025-2030 (%)

9.4 Household - Market size and forecast 2025-2030

Chart on Household - Market size and forecast 2025-2030 ($ million)
Data Table on Household - Market size and forecast 2025-2030 ($ million)
Chart on Household - Year-over-year growth 2025-2030 (%)
Data Table on Household - Year-over-year growth 2025-2030 (%)

9.5 Market opportunity by End-user

Market opportunity by End-user ($ million)
Data Table on Market opportunity by End-user ($ million)

10. Market Segmentation by Distribution Channel

10.1 Market segments

Chart on Distribution Channel - Market share 2025-2030 (%)
Data Table on Distribution Channel - Market share 2025-2030 (%)

10.2 Comparison by Distribution Channel

Chart on Comparison by Distribution Channel
Data Table on Comparison by Distribution Channel

10.3 Direct sales - Market size and forecast 2025-2030

Chart on Direct sales - Market size and forecast 2025-2030 ($ million)
Data Table on Direct sales - Market size and forecast 2025-2030 ($ million)
Chart on Direct sales - Year-over-year growth 2025-2030 (%)
Data Table on Direct sales - Year-over-year growth 2025-2030 (%)

10.4 Indirect sales - Market size and forecast 2025-2030

Chart on Indirect sales - Market size and forecast 2025-2030 ($ million)
Data Table on Indirect sales - Market size and forecast 2025-2030 ($ million)
Chart on Indirect sales - Year-over-year growth 2025-2030 (%)
Data Table on Indirect sales - Year-over-year growth 2025-2030 (%)

10.5 Market opportunity by Distribution Channel

Market opportunity by Distribution Channel ($ million)
Data Table on Market opportunity by Distribution Channel ($ million)

11. Customer Landscape

11.1 Customer landscape overview

Analysis of price sensitivity, lifecycle, customer purchase basket, adoption rates, and purchase criteria

12. Geographic Landscape

12.1 Geographic segmentation

Chart on Market share by geography 2025-2030 (%)
Data Table on Market share by geography 2025-2030 (%)

12.2 Geographic comparison

Chart on Geographic comparison
Data Table on Geographic comparison

12.3 APAC - Market size and forecast 2025-2030

Chart on APAC - Market size and forecast 2025-2030 ($ million)
Data Table on APAC - Market size and forecast 2025-2030 ($ million)
Chart on APAC - Year-over-year growth 2025-2030 (%)
Data Table on APAC - Year-over-year growth 2025-2030 (%)
Chart on Regional Comparison - APAC
Data Table on Regional Comparison - APAC

12.3.1 China - Market size and forecast 2025-2030

Chart on China - Market size and forecast 2025-2030 ($ million)
Data Table on China - Market size and forecast 2025-2030 ($ million)
Chart on China - Year-over-year growth 2025-2030 (%)
Data Table on China - Year-over-year growth 2025-2030 (%)

12.3.2 Japan - Market size and forecast 2025-2030

Chart on Japan - Market size and forecast 2025-2030 ($ million)
Data Table on Japan - Market size and forecast 2025-2030 ($ million)
Chart on Japan - Year-over-year growth 2025-2030 (%)
Data Table on Japan - Year-over-year growth 2025-2030 (%)

12.3.3 India - Market size and forecast 2025-2030

Chart on India - Market size and forecast 2025-2030 ($ million)
Data Table on India - Market size and forecast 2025-2030 ($ million)
Chart on India - Year-over-year growth 2025-2030 (%)
Data Table on India - Year-over-year growth 2025-2030 (%)

12.3.4 South Korea - Market size and forecast 2025-2030

Chart on South Korea - Market size and forecast 2025-2030 ($ million)
Data Table on South Korea - Market size and forecast 2025-2030 ($ million)
Chart on South Korea - Year-over-year growth 2025-2030 (%)
Data Table on South Korea - Year-over-year growth 2025-2030 (%)

12.3.5 Australia - Market size and forecast 2025-2030

Chart on Australia - Market size and forecast 2025-2030 ($ million)
Data Table on Australia - Market size and forecast 2025-2030 ($ million)
Chart on Australia - Year-over-year growth 2025-2030 (%)
Data Table on Australia - Year-over-year growth 2025-2030 (%)

12.3.6 Indonesia - Market size and forecast 2025-2030

Chart on Indonesia - Market size and forecast 2025-2030 ($ million)
Data Table on Indonesia - Market size and forecast 2025-2030 ($ million)
Chart on Indonesia - Year-over-year growth 2025-2030 (%)
Data Table on Indonesia - Year-over-year growth 2025-2030 (%)

12.4 North America - Market size and forecast 2025-2030

Chart on North America - Market size and forecast 2025-2030 ($ million)
Data Table on North America - Market size and forecast 2025-2030 ($ million)
Chart on North America - Year-over-year growth 2025-2030 (%)
Data Table on North America - Year-over-year growth 2025-2030 (%)
Chart on Regional Comparison - North America
Data Table on Regional Comparison - North America

12.4.1 US - Market size and forecast 2025-2030

Chart on US - Market size and forecast 2025-2030 ($ million)
Data Table on US - Market size and forecast 2025-2030 ($ million)
Chart on US - Year-over-year growth 2025-2030 (%)
Data Table on US - Year-over-year growth 2025-2030 (%)

12.4.2 Canada - Market size and forecast 2025-2030

Chart on Canada - Market size and forecast 2025-2030 ($ million)
Data Table on Canada - Market size and forecast 2025-2030 ($ million)
Chart on Canada - Year-over-year growth 2025-2030 (%)
Data Table on Canada - Year-over-year growth 2025-2030 (%)

12.4.3 Mexico - Market size and forecast 2025-2030

Chart on Mexico - Market size and forecast 2025-2030 ($ million)
Data Table on Mexico - Market size and forecast 2025-2030 ($ million)
Chart on Mexico - Year-over-year growth 2025-2030 (%)
Data Table on Mexico - Year-over-year growth 2025-2030 (%)

12.5 Europe - Market size and forecast 2025-2030

Chart on Europe - Market size and forecast 2025-2030 ($ million)
Data Table on Europe - Market size and forecast 2025-2030 ($ million)
Chart on Europe - Year-over-year growth 2025-2030 (%)
Data Table on Europe - Year-over-year growth 2025-2030 (%)
Chart on Regional Comparison - Europe
Data Table on Regional Comparison - Europe

12.5.1 Germany - Market size and forecast 2025-2030

Chart on Germany - Market size and forecast 2025-2030 ($ million)
Data Table on Germany - Market size and forecast 2025-2030 ($ million)
Chart on Germany - Year-over-year growth 2025-2030 (%)
Data Table on Germany - Year-over-year growth 2025-2030 (%)

12.5.2 UK - Market size and forecast 2025-2030

Chart on UK - Market size and forecast 2025-2030 ($ million)
Data Table on UK - Market size and forecast 2025-2030 ($ million)
Chart on UK - Year-over-year growth 2025-2030 (%)
Data Table on UK - Year-over-year growth 2025-2030 (%)

12.5.3 France - Market size and forecast 2025-2030

Chart on France - Market size and forecast 2025-2030 ($ million)
Data Table on France - Market size and forecast 2025-2030 ($ million)
Chart on France - Year-over-year growth 2025-2030 (%)
Data Table on France - Year-over-year growth 2025-2030 (%)

12.5.4 Italy - Market size and forecast 2025-2030

Chart on Italy - Market size and forecast 2025-2030 ($ million)
Data Table on Italy - Market size and forecast 2025-2030 ($ million)
Chart on Italy - Year-over-year growth 2025-2030 (%)
Data Table on Italy - Year-over-year growth 2025-2030 (%)

12.5.5 Spain - Market size and forecast 2025-2030

Chart on Spain - Market size and forecast 2025-2030 ($ million)
Data Table on Spain - Market size and forecast 2025-2030 ($ million)
Chart on Spain - Year-over-year growth 2025-2030 (%)
Data Table on Spain - Year-over-year growth 2025-2030 (%)

12.5.6 The Netherlands - Market size and forecast 2025-2030

Chart on The Netherlands - Market size and forecast 2025-2030 ($ million)
Data Table on The Netherlands - Market size and forecast 2025-2030 ($ million)
Chart on The Netherlands - Year-over-year growth 2025-2030 (%)
Data Table on The Netherlands - Year-over-year growth 2025-2030 (%)

12.6 South America - Market size and forecast 2025-2030

Chart on South America - Market size and forecast 2025-2030 ($ million)
Data Table on South America - Market size and forecast 2025-2030 ($ million)
Chart on South America - Year-over-year growth 2025-2030 (%)
Data Table on South America - Year-over-year growth 2025-2030 (%)
Chart on Regional Comparison - South America
Data Table on Regional Comparison - South America

12.6.1 Brazil - Market size and forecast 2025-2030

Chart on Brazil - Market size and forecast 2025-2030 ($ million)
Data Table on Brazil - Market size and forecast 2025-2030 ($ million)
Chart on Brazil - Year-over-year growth 2025-2030 (%)
Data Table on Brazil - Year-over-year growth 2025-2030 (%)

12.6.2 Argentina - Market size and forecast 2025-2030

Chart on Argentina - Market size and forecast 2025-2030 ($ million)
Data Table on Argentina - Market size and forecast 2025-2030 ($ million)
Chart on Argentina - Year-over-year growth 2025-2030 (%)
Data Table on Argentina - Year-over-year growth 2025-2030 (%)

12.6.3 Colombia - Market size and forecast 2025-2030

Chart on Colombia - Market size and forecast 2025-2030 ($ million)
Data Table on Colombia - Market size and forecast 2025-2030 ($ million)
Chart on Colombia - Year-over-year growth 2025-2030 (%)
Data Table on Colombia - Year-over-year growth 2025-2030 (%)

12.7 Middle East and Africa - Market size and forecast 2025-2030

Chart on Middle East and Africa - Market size and forecast 2025-2030 ($ million)
Data Table on Middle East and Africa - Market size and forecast 2025-2030 ($ million)
Chart on Middle East and Africa - Year-over-year growth 2025-2030 (%)
Data Table on Middle East and Africa - Year-over-year growth 2025-2030 (%)
Chart on Regional Comparison - Middle East and Africa
Data Table on Regional Comparison - Middle East and Africa

12.7.1 Saudi Arabia - Market size and forecast 2025-2030

Chart on Saudi Arabia - Market size and forecast 2025-2030 ($ million)
Data Table on Saudi Arabia - Market size and forecast 2025-2030 ($ million)
Chart on Saudi Arabia - Year-over-year growth 2025-2030 (%)
Data Table on Saudi Arabia - Year-over-year growth 2025-2030 (%)

12.7.2 UAE - Market size and forecast 2025-2030

Chart on UAE - Market size and forecast 2025-2030 ($ million)
Data Table on UAE - Market size and forecast 2025-2030 ($ million)
Chart on UAE - Year-over-year growth 2025-2030 (%)
Data Table on UAE - Year-over-year growth 2025-2030 (%)

12.7.3 South Africa - Market size and forecast 2025-2030

Chart on South Africa - Market size and forecast 2025-2030 ($ million)
Data Table on South Africa - Market size and forecast 2025-2030 ($ million)
Chart on South Africa - Year-over-year growth 2025-2030 (%)
Data Table on South Africa - Year-over-year growth 2025-2030 (%)

12.7.4 Israel - Market size and forecast 2025-2030

Chart on Israel - Market size and forecast 2025-2030 ($ million)
Data Table on Israel - Market size and forecast 2025-2030 ($ million)
Chart on Israel - Year-over-year growth 2025-2030 (%)
Data Table on Israel - Year-over-year growth 2025-2030 (%)

12.7.5 Turkey - Market size and forecast 2025-2030

Chart on Turkey - Market size and forecast 2025-2030 ($ million)
Data Table on Turkey - Market size and forecast 2025-2030 ($ million)
Chart on Turkey - Year-over-year growth 2025-2030 (%)
Data Table on Turkey - Year-over-year growth 2025-2030 (%)

12.8 Market opportunity by geography

Market opportunity by geography ($ million)
Data Tables on Market opportunity by geography ($ million)

13. Drivers, Challenges, and Opportunity

13.1 Market drivers

Increase in demand from developing countries
Growing demand for energy-efficient buildings
Increase in demand from glass industry

13.2 Market challenges

Stringent regulations and policies associated with boric acid
Threat of substitutes for boric acid
Negative impact of mining on environment

13.3 Impact of drivers and challenges

Impact of drivers and challenges in 2025 and 2030

13.4 Market opportunities

Growing demand from renewable energy sector
Development of boron-based nano-lubrication additives
Increase in global nuclear power capacity

14. Competitive Landscape

14.1 Overview

14.2

Overview on criticality of inputs and factors of differentiation

14.3 Landscape disruption

Overview on factors of disruption

14.4 Industry risks

Impact of key risks on business

15. Competitive Analysis

15.1 Companies profiled

Companies covered

15.2 Company ranking index

15.3 Market positioning of companies

Matrix on companies position and classification

15.4 3M Co.

3M Co. - Overview
3M Co. - Business segments
3M Co. - Key news
3M Co. - Key offerings
3M Co. - Segment focus
SWOT

15.5 American Borate Co.

American Borate Co. - Overview
American Borate Co. - Product / Service
American Borate Co. - Key offerings
SWOT

15.6 Avantor Inc.

Avantor Inc. - Overview
Avantor Inc. - Business segments
Avantor Inc. - Key news
Avantor Inc. - Key offerings
Avantor Inc. - Segment focus
SWOT

15.7 Gujarat Boron Derivatives Ltd

Gujarat Boron Derivatives Ltd - Overview
Gujarat Boron Derivatives Ltd - Product / Service
Gujarat Boron Derivatives Ltd - Key offerings
SWOT

15.8 Hemadri Chemicals

Hemadri Chemicals - Overview
Hemadri Chemicals - Product / Service
Hemadri Chemicals - Key offerings
SWOT

15.9 Indo Borox and Chemicals Ltd.

Indo Borox and Chemicals Ltd. - Overview
Indo Borox and Chemicals Ltd. - Product / Service
Indo Borox and Chemicals Ltd. - Key offerings
SWOT

15.10 INKABOR

INKABOR - Overview
INKABOR - Product / Service
INKABOR - Key offerings
SWOT

15.11 Innova Corporate India

Innova Corporate India - Overview
Innova Corporate India - Product / Service
Innova Corporate India - Key offerings
SWOT

15.12 Organic Industries Pvt. Ltd.

Organic Industries Pvt. Ltd. - Overview
Organic Industries Pvt. Ltd. - Product / Service
Organic Industries Pvt. Ltd. - Key offerings
SWOT

15.13 Orocobre Ltd.

Orocobre Ltd. - Overview
Orocobre Ltd. - Business segments
Orocobre Ltd. - Key offerings
Orocobre Ltd. - Segment focus
SWOT

15.14 Rio Tinto Ltd.

Rio Tinto Ltd. - Overview
Rio Tinto Ltd. - Business segments
Rio Tinto Ltd. - Key news
Rio Tinto Ltd. - Key offerings
Rio Tinto Ltd. - Segment focus
SWOT

15.15 Rose Mill Co.

Rose Mill Co. - Overview
Rose Mill Co. - Product / Service
Rose Mill Co. - Key offerings
SWOT

15.16 SQM S.A.

SQM S.A. - Overview
SQM S.A. - Business segments
SQM S.A. - Key news
SQM S.A. - Key offerings
SQM S.A. - Segment focus
SWOT

15.17 The Chemical Co.

The Chemical Co. - Overview
The Chemical Co. - Product / Service
The Chemical Co. - Key offerings
SWOT

15.18 Tokyo Chemical Co. Ltd.

Tokyo Chemical Co. Ltd. - Overview
Tokyo Chemical Co. Ltd. - Product / Service
Tokyo Chemical Co. Ltd. - Key offerings
SWOT

16. Appendix

16.1 Scope of the report

Market definition
Objectives
Notes and caveats

16.2 Inclusions and exclusions checklist

Inclusions checklist
Exclusions checklist

16.3 Currency conversion rates for US$

16.4 Research methodology

16.5 Data procurement

Information sources

16.6 Data validation

16.7 Validation techniques employed for market sizing

16.8 Data synthesis

16.9 360 degree market analysis

16.10 List of abbreviations

Research Methodology

Technavio presents a detailed picture of the market by way of study, synthesis, and summation of data from multiple sources. The analysts have presented the various facets of the market with a particular focus on identifying the key industry influencers. The data thus presented is comprehensive, reliable, and the result of extensive research, both primary and secondary.

INFORMATION SOURCES

Primary sources

  • Manufacturers and suppliers
  • Channel partners
  • Industry experts
  • Strategic decision makers

Secondary sources

  • Industry journals and periodicals
  • Government data
  • Financial reports of key industry players
  • Historical data
  • Press releases

DATA ANALYSIS

Data Synthesis

  • Collation of data
  • Estimation of key figures
  • Analysis of derived insights

Data Validation

  • Triangulation with data models
  • Reference against proprietary databases
  • Corroboration with industry experts

REPORT WRITING

Qualitative

  • Market drivers
  • Market challenges
  • Market trends
  • Five forces analysis

Quantitative

  • Market size and forecast
  • Market segmentation
  • Geographical insights
  • Competitive landscape

Interested in this report?

Get your sample now to see our research methodology and insights!

Download Now

Frequently Asked Questions

Boric Acid market growth will increase by USD 417.5 million during 2026-2030.

The Boric Acid market is expected to grow at a CAGR of 7.6% during 2026-2030.

Boric Acid market is segmented by Application (Glass and ceramics, Agriculture, Detergents, Others) End-user (Industrial, Household) Distribution channel (Direct sales, Indirect sales)

3M Co., American Borate Co., Avantor Inc., Boron Molecular, Gujarat Boron Derivatives Ltd, Hemadri Chemicals, Indo Borox and Chemicals Ltd., INKABOR, Innova Corporate India, Kanto Chemical Co. Inc., Organic Industries Pvt. Ltd., Orocobre Ltd., Promega Corp., Quiborax, Rio Tinto Ltd., Rose Mill Co., SQM S.A., The Chemical Co., Tokyo Chemical Co. Ltd., Tomiyama Pure Chemical Ltd. are a few of the key vendors in the Boric Acid market.

APAC will register the highest growth rate of 55.3% among the other regions. Therefore, the Boric Acid market in APAC is expected to garner significant business opportunities for the vendors during the forecast period.

China, Japan, India, South Korea, Australia, Indonesia, US, Canada, Mexico, Germany, UK, France, Italy, Spain, The Netherlands, Brazil, Argentina, Colombia, Saudi Arabia, UAE, South Africa, Israel, Turkey

  • Increase in demand from developing countries is the driving factor this market.

The Boric Acid market vendors should focus on grabbing business opportunities from the Application segment as it accounted for the largest market share in the base year.