Blueberry Market Analysis North America, Europe, APAC, South America, Middle East and Africa - US, Canada, Germany, France, China, Italy, Spain, Japan, UK, South Korea - Size and Forecast 2025-2029

Blueberry Market Analysis North America, Europe, APAC, South America, Middle East and Africa - US, Canada, Germany, France, China, Italy, Spain, Japan, UK, South Korea - Size and Forecast 2025-2029

Published: Jan 2025 205 Pages SKU: IRTNTR74756

Market Overview at a Glance

$3.06 B
Market Opportunity
7.1%
CAGR
6.5
YoY growth 2024-2025(%)

Blueberry Market Size 2025-2029

The blueberry market size is forecast to increase by USD 3.06 billion, at a CAGR of 7.1% between 2024 and 2029.

  • The market is experiencing significant shifts, driven by the increasing penetration of online retailing and e-commerce platforms. This trend is transforming the way consumers purchase and receive fresh produce, including blueberries, leading to increased convenience and accessibility. Another key driver is the rising focus on advanced packaging solutions to maintain the freshness and quality of blueberries during transportation and storage. However, the market also faces challenges, such as stringent food safety regulations, which require producers and suppliers to adhere to strict standards to ensure the safety and health of consumers. Meeting these regulations adds complexity and cost to the supply chain, necessitating strategic planning and innovation to maintain competitiveness.
  • Companies seeking to capitalize on market opportunities and navigate challenges effectively should prioritize investment in advanced packaging technologies and robust food safety protocols. Additionally, exploring partnerships with e-commerce platforms and adopting digital marketing strategies can help expand market reach and meet the evolving demands of consumers.

What will be the Size of the Blueberry Market during the forecast period?

Blueberry Market Size

Explore in-depth regional segment analysis with market size data - historical 2019-2023 and forecasts 2025-2029 - in the full report.  
Request Free Sample

The market continues to evolve, with dynamic shifts in production, processing, and consumption patterns shaping the industry's landscape. Blueberry processing is a critical component, as innovations in technology and techniques drive efficiency and product diversity. Pest control and disease management remain ongoing concerns, with continuous research and development in sustainable solutions. Rabbiteye blueberries and southern highbush blueberries are gaining popularity due to their unique characteristics and adaptability to various climates. Price fluctuations, influenced by supply and demand dynamics, impact the profitability of blueberry growers. Industry associations play a vital role in fostering collaboration and knowledge-sharing among stakeholders.

Organic blueberry production is on the rise, driven by consumer preferences for healthier and more sustainable food options. Blueberries find applications in various sectors, from muffins and pies to jams, smoothies, and supplements. Planting and fertilization practices are continually refined to optimize yields and improve sustainability. Blueberries' health benefits, including their rich antioxidant content, fuel demand and innovation in the market. Irrigation, pruning, and storage techniques are essential for maintaining blueberry quality standards. The industry's focus on research and development, safety regulations, and cultivar breeding ensures a vibrant future for this versatile fruit.

How is this Blueberry Industry segmented?

The blueberry industry research report provides comprehensive data (region-wise segment analysis), with forecasts and estimates in "USD million" for the period 2025-2029, as well as historical data from 2019-2023 for the following segments.

  • Application
    • Food and beverages
    • Bakery and confectionary
    • Others
  • Type
    • Organic
    • Conventional
  • Product
    • Fresh
    • Frozen
    • Dried
  • Geography
    • North America
      • US
      • Canada
    • Europe
      • France
      • Germany
      • Italy
      • Spain
      • UK
    • APAC
      • China
      • Japan
      • South Korea
    • Rest of World (ROW)

By Application Insights

The food and beverages segment is estimated to witness significant growth during the forecast period.

Blueberries are a popular superfruit used extensively in the food and beverage industry, particularly in snacks, ice creams, jams, and various beverages such as juices, soft drinks, smoothies, and wine. The nutritional value of blueberries is significant, as they contain polysaccharides, phytonutrients, enzymes, and antioxidants like glutathione, flavonoids, carotenoid pigments, and polyphenols. Blueberries are highly sought after due to their health benefits and are increasingly being incorporated into healthier snack options in response to the growing demand for nutritious diets. Additionally, the popularity of blueberries in ice cream production is contributing to the growth of the food and beverage segment.

Blueberry farming practices include pruning, irrigation, and disease management to ensure optimal yield and quality. Innovations in blueberry cultivation, such as highbush and southern highbush varieties, have increased supply and improved sustainability. Blueberries are also processed into supplements, jams, and juices, which require careful handling and certification programs to ensure safety and quality. The market trends reflect a focus on organic production, as well as research into the potential health benefits of blueberries and their antioxidants. Blueberry industry associations play a crucial role in promoting the industry and addressing challenges, such as price fluctuations and pest control.

Overall, the market is dynamic and evolving, driven by consumer demand for healthier food options and the ongoing research and innovation in blueberry cultivation and processing.

Blueberry Market Size

Request Free Sample

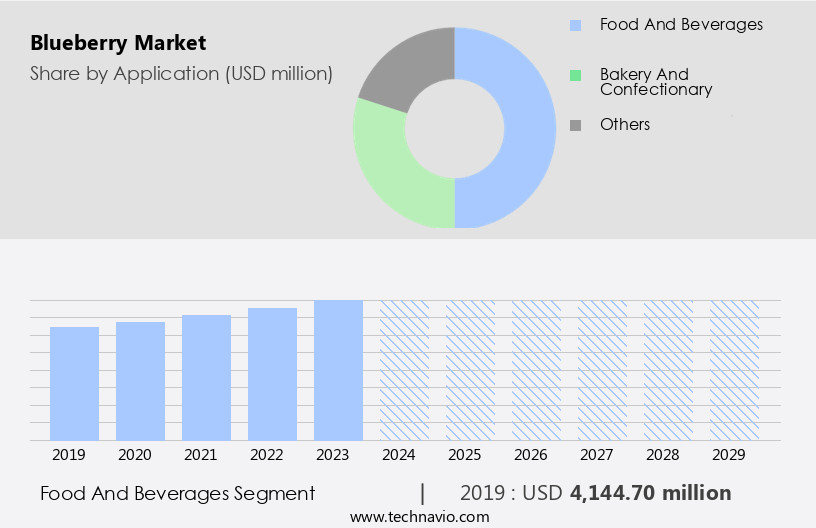
The Food and beverages segment was valued at USD 4.14 billion in 2019 and showed a gradual increase during the forecast period.

Regional Analysis

North America is estimated to contribute 31% to the growth of the global market during the forecast period. Technavio's analysts have elaborately explained the regional trends and drivers that shape the market during the forecast period.

Blueberry Market Share by Geography

 Request Free Sample

The market is witnessing significant growth, with North America leading the charge. Blueberries are increasingly used in the food and beverage industry for various applications due to their high nutritional value. This trend is particularly prominent in North America, where the demand for blueberries is on the rise. Blueberry farming practices, such as pruning, irrigation, and disease management, ensure a consistent supply of high-quality blueberries. Innovations in blueberry breeding have led to the development of new cultivars, including rabbiteye and southern highbush blueberries, which are well-suited to different climates and regions. Blueberries are used in various forms, including fresh, frozen, dried, and processed.

Processed blueberries are used to make jams, juices, and supplements. Blueberry pies and muffins are popular baked goods, while blueberry yogurt and smoothies are popular beverages. Blueberry certification programs ensure the production of organic and sustainably grown blueberries. Blueberry storage and transportation methods have also improved, ensuring the freshness and quality of the fruit. Blueberries are known for their antioxidant properties, making them a popular choice for health-conscious consumers. Blueberry health benefits include improved heart health, cognitive function, and digestive health. Blueberry research continues to uncover new health benefits, driving demand for the fruit. Blueberry industry associations promote best practices and standards for blueberry cultivation, processing, and consumption.

Blueberry farming practices, such as pruning, irrigation, and disease management, are essential to ensure the profitability of blueberry production. Blueberry supply and demand dynamics are influenced by various factors, including weather conditions, crop yields, and market trends. Price fluctuations can impact the profitability of blueberry farmers, making it essential to stay informed about market trends and consumer preferences. Blueberry cultivation and propagation techniques have evolved to meet the increasing demand for the fruit. Blueberry bushes are grown using various methods, including planting, fertilization, and propagation. Blueberry harvesting methods have also improved, ensuring the efficient and high-quality production of the fruit.

In conclusion, the market is experiencing significant growth, driven by increasing demand from the food and beverage industry and health-conscious consumers. Blueberries are used in various forms, from fresh to processed, and are known for their health benefits and versatility. Blueberry farming practices, research, and industry associations play a crucial role in ensuring the sustainability and profitability of the market.

Market Dynamics

Our researchers analyzed the data with 2024 as the base year, along with the key drivers, trends, and challenges. A holistic analysis of drivers will help companies refine their marketing strategies to gain a competitive advantage.

What are the key market drivers leading to the rise in the adoption of Blueberry Industry?

  • The significant expansion of online retailing and e-commerce sectors is the primary market catalyst, driving growth in this industry. 
  • Blueberries are gaining popularity in the global market due to their numerous health benefits and increasing consumer awareness towards healthy living. companies are leveraging online channels to market blueberries and their related products, such as blueberry supplements, to a wider audience. This trend enables companies to deliver from a central location, reaching consumers globally. The rising demand for blueberries is driven by their nutritional value and versatility in various applications, including blueberry smoothies and other food products. Blueberry cultivation requires careful pruning, irrigation, and adherence to quality standards to ensure optimal growth and yield. Sustainable farming practices are essential to maintain the long-term profitability of blueberry farming.
  • The market for blueberries is expected to continue its growth trajectory, with an emphasis on improving cultivar selection and production efficiency. Consumers are increasingly seeking high-quality blueberries for their health benefits, making it crucial for companies to prioritize product quality and consistency.

What are the market trends shaping the Blueberry Industry?

  • Advanced packaging is gaining significant attention in the market, with an increasing focus on this technology trend. It entails the integration of advanced features into packaging designs to enhance product protection, extend shelf life, and improve consumer experience.
  • Blueberries are a popular fruit in the US market, known for their health benefits and versatility in various food products. The blueberry industry is dynamic, with ongoing research and innovation driving growth. Blueberries are used in various forms, including blueberry yogurt, juice, and transportation as fresh or frozen berries. Safety regulations play a crucial role in the blueberry supply chain to ensure the highest quality and food safety. Blueberry research focuses on improving propagation techniques, harvesting methods, and developing new blueberry varieties. Highbush blueberries are the most commonly cultivated variety, but other types like rabbiteye and wild blueberries also have a presence in the market.
  • Packaging is essential for blueberries, as it preserves their freshness, flavor, and texture. Advanced packaging technologies like individual quick freezing (IQF) and modified atmosphere packaging (MAP) help extend the shelf life and maintain the nutritional value of the berries. New packaging techniques for blueberries, such as sliced berries and IQF, are gaining popularity in the market. These innovations cater to consumers' increasing demand for convenient and healthy food options. Blueberries are rich in antioxidants, making them a preferred choice for health-conscious consumers. The market is expected to continue growing due to the increasing awareness of their health benefits and the availability of new products and packaging technologies.

What challenges does the Blueberry Industry face during its growth?

  • The stringent food safety regulations pose a significant challenge to the industry's growth, requiring companies to invest heavily in compliance measures and adherence to rigorous standards. 
  • Blueberries are gaining popularity in the food and beverage industry due to their nutritional benefits. This trend has led to an increase in the use of blueberries as an active ingredient in various food and beverage products, including baked goods, juices, and beverages. However, the market for blueberry processing faces challenges in terms of food safety regulations. These regulations ensure the production of high-quality products while maintaining consumer health. Compliance with these regulations can increase manufacturing costs for food manufacturers. In the blueberry industry, both rabbiteye and southern highbush blueberries are commonly used. Blueberry pest control and disease management are crucial aspects of blueberry planting and cultivation.
  • Organic blueberry production is also gaining traction due to increasing consumer demand for organic food products. The organic production process requires specific farming practices and adherence to strict regulations. Blueberry fertilization is essential for optimal plant growth and yield. Despite these challenges, the demand for blueberries continues to grow, with applications extending beyond traditional food and beverage products to include cosmetics and pharmaceuticals. The blueberry industry associations play a vital role in promoting research and development, advocating for industry policies, and providing resources and education to members.

Exclusive Customer Landscape

The blueberry market forecasting report includes the adoption lifecycle of the market, covering from the innovator's stage to the laggard's stage. It focuses on adoption rates in different regions based on penetration. Furthermore, the blueberry market report also includes key purchase criteria and drivers of price sensitivity to help companies evaluate and develop their market growth analysis strategies.
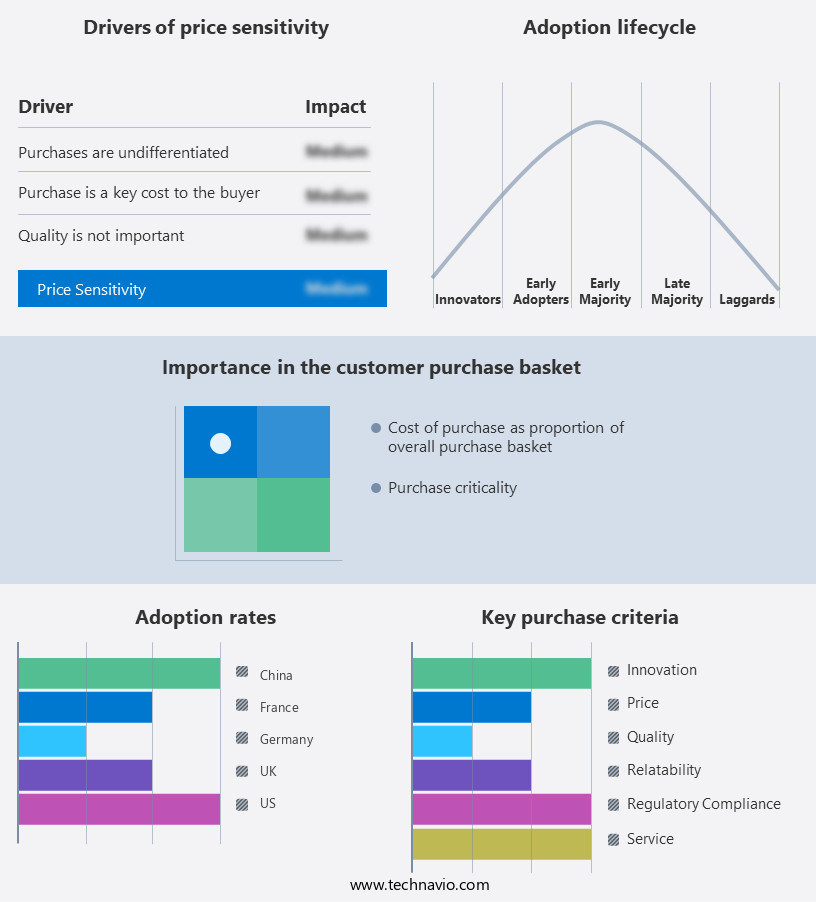
Blueberry Market Share by Geography

 Customer Landscape

Key Companies & Market Insights

Companies are implementing various strategies, such as strategic alliances, blueberry market forecast, partnerships, mergers and acquisitions, geographical expansion, and product/service launches, to enhance their presence in the industry.

AGRANA Beteiligungs-AG - The company specializes in providing top-tier blueberries in various forms, including fresh and frozen, to meet diverse consumer preferences and culinary applications. 

The industry research and growth report includes detailed analyses of the competitive landscape of the market and information about key companies, including:

  • AGRANA Beteiligungs-AG
  • Arctic Flavours Association
  • Ardo Coordination Center NV
  • Berry Plantation BETEC
  • BerryWorld Ltd.
  • Bio Botanica Inc.
  • BlueBerry LLC
  • Dealul cu Afine SRL
  • Dole plc
  • Driscolls Inc.
  • Earthbound Farm
  • Harbin Gaotai Food Co. Ltd.
  • Hortifrut SA
  • J.R. Simplot Co.
  • JWM Asia
  • MBG Marketing
  • Naturipe Berry Growers Inc.
  • Scenic Fruit Co.
  • SunOpta Inc.
  • Van Drunen Farms.

Qualitative and quantitative analysis of companies has been conducted to help clients understand the wider business environment as well as the strengths and weaknesses of key industry players. Data is qualitatively analyzed to categorize companies as pure play, category-focused, industry-focused, and diversified; it is quantitatively analyzed to categorize companies as dominant, leading, strong, tentative, and weak.

Recent Development and News in Blueberry Market

  • In January 2024, leading blueberry producer, Sunny Blueberries, announced a strategic partnership with Wholesome Harvest, a major distributor, to expand their reach in the US market (Sunny Blueberries Press Release, 2024).
  • In March 2024, OceanaBlue, a blueberry processing company, raised USD15 million in a Series B funding round, enabling them to expand their production capacity and strengthen their market position (OceanaBlue Press Release, 2024).
  • In April 2025, the European Union approved the import of blueberries from Canada under a new trade agreement, boosting prospects for Canadian blueberry exporters (European Commission Press Release, 2025).
  • In May 2025, Del Monte Fresh Produce N.A., Inc. Launched a new line of organic blueberries, responding to growing consumer demand for organic produce (Del Monte Fresh Produce N.A., Inc. Press Release, 2025).

Research Analyst Overview

  • The international market experiences dynamic shifts driven by global demand, agricultural technology, and environmental sustainability. Food safety and packaging innovations have become crucial in addressing consumer preferences for safe and high-quality produce. Fruit cultivation adapts to climate change impacts through advanced crop management techniques and plant breeding programs. Economic impact analysis reveals the significance of supply chain management in ensuring food security and efficient distribution. Nutritional value, food regulations, and antioxidant properties contribute to the market's growth. Sustainable agriculture practices, such as organic farming and integrated pest management, are increasingly adopted to meet consumer demands.
  • Food preservation and food processing technologies enhance the shelf life of blueberries, while food labeling transparency fosters trust among consumers. Agricultural research and soil science continue to play essential roles in improving berry production and addressing food safety standards. Genetic engineering and plant science advancements offer opportunities for innovation in the market.

Dive into Technavio's robust research methodology, blending expert interviews, extensive data synthesis, and validated models for unparalleled Blueberry Market insights. See full methodology.

Market Scope

Report Coverage

Details

Page number

205

Base year

2024

Historic period

2019-2023

Forecast period

2025-2029

Growth momentum & CAGR

Accelerate at a CAGR of 7.1%

Market growth 2025-2029

USD 3055 million

Market structure

Fragmented

YoY growth 2024-2025(%)

6.5

Key countries

US, Canada, Germany, France, China, Italy, Spain, Japan, UK, and South Korea

Competitive landscape

Leading Companies, Market Positioning of Companies, Competitive Strategies, and Industry Risks

Request Free Sample

What are the Key Data Covered in this Blueberry Market Research and Growth Report?

  • CAGR of the Blueberry industry during the forecast period
  • Detailed information on factors that will drive the growth and forecasting between 2025 and 2029
  • Precise estimation of the size of the market and its contribution of the industry in focus to the parent market
  • Accurate predictions about upcoming growth and trends and changes in consumer behaviour
  • Growth of the market across North America, Europe, APAC, South America, and Middle East and Africa
  • Thorough analysis of the market's competitive landscape and detailed information about companies
  • Comprehensive analysis of factors that will challenge the blueberry market growth of industry companies

We can help! Our analysts can customize this blueberry market research report to meet your requirements.

Get in touch

1 Executive Summary

  • 1.1 Market overview
    • Executive Summary - Chart on Market Overview
    • Executive Summary - Data Table on Market Overview
    • Executive Summary - Chart on Global Market Characteristics
    • Executive Summary - Chart on Market by Geography
    • Executive Summary - Chart on Market Segmentation by Application
    • Executive Summary - Chart on Market Segmentation by Type
    • Executive Summary - Chart on Market Segmentation by Product
    • Executive Summary - Chart on Incremental Growth
    • Executive Summary - Data Table on Incremental Growth
    • Executive Summary - Chart on Company Market Positioning

2 Technavio Analysis

  • 2.1 Analysis of price sensitivity, lifecycle, customer purchase basket, adoption rates, and purchase criteria
    • Analysis of price sensitivity, lifecycle, customer purchase basket, adoption rates, and purchase criteria
  • 2.2 Criticality of inputs and Factors of differentiation
    • Overview on criticality of inputs and factors of differentiation
  • 2.3 Factors of disruption
    • Overview on factors of disruption
  • 2.4 Impact of drivers and challenges
    • Impact of drivers and challenges in 2024 and 2029

3 Market Landscape

  • 3.1 Market ecosystem
    • Parent Market
    • Data Table on - Parent Market
  • 3.2 Market characteristics
    • Market characteristics analysis
  • 3.3 Value chain analysis
    • Value chain analysis

4 Market Sizing

  • 4.1 Market definition
    • Offerings of companies included in the market definition
  • 4.2 Market segment analysis
    • Market segments
  • 4.3 Market size 2024
    • 4.4 Market outlook: Forecast for 2024-2029
      • Chart on Global - Market size and forecast 2024-2029 ($ million)
      • Data Table on Global - Market size and forecast 2024-2029 ($ million)
      • Chart on Global Market: Year-over-year growth 2024-2029 (%)
      • Data Table on Global Market: Year-over-year growth 2024-2029 (%)

    5 Historic Market Size

    • 5.1 Global Blueberry Market 2019 - 2023
      • Historic Market Size - Data Table on Global Blueberry Market 2019 - 2023 ($ million)
    • 5.2 Application segment analysis 2019 - 2023
      • Historic Market Size - Application Segment 2019 - 2023 ($ million)
    • 5.3 Type segment analysis 2019 - 2023
      • Historic Market Size - Type Segment 2019 - 2023 ($ million)
    • 5.4 Product segment analysis 2019 - 2023
      • Historic Market Size - Product Segment 2019 - 2023 ($ million)
    • 5.5 Geography segment analysis 2019 - 2023
      • Historic Market Size - Geography Segment 2019 - 2023 ($ million)
    • 5.6 Country segment analysis 2019 - 2023
      • Historic Market Size - Country Segment 2019 - 2023 ($ million)

    6 Qualitative Analysis

    • 6.1 Impact of AI on Global Blueberry Market

      7 Five Forces Analysis

      • 7.1 Five forces summary
        • Five forces analysis - Comparison between 2024 and 2029
      • 7.2 Bargaining power of buyers
        • Bargaining power of buyers - Impact of key factors 2024 and 2029
      • 7.3 Bargaining power of suppliers
        • Bargaining power of suppliers - Impact of key factors in 2024 and 2029
      • 7.4 Threat of new entrants
        • Threat of new entrants - Impact of key factors in 2024 and 2029
      • 7.5 Threat of substitutes
        • Threat of substitutes - Impact of key factors in 2024 and 2029
      • 7.6 Threat of rivalry
        • Threat of rivalry - Impact of key factors in 2024 and 2029
      • 7.7 Market condition
        • Chart on Market condition - Five forces 2024 and 2029

      8 Market Segmentation by Application

      • 8.1 Market segments
        • Chart on Application - Market share 2024-2029 (%)
        • Data Table on Application - Market share 2024-2029 (%)
      • 8.2 Comparison by Application
        • Chart on Comparison by Application
        • Data Table on Comparison by Application
      • 8.3 Food and beverages - Market size and forecast 2024-2029
        • Chart on Food and beverages - Market size and forecast 2024-2029 ($ million)
        • Data Table on Food and beverages - Market size and forecast 2024-2029 ($ million)
        • Chart on Food and beverages - Year-over-year growth 2024-2029 (%)
        • Data Table on Food and beverages - Year-over-year growth 2024-2029 (%)
      • 8.4 Bakery and confectionary - Market size and forecast 2024-2029
        • Chart on Bakery and confectionary - Market size and forecast 2024-2029 ($ million)
        • Data Table on Bakery and confectionary - Market size and forecast 2024-2029 ($ million)
        • Chart on Bakery and confectionary - Year-over-year growth 2024-2029 (%)
        • Data Table on Bakery and confectionary - Year-over-year growth 2024-2029 (%)
      • 8.5 Others - Market size and forecast 2024-2029
        • Chart on Others - Market size and forecast 2024-2029 ($ million)
        • Data Table on Others - Market size and forecast 2024-2029 ($ million)
        • Chart on Others - Year-over-year growth 2024-2029 (%)
        • Data Table on Others - Year-over-year growth 2024-2029 (%)
      • 8.6 Market opportunity by Application
        • Market opportunity by Application ($ million)
        • Data Table on Market opportunity by Application ($ million)

      9 Market Segmentation by Type

      • 9.1 Market segments
        • Chart on Type - Market share 2024-2029 (%)
        • Data Table on Type - Market share 2024-2029 (%)
      • 9.2 Comparison by Type
        • Chart on Comparison by Type
        • Data Table on Comparison by Type
      • 9.3 Organic - Market size and forecast 2024-2029
        • Chart on Organic - Market size and forecast 2024-2029 ($ million)
        • Data Table on Organic - Market size and forecast 2024-2029 ($ million)
        • Chart on Organic - Year-over-year growth 2024-2029 (%)
        • Data Table on Organic - Year-over-year growth 2024-2029 (%)
      • 9.4 Conventional - Market size and forecast 2024-2029
        • Chart on Conventional - Market size and forecast 2024-2029 ($ million)
        • Data Table on Conventional - Market size and forecast 2024-2029 ($ million)
        • Chart on Conventional - Year-over-year growth 2024-2029 (%)
        • Data Table on Conventional - Year-over-year growth 2024-2029 (%)
      • 9.5 Market opportunity by Type
        • Market opportunity by Type ($ million)
        • Data Table on Market opportunity by Type ($ million)

      10 Market Segmentation by Product

      • 10.1 Market segments
        • Chart on Product - Market share 2024-2029 (%)
        • Data Table on Product - Market share 2024-2029 (%)
      • 10.2 Comparison by Product
        • Chart on Comparison by Product
        • Data Table on Comparison by Product
      • 10.3 Fresh - Market size and forecast 2024-2029
        • Chart on Fresh - Market size and forecast 2024-2029 ($ million)
        • Data Table on Fresh - Market size and forecast 2024-2029 ($ million)
        • Chart on Fresh - Year-over-year growth 2024-2029 (%)
        • Data Table on Fresh - Year-over-year growth 2024-2029 (%)
      • 10.4 Frozen - Market size and forecast 2024-2029
        • Chart on Frozen - Market size and forecast 2024-2029 ($ million)
        • Data Table on Frozen - Market size and forecast 2024-2029 ($ million)
        • Chart on Frozen - Year-over-year growth 2024-2029 (%)
        • Data Table on Frozen - Year-over-year growth 2024-2029 (%)
      • 10.5 Dried - Market size and forecast 2024-2029
        • Chart on Dried - Market size and forecast 2024-2029 ($ million)
        • Data Table on Dried - Market size and forecast 2024-2029 ($ million)
        • Chart on Dried - Year-over-year growth 2024-2029 (%)
        • Data Table on Dried - Year-over-year growth 2024-2029 (%)
      • 10.6 Market opportunity by Product
        • Market opportunity by Product ($ million)
        • Data Table on Market opportunity by Product ($ million)

      11 Customer Landscape

      • 11.1 Customer landscape overview
        • Analysis of price sensitivity, lifecycle, customer purchase basket, adoption rates, and purchase criteria

      12 Geographic Landscape

      • 12.1 Geographic segmentation
        • Chart on Market share by geography 2024-2029 (%)
        • Data Table on Market share by geography 2024-2029 (%)
      • 12.2 Geographic comparison
        • Chart on Geographic comparison
        • Data Table on Geographic comparison
      • 12.3 North America - Market size and forecast 2024-2029
        • Chart on North America - Market size and forecast 2024-2029 ($ million)
        • Data Table on North America - Market size and forecast 2024-2029 ($ million)
        • Chart on North America - Year-over-year growth 2024-2029 (%)
        • Data Table on North America - Year-over-year growth 2024-2029 (%)
      • 12.4 Europe - Market size and forecast 2024-2029
        • Chart on Europe - Market size and forecast 2024-2029 ($ million)
        • Data Table on Europe - Market size and forecast 2024-2029 ($ million)
        • Chart on Europe - Year-over-year growth 2024-2029 (%)
        • Data Table on Europe - Year-over-year growth 2024-2029 (%)
      • 12.5 APAC - Market size and forecast 2024-2029
        • Chart on APAC - Market size and forecast 2024-2029 ($ million)
        • Data Table on APAC - Market size and forecast 2024-2029 ($ million)
        • Chart on APAC - Year-over-year growth 2024-2029 (%)
        • Data Table on APAC - Year-over-year growth 2024-2029 (%)
      • 12.6 South America - Market size and forecast 2024-2029
        • Chart on South America - Market size and forecast 2024-2029 ($ million)
        • Data Table on South America - Market size and forecast 2024-2029 ($ million)
        • Chart on South America - Year-over-year growth 2024-2029 (%)
        • Data Table on South America - Year-over-year growth 2024-2029 (%)
      • 12.7 Middle East and Africa - Market size and forecast 2024-2029
        • Chart on Middle East and Africa - Market size and forecast 2024-2029 ($ million)
        • Data Table on Middle East and Africa - Market size and forecast 2024-2029 ($ million)
        • Chart on Middle East and Africa - Year-over-year growth 2024-2029 (%)
        • Data Table on Middle East and Africa - Year-over-year growth 2024-2029 (%)
      • 12.8 US - Market size and forecast 2024-2029
        • Chart on US - Market size and forecast 2024-2029 ($ million)
        • Data Table on US - Market size and forecast 2024-2029 ($ million)
        • Chart on US - Year-over-year growth 2024-2029 (%)
        • Data Table on US - Year-over-year growth 2024-2029 (%)
      • 12.9 Canada - Market size and forecast 2024-2029
        • Chart on Canada - Market size and forecast 2024-2029 ($ million)
        • Data Table on Canada - Market size and forecast 2024-2029 ($ million)
        • Chart on Canada - Year-over-year growth 2024-2029 (%)
        • Data Table on Canada - Year-over-year growth 2024-2029 (%)
      • 12.10 Germany - Market size and forecast 2024-2029
        • Chart on Germany - Market size and forecast 2024-2029 ($ million)
        • Data Table on Germany - Market size and forecast 2024-2029 ($ million)
        • Chart on Germany - Year-over-year growth 2024-2029 (%)
        • Data Table on Germany - Year-over-year growth 2024-2029 (%)
      • 12.11 France - Market size and forecast 2024-2029
        • Chart on France - Market size and forecast 2024-2029 ($ million)
        • Data Table on France - Market size and forecast 2024-2029 ($ million)
        • Chart on France - Year-over-year growth 2024-2029 (%)
        • Data Table on France - Year-over-year growth 2024-2029 (%)
      • 12.12 China - Market size and forecast 2024-2029
        • Chart on China - Market size and forecast 2024-2029 ($ million)
        • Data Table on China - Market size and forecast 2024-2029 ($ million)
        • Chart on China - Year-over-year growth 2024-2029 (%)
        • Data Table on China - Year-over-year growth 2024-2029 (%)
      • 12.13 Spain - Market size and forecast 2024-2029
        • Chart on Spain - Market size and forecast 2024-2029 ($ million)
        • Data Table on Spain - Market size and forecast 2024-2029 ($ million)
        • Chart on Spain - Year-over-year growth 2024-2029 (%)
        • Data Table on Spain - Year-over-year growth 2024-2029 (%)
      • 12.14 Italy - Market size and forecast 2024-2029
        • Chart on Italy - Market size and forecast 2024-2029 ($ million)
        • Data Table on Italy - Market size and forecast 2024-2029 ($ million)
        • Chart on Italy - Year-over-year growth 2024-2029 (%)
        • Data Table on Italy - Year-over-year growth 2024-2029 (%)
      • 12.15 Japan - Market size and forecast 2024-2029
        • Chart on Japan - Market size and forecast 2024-2029 ($ million)
        • Data Table on Japan - Market size and forecast 2024-2029 ($ million)
        • Chart on Japan - Year-over-year growth 2024-2029 (%)
        • Data Table on Japan - Year-over-year growth 2024-2029 (%)
      • 12.16 UK - Market size and forecast 2024-2029
        • Chart on UK - Market size and forecast 2024-2029 ($ million)
        • Data Table on UK - Market size and forecast 2024-2029 ($ million)
        • Chart on UK - Year-over-year growth 2024-2029 (%)
        • Data Table on UK - Year-over-year growth 2024-2029 (%)
      • 12.17 South Korea - Market size and forecast 2024-2029
        • Chart on South Korea - Market size and forecast 2024-2029 ($ million)
        • Data Table on South Korea - Market size and forecast 2024-2029 ($ million)
        • Chart on South Korea - Year-over-year growth 2024-2029 (%)
        • Data Table on South Korea - Year-over-year growth 2024-2029 (%)
      • 12.18 Market opportunity by geography
        • Market opportunity by geography ($ million)
        • Data Tables on Market opportunity by geography ($ million)

      13 Drivers, Challenges, and Opportunity/Restraints

      • 13.1 Market drivers
        • 13.2 Market challenges
          • 13.3 Impact of drivers and challenges
            • Impact of drivers and challenges in 2024 and 2029
          • 13.4 Market opportunities/restraints

            14 Competitive Landscape

            • 14.1 Overview
              • 14.2 Competitive Landscape
                • Overview on criticality of inputs and factors of differentiation
              • 14.3 Landscape disruption
                • Overview on factors of disruption
              • 14.4 Industry risks
                • Impact of key risks on business

              15 Competitive Analysis

              • 15.1 Companies profiled
                • Companies covered
              • 15.2 Company ranking index
                • Company ranking index
              • 15.3 Market positioning of companies
                • Matrix on companies position and classification
              • 15.4 AGRANA Beteiligungs-AG
                • AGRANA Beteiligungs-AG - Overview
                • AGRANA Beteiligungs-AG - Business segments
                • AGRANA Beteiligungs-AG - Key news
                • AGRANA Beteiligungs-AG - Key offerings
                • AGRANA Beteiligungs-AG - Segment focus
                • SWOT
              • 15.5 Arctic Flavours Association
                • Arctic Flavours Association - Overview
                • Arctic Flavours Association - Product / Service
                • Arctic Flavours Association - Key offerings
                • SWOT
              • 15.6 Ardo Coordination Center NV
                • Ardo Coordination Center NV - Overview
                • Ardo Coordination Center NV - Product / Service
                • Ardo Coordination Center NV - Key offerings
                • SWOT
              • 15.7 BerryWorld Ltd.
                • BerryWorld Ltd. - Overview
                • BerryWorld Ltd. - Product / Service
                • BerryWorld Ltd. - Key offerings
                • SWOT
              • 15.8 Bio Botanica Inc.
                • Bio Botanica Inc. - Overview
                • Bio Botanica Inc. - Product / Service
                • Bio Botanica Inc. - Key offerings
                • SWOT
              • 15.9 Dole plc
                • Dole plc - Overview
                • Dole plc - Business segments
                • Dole plc - Key offerings
                • Dole plc - Segment focus
                • SWOT
              • 15.10 Driscolls Inc.
                • Driscolls Inc. - Overview
                • Driscolls Inc. - Product / Service
                • Driscolls Inc. - Key offerings
                • SWOT
              • 15.11 Earthbound Farm
                • Earthbound Farm - Overview
                • Earthbound Farm - Product / Service
                • Earthbound Farm - Key offerings
                • SWOT
              • 15.12 Harbin Gaotai Food Co. Ltd.
                • Harbin Gaotai Food Co. Ltd. - Overview
                • Harbin Gaotai Food Co. Ltd. - Product / Service
                • Harbin Gaotai Food Co. Ltd. - Key offerings
                • SWOT
              • 15.13 Hortifrut SA
                • Hortifrut SA - Overview
                • Hortifrut SA - Business segments
                • Hortifrut SA - Key offerings
                • Hortifrut SA - Segment focus
                • SWOT
              • 15.14 J.R. Simplot Co.
                • J.R. Simplot Co. - Overview
                • J.R. Simplot Co. - Product / Service
                • J.R. Simplot Co. - Key offerings
                • SWOT
              • 15.15 JWM Asia
                • JWM Asia - Overview
                • JWM Asia - Product / Service
                • JWM Asia - Key offerings
                • SWOT
              • 15.16 Scenic Fruit Co.
                • Scenic Fruit Co. - Overview
                • Scenic Fruit Co. - Product / Service
                • Scenic Fruit Co. - Key offerings
                • SWOT
              • 15.17 SunOpta Inc.
                • SunOpta Inc. - Overview
                • SunOpta Inc. - Business segments
                • SunOpta Inc. - Key news
                • SunOpta Inc. - Key offerings
                • SunOpta Inc. - Segment focus
                • SWOT
              • 15.18 Van Drunen Farms.
                • Van Drunen Farms. - Overview
                • Van Drunen Farms. - Product / Service
                • Van Drunen Farms. - Key offerings
                • SWOT

              16 Appendix

              • 16.1 Scope of the report
                • 16.2 Inclusions and exclusions checklist
                  • Inclusions checklist
                  • Exclusions checklist
                • 16.3 Currency conversion rates for US$
                  • Currency conversion rates for US$
                • 16.4 Research methodology
                  • Research methodology
                • 16.5 Data procurement
                  • Information sources
                • 16.6 Data validation
                  • Data validation
                • 16.7 Validation techniques employed for market sizing
                  • Validation techniques employed for market sizing
                • 16.8 Data synthesis
                  • Data synthesis
                • 16.9 360 degree market analysis
                  • 360 degree market analysis
                • 16.10 List of abbreviations
                  • List of abbreviations

                Research Methodology

                Technavio presents a detailed picture of the market by way of study, synthesis, and summation of data from multiple sources. The analysts have presented the various facets of the market with a particular focus on identifying the key industry influencers. The data thus presented is comprehensive, reliable, and the result of extensive research, both primary and secondary.

                INFORMATION SOURCES

                Primary sources

                • Manufacturers and suppliers
                • Channel partners
                • Industry experts
                • Strategic decision makers

                Secondary sources

                • Industry journals and periodicals
                • Government data
                • Financial reports of key industry players
                • Historical data
                • Press releases

                DATA ANALYSIS

                Data Synthesis

                • Collation of data
                • Estimation of key figures
                • Analysis of derived insights

                Data Validation

                • Triangulation with data models
                • Reference against proprietary databases
                • Corroboration with industry experts

                REPORT WRITING

                Qualitative

                • Market drivers
                • Market challenges
                • Market trends
                • Five forces analysis

                Quantitative

                • Market size and forecast
                • Market segmentation
                • Geographical insights
                • Competitive landscape

                Interested in this report?

                Get your sample now to see our research methodology and insights!

                Download Now

                Frequently Asked Questions

                Blueberry market growth will increase by $ 3055 mn during 2025-2029.

                The Blueberry market is expected to grow at a CAGR of 7.1% during 2025-2029.

                Blueberry market is segmented by Application( Food and beverages, Bakery and confectionary, Others) Type( Organic, Conventional) Product( Fresh, Frozen, Dried)

                AGRANA Beteiligungs-AG, Arctic Flavours Association, Ardo Coordination Center NV, Berry Plantation BETEC, BerryWorld Ltd., Bio Botanica Inc., BlueBerry LLC, Dealul cu Afine SRL, Dole plc, Driscolls Inc., Earthbound Farm, Harbin Gaotai Food Co. Ltd., Hortifrut SA, J.R. Simplot Co., JWM Asia, MBG Marketing, Naturipe Berry Growers Inc., Scenic Fruit Co., SunOpta Inc., Van Drunen Farms. are a few of the key vendors in the Blueberry market.

                North America will register the highest growth rate of 31% among the other regions. Therefore, the Blueberry market in North America is expected to garner significant business opportunities for the vendors during the forecast period.

                US, Canada, Germany, France, China, Italy, Spain, Japan, UK, South Korea

                • Growing penetration of online retailing and e-commerceAll the major vendors of blueberries are using online channels to market and inform potential users of the usefulness of blueberries and their products. The increasing use of online channels offers vendors the freedom to deliver from a central garden or plantation globally. Online retailing can act as a channel of communication to educate about the benefits and use of the plant is the driving factor this market.
                • owing to the increased global reach of vendors and rising health consciousness among consumers. The growing adoption of a healthy lifestyle has led to the adoption of nutrition-based diets by individuals is the driving factor this market.
                • as well as the consumption of various supplements. Awareness related to plant-based diets is the driving factor this market.
                • including superfoods and superfruits is the driving factor this market.
                • is also increasing. Thus is the driving factor this market.
                • the beneficial properties of blueberries have made them a popular choice among dietary supplement makers. Therefore is the driving factor this market.
                • with increased visibility in online platforms and social media such as Facebook is the driving factor this market.
                • consumers and vendors are made aware of the potential health benefits and commercial potential of blueberries. Also is the driving factor this market.
                • these retail platforms offer a quick way to introduce newer applications of blueberries and their products and a good channel to generate repeat sales from loyal customers. Thus is the driving factor this market.
                • the increasing use of e-commerce is the driving factor this market.
                • social media is the driving factor this market.
                • and online retailing is expected to increase the awareness of potential customers toward blueberries is the driving factor this market.
                • thereby driving the growth of the global blueberry market during the forecast period. is the driving factor this market.

                The Blueberry market vendors should focus on grabbing business opportunities from the Food and beverages segment as it accounted for the largest market share in the base year.