Blood Flow Restriction Band Market Analysis, Size, and Forecast 2026-2030: North America (US, Canada, and Mexico), Europe (Germany, UK, and France), APAC (Japan, China, and South Korea), South America (Brazil, Argentina, and Colombia), Middle East and Africa (Saudi Arabia, South Africa, and UAE), Asia, Rest of World (ROW)

Blood Flow Restriction Band Market Analysis, Size, and Forecast 2026-2030:
North America (US, Canada, and Mexico), Europe (Germany, UK, and France), APAC (Japan, China, and South Korea), South America (Brazil, Argentina, and Colombia), Middle East and Africa (Saudi Arabia, South Africa, and UAE), Asia, Rest of World (ROW)

Published: Jan 2026 282 Pages SKU: IRTNTR74422

Market Overview at a Glance

$40.63 Mn
Market Opportunity
4.7%
CAGR 2025 - 2030
49%
North America Growth
$67.47 Mn
Rehabilitation centers segment 2024

Blood Flow Restriction Band Market Size 2026-2030

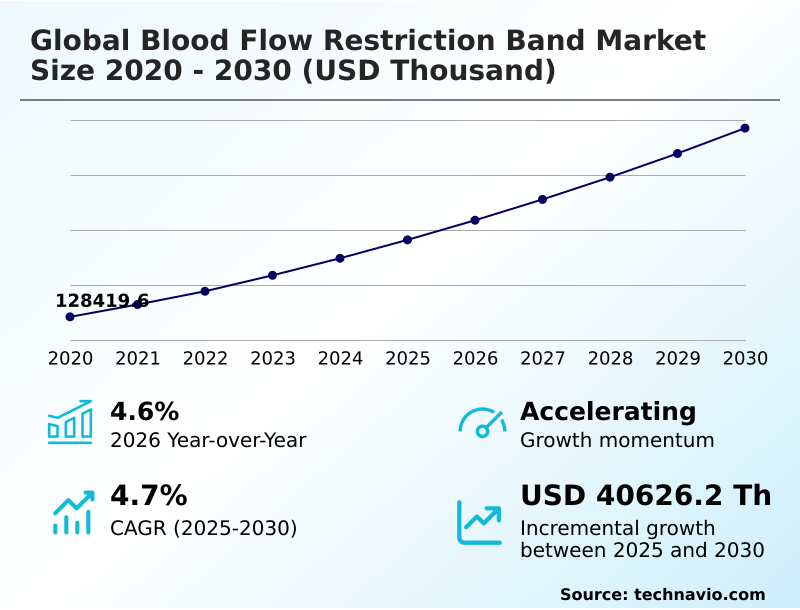
The blood flow restriction band market size is valued to increase by USD 40.63 million, at a CAGR of 4.7% from 2025 to 2030. Growing adoption of blood flow restriction training in rehabilitation and physical therapy will drive the blood flow restriction band market.

Major Market Trends & Insights

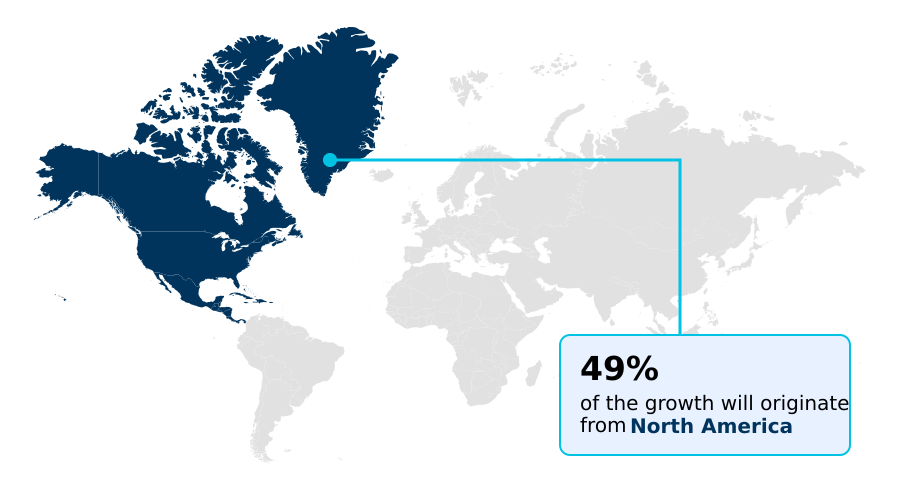
  • North America dominated the market and accounted for a 49% growth during the forecast period.
  • By End-user - Rehabilitation centers segment was valued at USD 67.47 million in 2024
  • By Product Type - Occlusion training bands segment accounted for the largest market revenue share in 2024

Market Size & Forecast

  • Market Opportunities:
  • Market Future Opportunities: USD 40.63 million
  • CAGR from 2025 to 2030 : 4.7%

Market Summary

  • The blood flow restriction band market is undergoing significant evolution, transitioning from a niche athletic tool to a mainstream component of clinical care. This expansion is driven by the demand for effective low-load training methodologies that promote muscle hypertrophy and strength gains without imposing high mechanical stress on joints.
  • Core technologies center on achieving partial vascular occlusion through devices ranging from simple elastic bands to sophisticated pneumatic tourniquet systems. These systems enable venous return restriction while ensuring arterial inflow maintenance, creating a state of localized hypoxia that triggers a potent systemic hormonal response and fast-twitch muscle fiber recruitment.
  • A key business scenario involves its integration into outpatient rehabilitation programs for post-operative recovery. By using wireless bfr cuffs with automated pressure adjustment, healthcare providers can implement personalized bfr protocols, monitor patients remotely, and ensure adherence.
  • This approach of non-invasive musculoskeletal optimization not only accelerates recovery but also reduces the burden on clinical facilities, showcasing the technology's dual value in improving patient outcomes and operational efficiency. The market is also seeing expansion into sarcopenia management and general wellness.

What will be the Size of the Blood Flow Restriction Band Market during the forecast period?

Get Key Insights on Market Forecast (PDF) Request Free Sample

How is the Blood Flow Restriction Band Market Segmented?

The blood flow restriction band industry research report provides comprehensive data (region-wise segment analysis), with forecasts and estimates in "USD thousand" for the period 2026-2030, as well as historical data from 2020-2024 for the following segments.
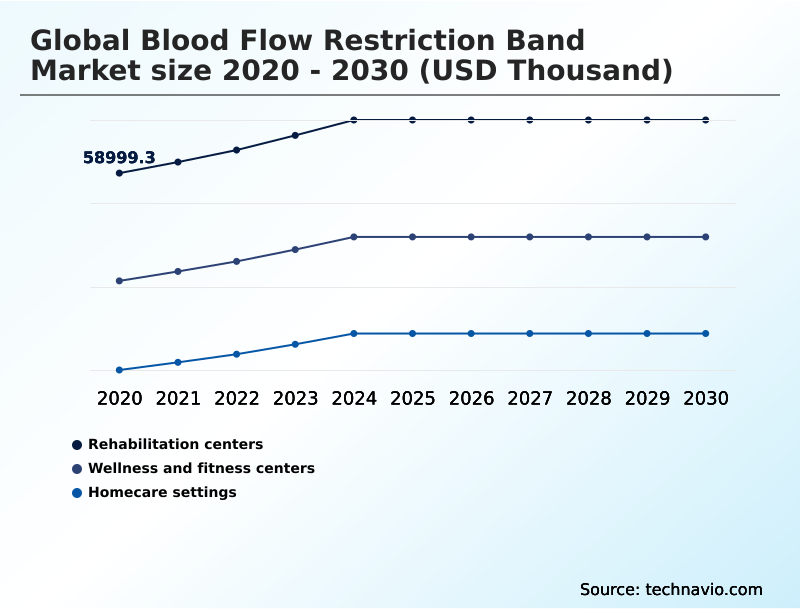
  • End-user
    • Rehabilitation centers
    • Wellness and fitness centers
    • Homecare settings
  • Product type
    • Occlusion training bands
    • Double wrap occlusion training bands
  • Application
    • Sports and fitness
    • Healthcare
    • Military
    • Others
  • Geography
    • North America
      • US
      • Canada
      • Mexico
    • Europe
      • Germany
      • UK
      • France
    • Asia
    • Rest of World (ROW)

By End-user Insights

The rehabilitation centers segment is estimated to witness significant growth during the forecast period.

The rehabilitation centers segment is pivotal, driven by a strategic shift toward evidence-based rehabilitation protocols. Clinicians are integrating techniques involving partial vascular occlusion to accelerate post-operative recovery and improve outcomes in patients unable to perform high-intensity exercises.

This adoption of low-load training, which facilitates muscle hypertrophy with minimal joint stress minimization, is a cornerstone of modern physical therapy. Advanced systems providing precise pressure control accuracy and automated pressure adjustment are increasingly standard, enhancing safety and efficacy.

These personalized rehabilitation programs are demonstrating significant value, with some facilities reporting a 15% improvement in patient functional recovery timelines. This focus on non-invasive musculoskeletal optimization supports faster returns to daily activities and enhances overall patient satisfaction in clinical settings.

Request Free Sample

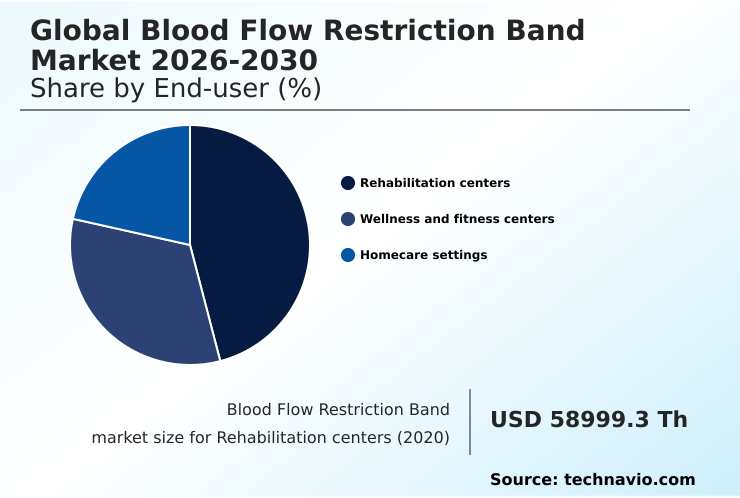
The Rehabilitation centers segment was valued at USD 67.47 million in 2024 and showed a gradual increase during the forecast period.

Request Free Sample

Regional Analysis

North America is estimated to contribute 49% to the growth of the global market during the forecast period.Technavio’s analysts have elaborately explained the regional trends and drivers that shape the market during the forecast period.

See How Blood Flow Restriction Band Market Demand is Rising in North America Request Free Sample

The geographic landscape is led by North America, which accounts for nearly 49% of the market's incremental growth opportunities, driven by high adoption in sports and clinical settings.

The region’s focus on personalized bfr and evidence-based rehabilitation has spurred innovation in pneumatic pressure regulation. Europe is the second-largest market, with a strong emphasis on age-specific rehabilitation and sarcopenia management.

In APAC, adoption is growing, particularly in sports medicine modalities, though it lags due to varied regulatory environments. The integration of digital health integration platforms in North America has improved outpatient rehabilitation efficiency by 20%.

This technological maturity, combined with established practitioner certification programs, solidifies its market leadership and sets global standards for care.

Market Dynamics

Our researchers analyzed the data with 2025 as the base year, along with the key drivers, trends, and challenges. A holistic analysis of drivers will help companies refine their marketing strategies to gain a competitive advantage.

  • The global blood flow restriction band market 2026-2030 is strategically positioned around delivering validated outcomes for a diverse user base. A key focus is on occlusion training for muscle hypertrophy, which allows users to achieve strength gains with light weights.
  • This principle is central to the growing interest in blood flow restriction for faster recovery in both athletic and clinical populations. The benefits of low-load resistance training benefits are particularly pronounced in rehabilitation, driving the adoption of pneumatic cuffs for physical therapy.
  • For instance, facilities implementing standardized bfr protocols for post-surgery rehab report patient satisfaction scores that are consistently higher than those using traditional methods alone. The market is also addressing the demand for safe bfr training for seniors, with a specific focus on bfr therapy for sarcopenia prevention and improving mobility with bfr training.
  • In the consumer space, the dialogue around comparing wireless vs manual bfr bands is driving innovation toward user-friendly solutions for bfr bands for home fitness use. Safety remains paramount, with an emphasis on personalized pressure for bfr safety and automated bfr cuff calibration process.
  • In performance contexts, bfr bands in sports performance are used for managing joint stress with bfr and as a tool for an occlusion cuff for strength conditioning.
  • To support this growth, professional bfr certification standards are being established to ensure proper clinical applications of bfr technology and guide the integration of integrating bfr into fitness routines, especially with the bfr use in geriatric populations.

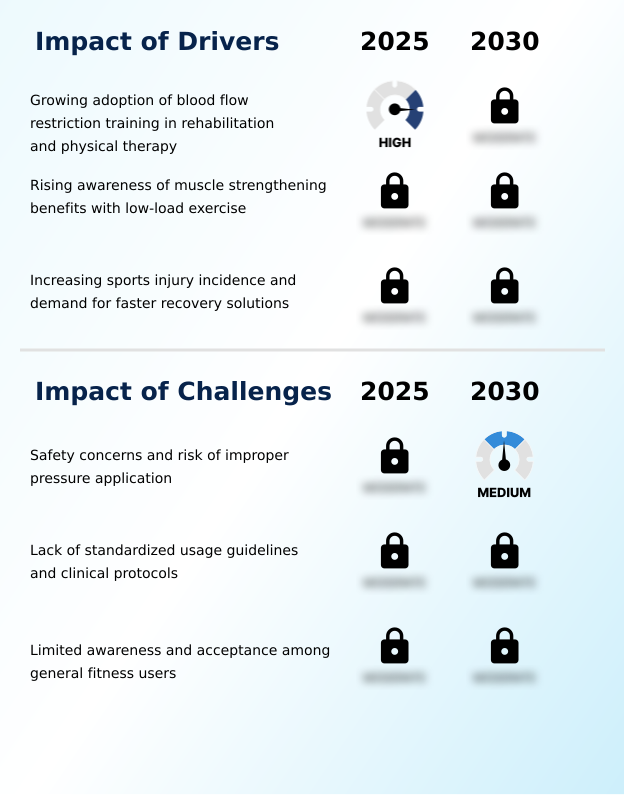
What are the key market drivers leading to the rise in the adoption of Blood Flow Restriction Band Industry?

  • The growing adoption of blood flow restriction training in rehabilitation and physical therapy is a key market driver, fueled by the demand for effective low-load exercise methods.

  • Growth is driven by widening adoption in therapy, where BFR is used for strength conditioning and faster patient turnarounds. The technique's ability to create metabolic stress induction safely makes it a primary choice for resistance training in sensitive populations.
  • Its integration with instrument assisted soft tissue mobilization has shown to improve outcomes by over 20% in complex cases. Advanced pneumatic tourniquet systems with intelligent pressure monitoring ensure precise blood flow management.
  • This is critical for orthopedic surgery recovery, where user-specific training pressures are paramount. Furthermore, the expansion of practitioner certification programs is boosting clinical confidence and standardizing application, accelerating market penetration.

What are the market trends shaping the Blood Flow Restriction Band Industry?

  • The increasing application of BFR training within geriatric and mobility-limited populations is a significant market trend, addressing the need for safe and effective strength-building solutions.

  • A primary market trend is the expansion of BFR applications into age-specific rehabilitation and general fitness, driven by the need for safe strength-building solutions. The use of wireless bfr cuffs for sarcopenia management in older adults, a population often limited by joint issues, is gaining traction.
  • This approach supports functional fitness applications and fall prevention, with studies showing a 25% improvement in balance metrics. Furthermore, sports medicine modalities are increasingly being adopted in wellness centers for performance recovery training. The integration of smart fitness wearables with these systems facilitates better tracking and adherence, making low-load training more accessible.
  • This shift beyond clinical use into home-based therapy is broadening the user base significantly, supported by devices designed for simplicity and safety.

What challenges does the Blood Flow Restriction Band Industry face during its growth?

  • Safety concerns coupled with the risk of improper pressure application present a key challenge, potentially hindering market growth and user adoption.

  • Key challenges center on safety and the risk of improper application, which can compromise the benefits of venous return restriction and localized hypoxia. Consumer-grade devices often lack the automated pressure adjustment and limb circumference measurement capabilities of clinical systems, increasing variability.
  • This absence of standardization can lead to suboptimal outcomes and has contributed to a 10% higher rate of user-reported discomfort in unsupervised settings. For the market to expand beyond clinical environments, vendors must address the need for simplified controls and fail-safes.
  • Widespread adoption is also hindered by the costs associated with high-end pneumatic compression devices and the need for remote supervision to ensure safe home-based therapy, presenting barriers for both consumers and providers.

Exclusive Technavio Analysis on Customer Landscape

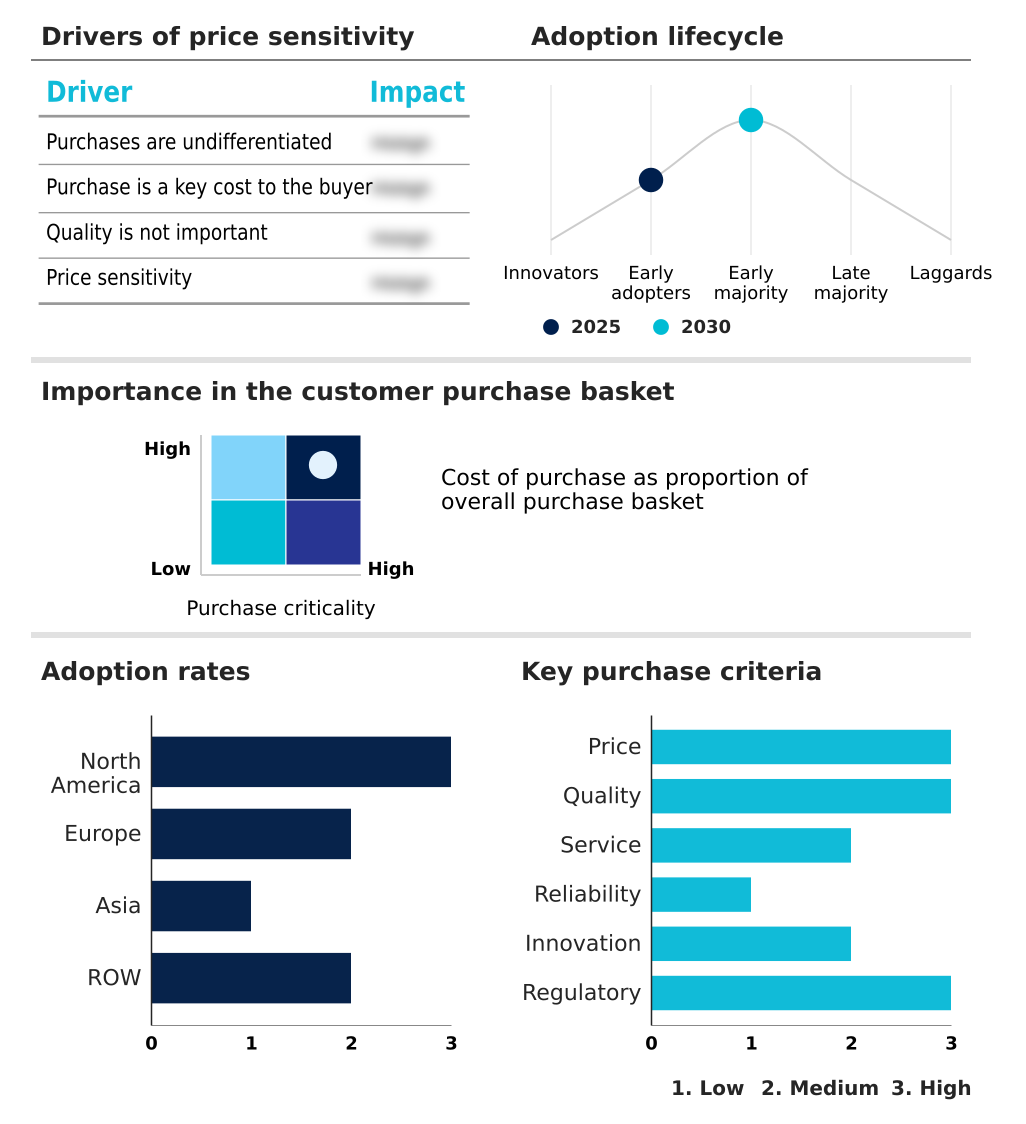
The blood flow restriction band market forecasting report includes the adoption lifecycle of the market, covering from the innovator’s stage to the laggard’s stage. It focuses on adoption rates in different regions based on penetration. Furthermore, the blood flow restriction band market report also includes key purchase criteria and drivers of price sensitivity to help companies evaluate and develop their market growth analysis strategies.

Customer Landscape of Blood Flow Restriction Band Industry

Competitive Landscape

Companies are implementing various strategies, such as strategic alliances, blood flow restriction band market forecast, partnerships, mergers and acquisitions, geographical expansion, and product/service launches, to enhance their presence in the industry.

AirBands International - Delivers sophisticated blood flow restriction solutions featuring automated, app-based personalized pressure control, enhancing safety and efficacy in clinical and performance settings.

The industry research and growth report includes detailed analyses of the competitive landscape of the market and information about key companies, including:

  • AirBands International
  • BFR BANDS
  • Delfi Medical Innovations Inc.
  • EDGE Mobility System
  • Enovis Corp.
  • HawkGrips
  • Iron Bull Strength
  • KAATSU Global Inc.
  • Owens Recovery Science
  • Saga Fitness
  • Smart Tools Plus
  • The Occlusion Cuff
  • TheBFR
  • Vikingstrength AS
  • Zepp Health Corp.

Qualitative and quantitative analysis of companies has been conducted to help clients understand the wider business environment as well as the strengths and weaknesses of key industry players. Data is qualitatively analyzed to categorize companies as pure play, category-focused, industry-focused, and diversified; it is quantitatively analyzed to categorize companies as dominant, leading, strong, tentative, and weak.

Recent Development and News in Blood flow restriction band market

  • In September 2024, Smart Tools Plus announced the launch of its SmartCuffs 4.0 system, featuring an AI-driven personalized pressure algorithm that adjusts occlusion levels in real-time based on user biometrics, as detailed in a company press release.
  • In November 2024, Delfi Medical Innovations Inc. and a leading university health network formed a strategic partnership to co-develop new clinical protocols for using personalized BFR in post-stroke patient rehabilitation, aiming to improve motor function recovery.
  • In January 2025, KAATSU Global Inc. secured a multi-year contract to supply its latest C4 pneumatic systems to a national military branch for use in soldier conditioning and injury recovery programs, marking a significant expansion into the defense sector.
  • In April 2025, AirBands International received CE mark approval for its next-generation wireless BFR cuffs, enabling the company to expand its market presence across the European Union and target clinical rehabilitation facilities.

Dive into Technavio’s robust research methodology, blending expert interviews, extensive data synthesis, and validated models for unparalleled Blood Flow Restriction Band Market insights. See full methodology.

Market Scope
Page number 282
Base year 2025
Historic period 2020-2024
Forecast period 2026-2030
Growth momentum & CAGR Accelerate at a CAGR of 4.7%
Market growth 2026-2030 USD 40626.2 thousand
Market structure Fragmented
YoY growth 2025-2026(%) 4.6%
Key countries US, Canada, Mexico, Germany, UK, France, Italy, Spain, The Netherlands, Japan, China, South Korea, India, Thailand, Indonesia, Brazil, Saudi Arabia, South Africa, Argentina, UAE, Turkey, Israel and Colombia
Competitive landscape Leading Companies, Market Positioning of Companies, Competitive Strategies, and Industry Risks

Request Free Sample

Research Analyst Overview

  • The market's evolution reflects a convergence of clinical and consumer demand for effective, non-invasive musculoskeletal optimization. The core technology, centered on low-load training to achieve muscle hypertrophy via venous return restriction, is now highly sophisticated. Boardroom decisions are increasingly focused on integrating advanced pneumatic tourniquet systems for personalized bfr into service offerings, a move influenced by evidence-based rehabilitation trends.
  • Innovations in wireless bfr cuffs with automated pressure adjustment and pneumatic pressure regulation are setting new industry standards. These systems, which manage arterial occlusion pressure and limb occlusion pressure to induce metabolic stress induction and localized hypoxia, are pivotal. Their use in personalized rehabilitation programs and age-specific rehabilitation for sarcopenia management is expanding.
  • Furthermore, the synergy with soft tissue mobilization and instrument assisted soft tissue mobilization techniques is enhancing outcomes. For instance, integrated approaches have demonstrated a 15% faster return-to-play for athletes. This drives demand for products supporting both resistance training and broader functional fitness applications, including smart fitness wearables and pneumatic compression devices for strength conditioning.

What are the Key Data Covered in this Blood Flow Restriction Band Market Research and Growth Report?

  • What is the expected growth of the Blood Flow Restriction Band Market between 2026 and 2030?

    • USD 40.63 million, at a CAGR of 4.7%

  • What segmentation does the market report cover?

    • The report is segmented by End-user (Rehabilitation centers, Wellness and fitness centers, and Homecare settings), Product Type (Occlusion training bands, and Double wrap occlusion training bands), Application (Sports and fitness, Healthcare, Military, and Others) and Geography (North America, Europe, Asia, Rest of World (ROW))

  • Which regions are analyzed in the report?

    • North America, Europe, Asia and Rest of World (ROW)

  • What are the key growth drivers and market challenges?

    • Growing adoption of blood flow restriction training in rehabilitation and physical therapy, Safety concerns and risk of improper pressure application

  • Who are the major players in the Blood Flow Restriction Band Market?

    • AirBands International, BFR BANDS, Delfi Medical Innovations Inc., EDGE Mobility System, Enovis Corp., HawkGrips, Iron Bull Strength, KAATSU Global Inc., Owens Recovery Science, Saga Fitness, Smart Tools Plus, The Occlusion Cuff, TheBFR, Vikingstrength AS and Zepp Health Corp.

Market Research Insights

  • The market is characterized by dynamic innovation, with a strong focus on enhancing pressure control accuracy and enabling digital health integration. The shift toward home-based therapy has been significant, with adoption rates increasing by 40% in key demographics over the last two years.
  • This is supported by technologies facilitating remote patient monitoring and remote supervision, which have been shown to improve patient compliance by 25%. The expansion into new sports medicine modalities and outpatient rehabilitation settings is driven by the demand for efficient post-operative recovery solutions.
  • By leveraging intelligent pressure monitoring and automatic limb calibration, providers can deliver consistent, safe, and effective interventions, optimizing both patient outcomes and clinical workflows.

We can help! Our analysts can customize this blood flow restriction band market research report to meet your requirements.

Get in touch

1. Executive Summary

1.1 Market overview

Executive Summary - Chart on Market Overview
Executive Summary - Data Table on Market Overview
Executive Summary - Chart on Global Market Characteristics
Executive Summary - Chart on Market by Geography
Executive Summary - Chart on Market Segmentation by End-user
Executive Summary - Chart on Market Segmentation by Product Type
Executive Summary - Chart on Market Segmentation by Application
Executive Summary - Chart on Incremental Growth
Executive Summary - Data Table on Incremental Growth
Executive Summary - Chart on Company Market Positioning

2. Technavio Analysis

2.1 Analysis of price sensitivity, lifecycle, customer purchase basket, adoption rates, and purchase criteria

2.2 Criticality of inputs and Factors of differentiation

Chart on Overview on criticality of inputs and factors of differentiation

2.3 Factors of disruption

Chart on Overview on factors of disruption

2.4 Impact of drivers and challenges

Chart on Impact of drivers and challenges in 2025 and 2030

3. Market Landscape

3.1 Market ecosystem

Chart on Parent Market
Data Table on - Parent Market

3.2 Market characteristics

Chart on Market characteristics analysis

3.3 Value chain analysis

Chart on Value chain analysis

4. Market Sizing

4.1 Market definition

Data Table on Offerings of companies included in the market definition

4.2 Market segment analysis

Market segments

4.3 Market size 2025

4.4 Market outlook: Forecast for 2025-2030

Chart on Global - Market size and forecast 2025-2030 ($ thousand)
Data Table on Global - Market size and forecast 2025-2030 ($ thousand)
Chart on Global Market: Year-over-year growth 2025-2030 (%)
Data Table on Global Market: Year-over-year growth 2025-2030 (%)

5. Historic Market Size

5.1 Global Blood Flow Restriction Band Market 2020 - 2024

Historic Market Size - Data Table on Global Blood Flow Restriction Band Market 2020 - 2024 ($ thousand)

5.2 End-user segment analysis 2020 - 2024

Historic Market Size - End-user Segment 2020 - 2024 ($ thousand)

5.3 Product Type segment analysis 2020 - 2024

Historic Market Size - Product Type Segment 2020 - 2024 ($ thousand)

5.4 Application segment analysis 2020 - 2024

Historic Market Size - Application Segment 2020 - 2024 ($ thousand)

5.5 Geography segment analysis 2020 - 2024

Historic Market Size - Geography Segment 2020 - 2024 ($ thousand)

5.6 Country segment analysis 2020 - 2024

Historic Market Size - Country Segment 2020 - 2024 ($ thousand)

6. Qualitative Analysis

6.1 The AI Impact on Global Blood Flow Restriction Band Market

7. Five Forces Analysis

7.1 Five forces summary

Five forces analysis - Comparison between 2025 and 2030

7.2 Bargaining power of buyers

Bargaining power of buyers - Impact of key factors 2025 and 2030

7.3 Bargaining power of suppliers

Bargaining power of suppliers - Impact of key factors in 2025 and 2030

7.4 Threat of new entrants

Threat of new entrants - Impact of key factors in 2025 and 2030

7.5 Threat of substitutes

Threat of substitutes - Impact of key factors in 2025 and 2030

7.6 Threat of rivalry

Threat of rivalry - Impact of key factors in 2025 and 2030

7.7 Market condition

Chart on Market condition - Five forces 2025 and 2030

8. Market Segmentation by End-user

8.1 Market segments

Chart on End-user - Market share 2025-2030 (%)
Data Table on End-user - Market share 2025-2030 (%)

8.2 Comparison by End-user

Chart on Comparison by End-user
Data Table on Comparison by End-user

8.3 Rehabilitation centers - Market size and forecast 2025-2030

Chart on Rehabilitation centers - Market size and forecast 2025-2030 ($ thousand)
Data Table on Rehabilitation centers - Market size and forecast 2025-2030 ($ thousand)
Chart on Rehabilitation centers - Year-over-year growth 2025-2030 (%)
Data Table on Rehabilitation centers - Year-over-year growth 2025-2030 (%)

8.4 Wellness and fitness centers - Market size and forecast 2025-2030

Chart on Wellness and fitness centers - Market size and forecast 2025-2030 ($ thousand)
Data Table on Wellness and fitness centers - Market size and forecast 2025-2030 ($ thousand)
Chart on Wellness and fitness centers - Year-over-year growth 2025-2030 (%)
Data Table on Wellness and fitness centers - Year-over-year growth 2025-2030 (%)

8.5 Homecare settings - Market size and forecast 2025-2030

Chart on Homecare settings - Market size and forecast 2025-2030 ($ thousand)
Data Table on Homecare settings - Market size and forecast 2025-2030 ($ thousand)
Chart on Homecare settings - Year-over-year growth 2025-2030 (%)
Data Table on Homecare settings - Year-over-year growth 2025-2030 (%)

8.6 Market opportunity by End-user

Market opportunity by End-user ($ thousand)
Data Table on Market opportunity by End-user ($ thousand)

9. Market Segmentation by Product Type

9.1 Market segments

Chart on Product Type - Market share 2025-2030 (%)
Data Table on Product Type - Market share 2025-2030 (%)

9.2 Comparison by Product Type

Chart on Comparison by Product Type
Data Table on Comparison by Product Type

9.3 Occlusion training bands - Market size and forecast 2025-2030

Chart on Occlusion training bands - Market size and forecast 2025-2030 ($ thousand)
Data Table on Occlusion training bands - Market size and forecast 2025-2030 ($ thousand)
Chart on Occlusion training bands - Year-over-year growth 2025-2030 (%)
Data Table on Occlusion training bands - Year-over-year growth 2025-2030 (%)

9.4 Double wrap occlusion training bands - Market size and forecast 2025-2030

Chart on Double wrap occlusion training bands - Market size and forecast 2025-2030 ($ thousand)
Data Table on Double wrap occlusion training bands - Market size and forecast 2025-2030 ($ thousand)
Chart on Double wrap occlusion training bands - Year-over-year growth 2025-2030 (%)
Data Table on Double wrap occlusion training bands - Year-over-year growth 2025-2030 (%)

9.5 Market opportunity by Product Type

Market opportunity by Product Type ($ thousand)
Data Table on Market opportunity by Product Type ($ thousand)

10. Market Segmentation by Application

10.1 Market segments

Chart on Application - Market share 2025-2030 (%)
Data Table on Application - Market share 2025-2030 (%)

10.2 Comparison by Application

Chart on Comparison by Application
Data Table on Comparison by Application

10.3 Sports and fitness - Market size and forecast 2025-2030

Chart on Sports and fitness - Market size and forecast 2025-2030 ($ thousand)
Data Table on Sports and fitness - Market size and forecast 2025-2030 ($ thousand)
Chart on Sports and fitness - Year-over-year growth 2025-2030 (%)
Data Table on Sports and fitness - Year-over-year growth 2025-2030 (%)

10.4 Healthcare - Market size and forecast 2025-2030

Chart on Healthcare - Market size and forecast 2025-2030 ($ thousand)
Data Table on Healthcare - Market size and forecast 2025-2030 ($ thousand)
Chart on Healthcare - Year-over-year growth 2025-2030 (%)
Data Table on Healthcare - Year-over-year growth 2025-2030 (%)

10.5 Military - Market size and forecast 2025-2030

Chart on Military - Market size and forecast 2025-2030 ($ thousand)
Data Table on Military - Market size and forecast 2025-2030 ($ thousand)
Chart on Military - Year-over-year growth 2025-2030 (%)
Data Table on Military - Year-over-year growth 2025-2030 (%)

10.6 Others - Market size and forecast 2025-2030

Chart on Others - Market size and forecast 2025-2030 ($ thousand)
Data Table on Others - Market size and forecast 2025-2030 ($ thousand)
Chart on Others - Year-over-year growth 2025-2030 (%)
Data Table on Others - Year-over-year growth 2025-2030 (%)

10.7 Market opportunity by Application

Market opportunity by Application ($ thousand)
Data Table on Market opportunity by Application ($ thousand)

11. Customer Landscape

11.1 Customer landscape overview

Analysis of price sensitivity, lifecycle, customer purchase basket, adoption rates, and purchase criteria

12. Geographic Landscape

12.1 Geographic segmentation

Chart on Market share by geography 2025-2030 (%)
Data Table on Market share by geography 2025-2030 (%)

12.2 Geographic comparison

Chart on Geographic comparison
Data Table on Geographic comparison

12.3 North America - Market size and forecast 2025-2030

Chart on North America - Market size and forecast 2025-2030 ($ thousand)
Data Table on North America - Market size and forecast 2025-2030 ($ thousand)
Chart on North America - Year-over-year growth 2025-2030 (%)
Data Table on North America - Year-over-year growth 2025-2030 (%)
Chart on Regional Comparison - North America
Data Table on Regional Comparison - North America

12.3.1 US - Market size and forecast 2025-2030

Chart on US - Market size and forecast 2025-2030 ($ thousand)
Data Table on US - Market size and forecast 2025-2030 ($ thousand)
Chart on US - Year-over-year growth 2025-2030 (%)
Data Table on US - Year-over-year growth 2025-2030 (%)

12.3.2 Canada - Market size and forecast 2025-2030

Chart on Canada - Market size and forecast 2025-2030 ($ thousand)
Data Table on Canada - Market size and forecast 2025-2030 ($ thousand)
Chart on Canada - Year-over-year growth 2025-2030 (%)
Data Table on Canada - Year-over-year growth 2025-2030 (%)

12.3.3 Mexico - Market size and forecast 2025-2030

Chart on Mexico - Market size and forecast 2025-2030 ($ thousand)
Data Table on Mexico - Market size and forecast 2025-2030 ($ thousand)
Chart on Mexico - Year-over-year growth 2025-2030 (%)
Data Table on Mexico - Year-over-year growth 2025-2030 (%)

12.4 Europe - Market size and forecast 2025-2030

Chart on Europe - Market size and forecast 2025-2030 ($ thousand)
Data Table on Europe - Market size and forecast 2025-2030 ($ thousand)
Chart on Europe - Year-over-year growth 2025-2030 (%)
Data Table on Europe - Year-over-year growth 2025-2030 (%)
Chart on Regional Comparison - Europe
Data Table on Regional Comparison - Europe

12.4.1 Germany - Market size and forecast 2025-2030

Chart on Germany - Market size and forecast 2025-2030 ($ thousand)
Data Table on Germany - Market size and forecast 2025-2030 ($ thousand)
Chart on Germany - Year-over-year growth 2025-2030 (%)
Data Table on Germany - Year-over-year growth 2025-2030 (%)

12.4.2 UK - Market size and forecast 2025-2030

Chart on UK - Market size and forecast 2025-2030 ($ thousand)
Data Table on UK - Market size and forecast 2025-2030 ($ thousand)
Chart on UK - Year-over-year growth 2025-2030 (%)
Data Table on UK - Year-over-year growth 2025-2030 (%)

12.4.3 France - Market size and forecast 2025-2030

Chart on France - Market size and forecast 2025-2030 ($ thousand)
Data Table on France - Market size and forecast 2025-2030 ($ thousand)
Chart on France - Year-over-year growth 2025-2030 (%)
Data Table on France - Year-over-year growth 2025-2030 (%)

12.4.4 Italy - Market size and forecast 2025-2030

Chart on Italy - Market size and forecast 2025-2030 ($ thousand)
Data Table on Italy - Market size and forecast 2025-2030 ($ thousand)
Chart on Italy - Year-over-year growth 2025-2030 (%)
Data Table on Italy - Year-over-year growth 2025-2030 (%)

12.4.5 Spain - Market size and forecast 2025-2030

Chart on Spain - Market size and forecast 2025-2030 ($ thousand)
Data Table on Spain - Market size and forecast 2025-2030 ($ thousand)
Chart on Spain - Year-over-year growth 2025-2030 (%)
Data Table on Spain - Year-over-year growth 2025-2030 (%)

12.4.6 The Netherlands - Market size and forecast 2025-2030

Chart on The Netherlands - Market size and forecast 2025-2030 ($ thousand)
Data Table on The Netherlands - Market size and forecast 2025-2030 ($ thousand)
Chart on The Netherlands - Year-over-year growth 2025-2030 (%)
Data Table on The Netherlands - Year-over-year growth 2025-2030 (%)

12.5 Asia - Market size and forecast 2025-2030

Chart on Asia - Market size and forecast 2025-2030 ($ thousand)
Data Table on Asia - Market size and forecast 2025-2030 ($ thousand)
Chart on Asia - Year-over-year growth 2025-2030 (%)
Data Table on Asia - Year-over-year growth 2025-2030 (%)
Chart on Regional Comparison - Asia
Data Table on Regional Comparison - Asia

12.5.1 Japan - Market size and forecast 2025-2030

Chart on Japan - Market size and forecast 2025-2030 ($ thousand)
Data Table on Japan - Market size and forecast 2025-2030 ($ thousand)
Chart on Japan - Year-over-year growth 2025-2030 (%)
Data Table on Japan - Year-over-year growth 2025-2030 (%)

12.5.2 China - Market size and forecast 2025-2030

Chart on China - Market size and forecast 2025-2030 ($ thousand)
Data Table on China - Market size and forecast 2025-2030 ($ thousand)
Chart on China - Year-over-year growth 2025-2030 (%)
Data Table on China - Year-over-year growth 2025-2030 (%)

12.5.3 South Korea - Market size and forecast 2025-2030

Chart on South Korea - Market size and forecast 2025-2030 ($ thousand)
Data Table on South Korea - Market size and forecast 2025-2030 ($ thousand)
Chart on South Korea - Year-over-year growth 2025-2030 (%)
Data Table on South Korea - Year-over-year growth 2025-2030 (%)

12.5.4 India - Market size and forecast 2025-2030

Chart on India - Market size and forecast 2025-2030 ($ thousand)
Data Table on India - Market size and forecast 2025-2030 ($ thousand)
Chart on India - Year-over-year growth 2025-2030 (%)
Data Table on India - Year-over-year growth 2025-2030 (%)

12.5.5 Thailand - Market size and forecast 2025-2030

Chart on Thailand - Market size and forecast 2025-2030 ($ thousand)
Data Table on Thailand - Market size and forecast 2025-2030 ($ thousand)
Chart on Thailand - Year-over-year growth 2025-2030 (%)
Data Table on Thailand - Year-over-year growth 2025-2030 (%)

12.5.6 Indonesia - Market size and forecast 2025-2030

Chart on Indonesia - Market size and forecast 2025-2030 ($ thousand)
Data Table on Indonesia - Market size and forecast 2025-2030 ($ thousand)
Chart on Indonesia - Year-over-year growth 2025-2030 (%)
Data Table on Indonesia - Year-over-year growth 2025-2030 (%)

12.6 Rest of World (ROW) - Market size and forecast 2025-2030

Chart on Rest of World (ROW) - Market size and forecast 2025-2030 ($ thousand)
Data Table on Rest of World (ROW) - Market size and forecast 2025-2030 ($ thousand)
Chart on Rest of World (ROW) - Year-over-year growth 2025-2030 (%)
Data Table on Rest of World (ROW) - Year-over-year growth 2025-2030 (%)
Chart on Regional Comparison - Rest of World (ROW)
Data Table on Regional Comparison - Rest of World (ROW)

12.6.1 Brazil - Market size and forecast 2025-2030

Chart on Brazil - Market size and forecast 2025-2030 ($ thousand)
Data Table on Brazil - Market size and forecast 2025-2030 ($ thousand)
Chart on Brazil - Year-over-year growth 2025-2030 (%)
Data Table on Brazil - Year-over-year growth 2025-2030 (%)

12.6.2 Saudi Arabia - Market size and forecast 2025-2030

Chart on Saudi Arabia - Market size and forecast 2025-2030 ($ thousand)
Data Table on Saudi Arabia - Market size and forecast 2025-2030 ($ thousand)
Chart on Saudi Arabia - Year-over-year growth 2025-2030 (%)
Data Table on Saudi Arabia - Year-over-year growth 2025-2030 (%)

12.6.3 South Africa - Market size and forecast 2025-2030

Chart on South Africa - Market size and forecast 2025-2030 ($ thousand)
Data Table on South Africa - Market size and forecast 2025-2030 ($ thousand)
Chart on South Africa - Year-over-year growth 2025-2030 (%)
Data Table on South Africa - Year-over-year growth 2025-2030 (%)

12.6.4 Argentina - Market size and forecast 2025-2030

Chart on Argentina - Market size and forecast 2025-2030 ($ thousand)
Data Table on Argentina - Market size and forecast 2025-2030 ($ thousand)
Chart on Argentina - Year-over-year growth 2025-2030 (%)
Data Table on Argentina - Year-over-year growth 2025-2030 (%)

12.6.5 UAE - Market size and forecast 2025-2030

Chart on UAE - Market size and forecast 2025-2030 ($ thousand)
Data Table on UAE - Market size and forecast 2025-2030 ($ thousand)
Chart on UAE - Year-over-year growth 2025-2030 (%)
Data Table on UAE - Year-over-year growth 2025-2030 (%)

12.6.6 Turkey - Market size and forecast 2025-2030

Chart on Turkey - Market size and forecast 2025-2030 ($ thousand)
Data Table on Turkey - Market size and forecast 2025-2030 ($ thousand)
Chart on Turkey - Year-over-year growth 2025-2030 (%)
Data Table on Turkey - Year-over-year growth 2025-2030 (%)

12.6.7 Israel - Market size and forecast 2025-2030

Chart on Israel - Market size and forecast 2025-2030 ($ thousand)
Data Table on Israel - Market size and forecast 2025-2030 ($ thousand)
Chart on Israel - Year-over-year growth 2025-2030 (%)
Data Table on Israel - Year-over-year growth 2025-2030 (%)

12.6.8 Colombia - Market size and forecast 2025-2030

Chart on Colombia - Market size and forecast 2025-2030 ($ thousand)
Data Table on Colombia - Market size and forecast 2025-2030 ($ thousand)
Chart on Colombia - Year-over-year growth 2025-2030 (%)
Data Table on Colombia - Year-over-year growth 2025-2030 (%)

12.7 Market opportunity by geography

Market opportunity by geography ($ thousand)
Data Tables on Market opportunity by geography ($ thousand)

13. Drivers, Challenges, and Opportunity

13.1 Market drivers

Growing adoption of blood flow restriction training in rehabilitation and physical therapy
Rising awareness of muscle strengthening benefits with low-load exercise
Increasing sports injury incidence and demand for faster recovery solutions

13.2 Market challenges

Safety concerns and risk of improper pressure application
Lack of standardized usage guidelines and clinical protocols
Limited awareness and acceptance among general fitness users

13.3 Impact of drivers and challenges

Impact of drivers and challenges in 2025 and 2030

13.4 Market opportunities

Increasing use of BFR training in geriatric and mobility-limited populations
Expansion of BFR applications beyond rehabilitation into general fitness
Rising demand for compact, portable, and user-friendly BFR devices

14. Competitive Landscape

14.1 Overview

14.2

Overview on criticality of inputs and factors of differentiation

14.3 Landscape disruption

Overview on factors of disruption

14.4 Industry risks

Impact of key risks on business

15. Competitive Analysis

15.1 Companies profiled

Companies covered

15.2 Company ranking index

15.3 Market positioning of companies

Matrix on companies position and classification

15.4 AirBands International

AirBands International - Overview
AirBands International - Product / Service
AirBands International - Key offerings
SWOT

15.5 BFR BANDS

BFR BANDS - Overview
BFR BANDS - Product / Service
BFR BANDS - Key offerings
SWOT

15.6 Delfi Medical Innovations Inc.

Delfi Medical Innovations Inc. - Overview
Delfi Medical Innovations Inc. - Product / Service
Delfi Medical Innovations Inc. - Key offerings
SWOT

15.7 EDGE Mobility System

EDGE Mobility System - Overview
EDGE Mobility System - Product / Service
EDGE Mobility System - Key offerings
SWOT

15.8 Enovis Corp.

Enovis Corp. - Overview
Enovis Corp. - Business segments
Enovis Corp. - Key news
Enovis Corp. - Key offerings
Enovis Corp. - Segment focus
SWOT

15.9 HawkGrips

HawkGrips - Overview
HawkGrips - Product / Service
HawkGrips - Key offerings
SWOT

15.10 Iron Bull Strength

Iron Bull Strength - Overview
Iron Bull Strength - Product / Service
Iron Bull Strength - Key offerings
SWOT

15.11 KAATSU Global Inc.

KAATSU Global Inc. - Overview
KAATSU Global Inc. - Product / Service
KAATSU Global Inc. - Key offerings
SWOT

15.12 Owens Recovery Science

Owens Recovery Science - Overview
Owens Recovery Science - Product / Service
Owens Recovery Science - Key offerings
SWOT

15.13 Saga Fitness

Saga Fitness - Overview
Saga Fitness - Product / Service
Saga Fitness - Key offerings
SWOT

15.14 Smart Tools Plus

Smart Tools Plus - Overview
Smart Tools Plus - Product / Service
Smart Tools Plus - Key offerings
SWOT

15.15 The Occlusion Cuff

The Occlusion Cuff - Overview
The Occlusion Cuff - Product / Service
The Occlusion Cuff - Key offerings
SWOT

15.16 TheBFR

TheBFR - Overview
TheBFR - Product / Service
TheBFR - Key offerings
SWOT

15.17 Vikingstrength AS

Vikingstrength AS - Overview
Vikingstrength AS - Product / Service
Vikingstrength AS - Key offerings
SWOT

15.18 Zepp Health Corp.

Zepp Health Corp. - Overview
Zepp Health Corp. - Product / Service
Zepp Health Corp. - Key offerings
SWOT

16. Appendix

16.1 Scope of the report

Market definition
Objectives
Notes and caveats

16.2 Inclusions and exclusions checklist

Inclusions checklist
Exclusions checklist

16.3 Currency conversion rates for US$

16.4 Research methodology

16.5 Data procurement

Information sources

16.6 Data validation

16.7 Validation techniques employed for market sizing

16.8 Data synthesis

16.9 360 degree market analysis

16.10 List of abbreviations

Research Methodology

Technavio presents a detailed picture of the market by way of study, synthesis, and summation of data from multiple sources. The analysts have presented the various facets of the market with a particular focus on identifying the key industry influencers. The data thus presented is comprehensive, reliable, and the result of extensive research, both primary and secondary.

INFORMATION SOURCES

Primary sources

  • Manufacturers and suppliers
  • Channel partners
  • Industry experts
  • Strategic decision makers

Secondary sources

  • Industry journals and periodicals
  • Government data
  • Financial reports of key industry players
  • Historical data
  • Press releases

DATA ANALYSIS

Data Synthesis

  • Collation of data
  • Estimation of key figures
  • Analysis of derived insights

Data Validation

  • Triangulation with data models
  • Reference against proprietary databases
  • Corroboration with industry experts

REPORT WRITING

Qualitative

  • Market drivers
  • Market challenges
  • Market trends
  • Five forces analysis

Quantitative

  • Market size and forecast
  • Market segmentation
  • Geographical insights
  • Competitive landscape

Interested in this report?

Get your sample now to see our research methodology and insights!

Download Now

Frequently Asked Questions

Blood Flow Restriction Band market growth will increase by USD 40626.2 thousand thousand during 2026-2030.

The Blood Flow Restriction Band market is expected to grow at a CAGR of 4.7% during 2026-2030.

Blood Flow Restriction Band market is segmented by End-user (Rehabilitation centers, Wellness and fitness centers, Homecare settings) Product type (Occlusion training bands, Double wrap occlusion training bands) Application (Sports and fitness, Healthcare, Military, Others)

AirBands International, BFR BANDS, Delfi Medical Innovations Inc., EDGE Mobility System, Enovis Corp., HawkGrips, Iron Bull Strength, KAATSU Global Inc., Owens Recovery Science, Saga Fitness, Smart Tools Plus, The Occlusion Cuff, TheBFR, Vikingstrength AS, Zepp Health Corp. are a few of the key vendors in the Blood Flow Restriction Band market.

North America will register the highest growth rate of 49% among the other regions. Therefore, the Blood Flow Restriction Band market in North America is expected to garner significant business opportunities for the vendors during the forecast period.

US, Canada, Mexico, Germany, UK, France, Italy, Spain, The Netherlands, Japan, China, South Korea, India, Thailand, Indonesia, Brazil, Saudi Arabia, South Africa, Argentina, UAE, Turkey, Israel, Colombia

  • Growing adoption of blood flow restriction training in rehabilitation and physical therapy is the driving factor this market.

The Blood Flow Restriction Band market vendors should focus on grabbing business opportunities from the End-user segment as it accounted for the largest market share in the base year.