Biochar Market Analysis North America, APAC, Europe, South America, Middle East and Africa - US, China, Germany, Mexico, Japan - Size and Forecast 2024-2028

Biochar Market Analysis North America, APAC, Europe, South America, Middle East and Africa - US, China, Germany, Mexico, Japan - Size and Forecast 2024-2028

Published: Jul 2024 164 Pages SKU: IRTNTR71846

Market Overview at a Glance

$2.55 B
Market Opportunity
16.08%
CAGR
13.49
YoY growth 2023-2024(%)

Biochar Market Size 2024-2028

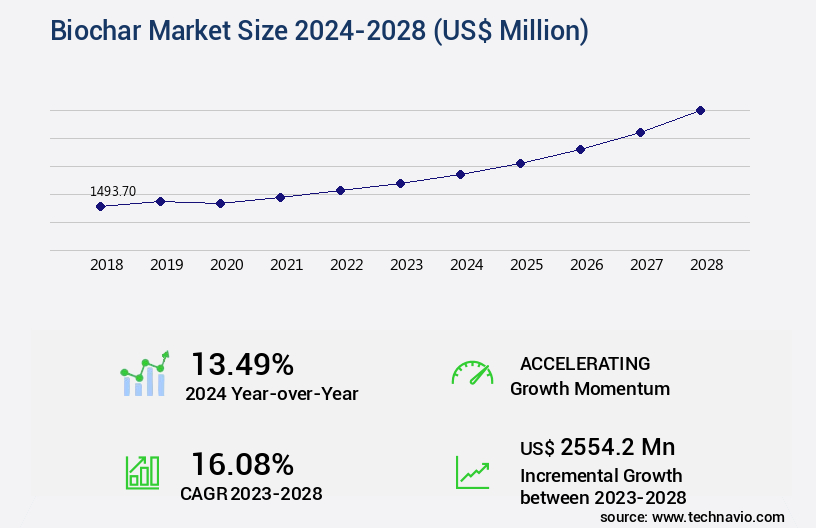
The biochar market size is valued to increase USD 2.55 billion, at a CAGR of 16.08% from 2023 to 2028. Helps in reducing emission will drive the biochar market.

Major Market Trends & Insights

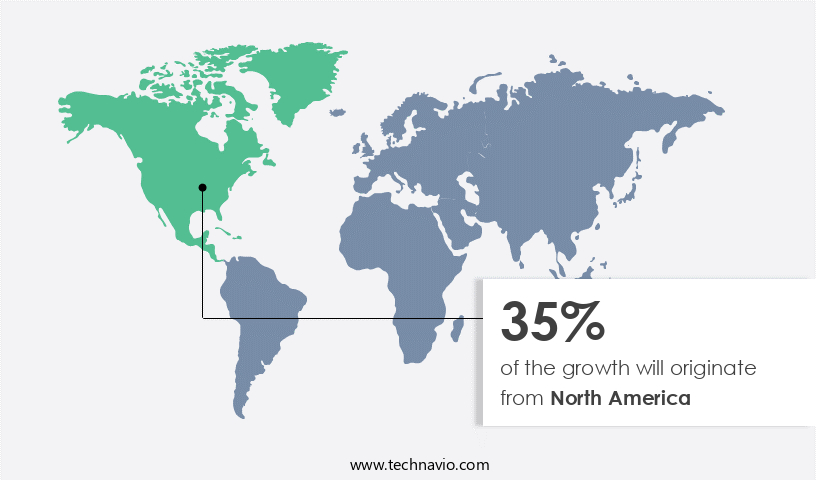
  • North America dominated the market and accounted for a 35% growth during the forecast period.
  • By Application - Farming segment was valued at USD 648.40 billion in 2022
  • By Technology - Pyrolysis segment accounted for the largest market revenue share in 2022

Market Size & Forecast

  • Market Opportunities: USD 225.33 million
  • Market Future Opportunities: USD 2554.20 million
  • CAGR : 16.08%
  • North America: Largest market in 2022

Market Summary

  • The market represents a significant and continually evolving sector, driven by the increasing demand for sustainable and cost-effective carbon sequestration solutions. This market encompasses core technologies such as pyrolysis and gasification, which convert biomass into biochar. Applications span various industries, including precision agriculture, where biochar's ability to help reduce emissions and incline towards organic farming makes it a valuable addition. The service types or product categories range from raw biochar to biochar-based fertilizers and soil amendments. Despite the market's potential, challenges such as high investment costs persist.
  • Regions like North America and Europe are at the forefront of biochar adoption, with Europe holding approximately 40% of the global market share. The market's ongoing evolution is influenced by these factors, offering opportunities for innovation and growth.

What will be the Size of the Biochar Market during the forecast period?

Biochar Market Size

Get Key Insights on Market Forecast (PDF) Request Free Sample

How is the Biochar Market Segmented and what are the key trends of market segmentation?

The biochar industry research report provides comprehensive data (region-wise segment analysis), with forecasts and estimates in "USD million" for the period 2024-2028, as well as historical data from 2018-2022 for the following segments.

  • Application
    • Farming
    • Livestock
    • Others
  • Technology
    • Pyrolysis
    • Gasification
    • Others
  • Geography
    • North America
      • US
      • Mexico
    • Europe
      • Germany
    • APAC
      • China
      • Japan
    • Rest of World (ROW)

By Application Insights

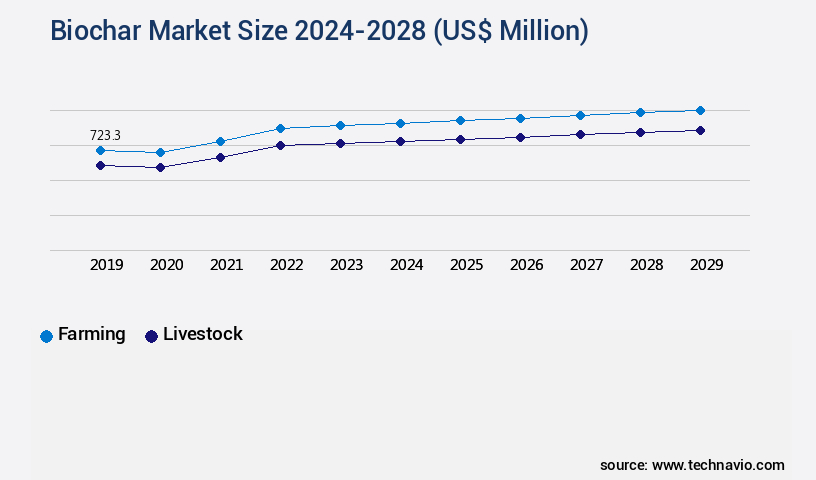
The farming segment is estimated to witness significant growth during the forecast period.

The market is experiencing significant growth in the agricultural sector due to its ability to enhance soil quality and promote sustainable farming practices. Biochar, a carbon-rich material derived from the pyrolysis of biomass feedstock, has been shown to improve soil organic matter, cation exchange capacity, water retention capacity, and nutrient adsorption. This leads to increased crop productivity, improved drainage, and ph buffering capacity. Biochar also plays a crucial role in climate change mitigation by sequestering carbon in the soil and reducing greenhouse gas emissions. The market for biochar is expected to expand further as farmers seek ways to combat soil erosion, enhance soil health, and promote plant growth in nutrient-deficient soils.

In horticulture, biochar has been used in Australia to boost fruit and vegetable yields, while in Africa, it has been employed to improve crop yields in impoverished soils. The renewable energy sector also benefits from biochar as it can be used as a slow-release fertilizer and a source of electrical conductivity. Additionally, biochar aids in heavy metal remediation and microbial biomass enhancement, contributing to the overall health of the soil. The market for biochar is expected to grow substantially, with an estimated 25% of agricultural waste being converted into biochar by 2030. Furthermore, the increasing demand for organic food and sustainable farming practices is driving the market's expansion.

Biochar production is a continuous process, with various techniques, such as pyrolysis temperature and pore size distribution, being employed to optimize its properties. The microbial community structure and enzyme activity are also crucial factors in the carbon mineralization process. Carbon dating techniques are used to determine the age of the biochar, ensuring its effectiveness in carbon sequestration and soil health improvement. In conclusion, the market is a dynamic and evolving industry with significant potential for growth in various sectors. Its ability to improve soil quality, promote sustainable agriculture, and contribute to climate change mitigation makes it an essential component in modern farming practices.

The market is expected to grow substantially, with an estimated 30% of agricultural waste being converted into biochar by 2040. This trend is driven by the increasing demand for organic food and environmentally friendly farming methods, as well as the need to address the challenges of soil erosion, nutrient deficiency, and climate change.

Biochar Market Size

Request Free Sample

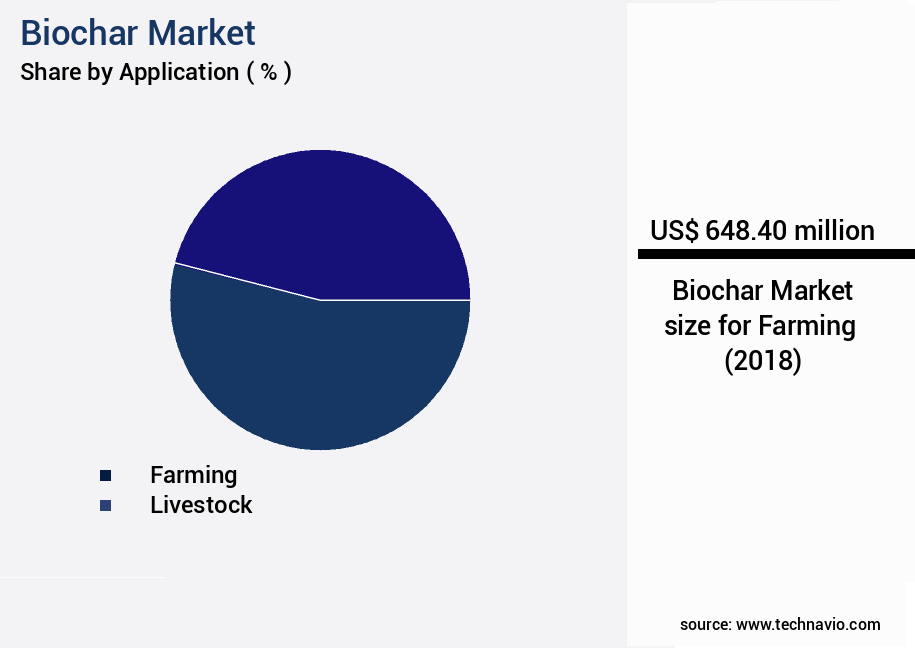
The Farming segment was valued at USD 648.40 billion in 2018 and showed a gradual increase during the forecast period.

Biochar Market Size

Request Free Sample

Regional Analysis

North America is estimated to contribute 35% to the growth of the global market during the forecast period.Technavio's analysts have elaborately explained the regional trends and drivers that shape the market during the forecast period.

Biochar Market Share by Geography

See How Biochar Market Demand is Rising in North America Request Free Sample

In North America, the market growth is driven by the expanding demand for pyrolysis equipment and the rising utilization of biochar in power generation. Environmental concerns and the availability of low-cost feedstock are fueling this demand. The US, being the largest market in the region, is a significant contributor to the global biochar industry. Renewable energy, with biomass as its largest source, accounts for 10% of the US's total energy output, making it an essential market for biochar. The US the market value is expected to grow substantially due to these factors.

Additionally, the increasing adoption of biochar in agriculture and water treatment is further boosting market growth. With these trends continuing, North America is poised to remain a key player in the evolving the market.

Market Dynamics

Our researchers analyzed the data with 2023 as the base year, along with the key drivers, trends, and challenges. A holistic analysis of drivers will help companies refine their marketing strategies to gain a competitive advantage.

The market encompasses the production and application of biochar, a carbon-rich, porous material derived from the thermochemical conversion of biomass feedstocks. This market is gaining significant traction due to biochar's multifaceted benefits, including its impact on char properties influenced by biomass feedstock composition and pyrolysis temperature. Biochar's porosity, which is affected by pyrolysis temperature, plays a crucial role in enhancing soil water retention and nutrient cycling. The influence of biochar application on nutrient cycling is substantial, as it contributes to carbon sequestration in soil and assesses its long-term stability. Moreover, the relationship between biochar surface area and nutrient adsorption is a critical factor in determining optimal application rates.

Biochar's effect on microbial community composition and its contribution to soil structure and stability further underscore its importance in sustainable agricultural practices. The comparison of different biochar production methods reveals that industrial-scale production methods account for a significantly larger share than traditional small-scale methods. This shift towards industrial production is driven by the potential for greenhouse gas mitigation and cost-benefit analysis in biochar soil amendment. Biochar's potential for heavy metal phytoremediation and its role in reducing carbon footprint with use are additional factors fueling market growth. Quantifying biochar's influence on soil health and measuring its impact on plant growth parameters are essential aspects of evaluating its effectiveness.

A life cycle analysis of biochar production and use highlights its potential for carbon footprint reduction, making it an attractive alternative to conventional agricultural practices. The integration of biochar in sustainable agricultural practices is a key trend, with adoption rates in certain regions surpassing those in others. In conclusion, the market is poised for growth due to its ability to address various environmental and agricultural challenges. Its impact on soil health, water retention, nutrient cycling, and carbon sequestration make it an essential component in sustainable agricultural practices and greenhouse gas mitigation efforts.

Biochar Market Size

What are the key market drivers leading to the rise in the adoption of Biochar Industry?

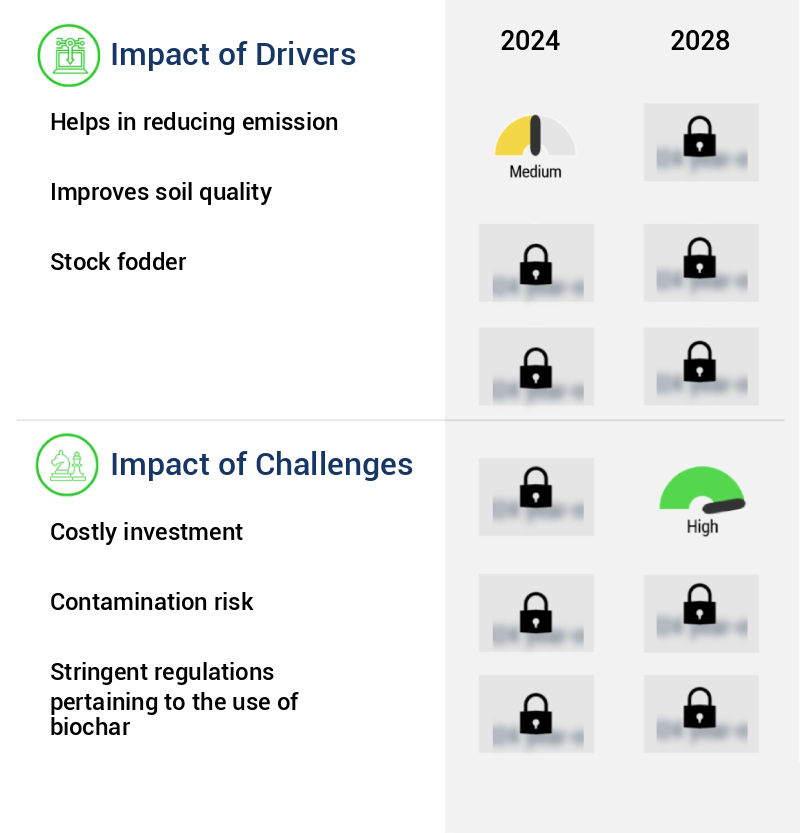
  • The key driver of the market is the ability of various solutions to help in reducing emissions. This mandatory factor is a significant influence on market growth. 
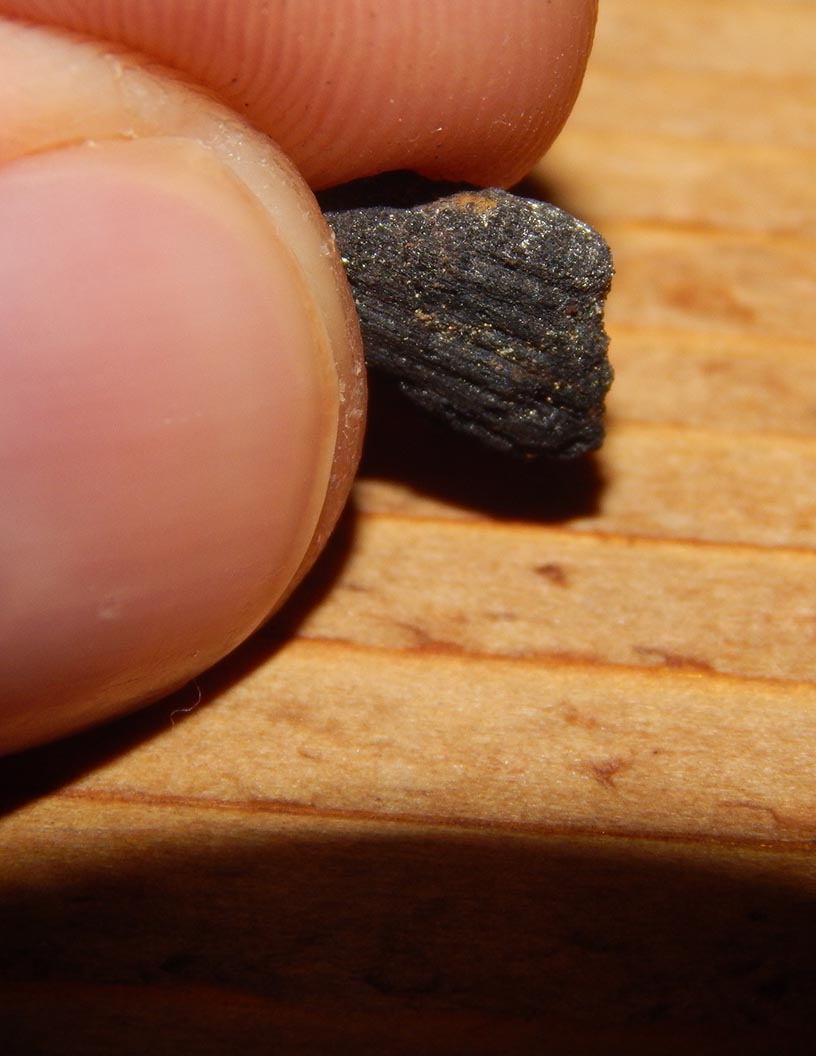
  • Biochar, derived from the process of heating biomass in the absence of oxygen, offers significant environmental benefits. This carbon-rich substance, which can remain stable in the soil for hundreds to thousands of years, plays a crucial role in mitigating greenhouse gas emissions. While the generation of biochar results in the emission of carbon dioxide (approximately up to 50% of the biomass), the remaining carbon content serves to improve soil quality and agricultural productivity. Moreover, the use of biochar can help alleviate the strain on old-growth forests by reducing the need for their harvest for agricultural purposes.
  • Research suggests that the implementation of sustainable biochar practices could potentially decrease global net emissions of carbon dioxide, methane, and Nitrous Oxide by a substantial amount. The long-term carbon sequestration capabilities of biochar make it an attractive solution for addressing environmental concerns and contributing to sustainable agricultural practices.

What are the market trends shaping the Biochar Industry?

  • Organic farming is gaining increasing popularity in the market. The inclination towards organic produce is becoming a notable trend.
  • The organic farming sector's shift towards sustainable practices has significantly boosted the demand for biochar in the global market. Biochar, a natural soil amendment, aligns well with organic farming due to its carbon-sequestering properties and ability to enhance soil fertility, water retention, and nutrient availability. As a result, numerous countries, including the US, Australia, and parts of Europe, have adopted biochar in their organic farming techniques. This trend is expected to persist as organic farming gains popularity worldwide, driven by the need for environmentally friendly methods that boost crop yield and sustainability.
  • Consequently, the market is poised for substantial growth during the forecast period, as the demand for this eco-friendly solution continues to escalate. Organizations and farmers alike recognize the potential of biochar to improve soil health and reduce greenhouse gas emissions, making it an essential component of modern, sustainable agricultural practices.

What challenges does the Biochar Industry face during its growth?

  • The high cost of investments poses a significant challenge to the expansion and growth of the industry. 
  • The market is experiencing significant evolution, driven by the expanding range of feedstocks used in production. Biochar manufacturing is increasingly focusing on utilizing biogenic residues, such as agricultural residues, sewage sludge, and digestate from biogas production. Additionally, residues from the food industry and modern processes like ethanol production from straw and macroalgae are being incorporated. These materials, often considered byproducts, must be handled productively. However, producing biochar as the sole byproduct of a process remains economically challenging for manufacturers. This hurdle may hinder the market's growth during the forecast period.
  • Despite this, the ongoing shift towards sustainable production methods and the potential for carbon sequestration make biochar an attractive prospect for various industries. The continuous exploration of cost-effective production methods and the integration of diverse feedstocks will play crucial roles in shaping the market's future.

Exclusive Customer Landscape

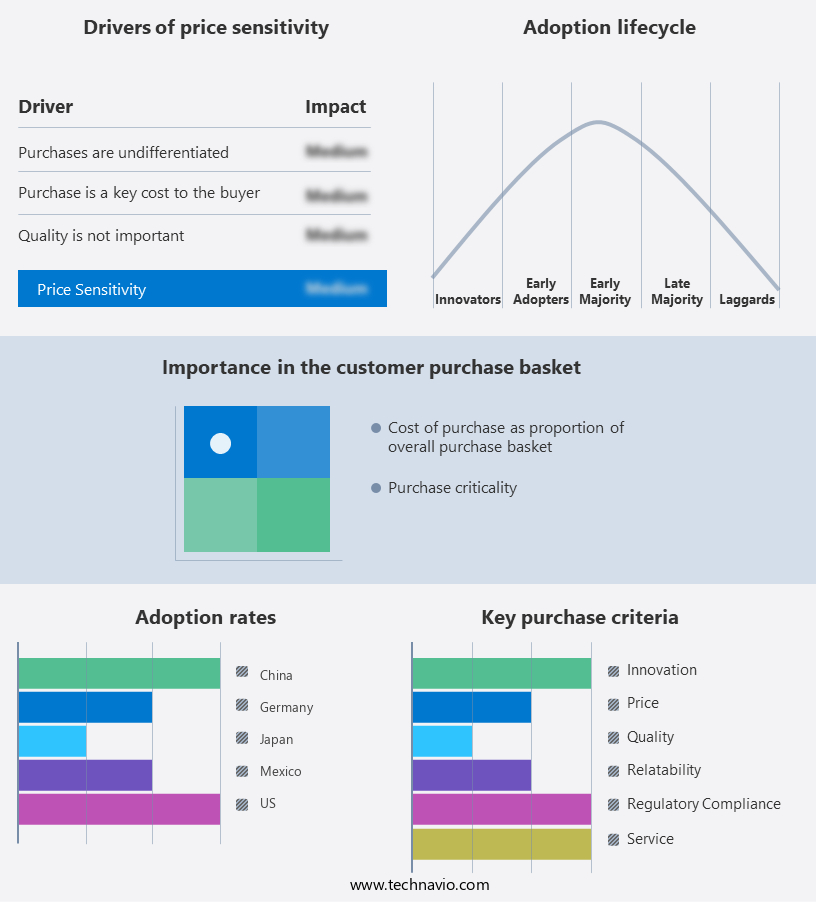
The biochar market forecasting report includes the adoption lifecycle of the market, covering from the innovator's stage to the laggard's stage. It focuses on adoption rates in different regions based on penetration. Furthermore, the biochar market report also includes key purchase criteria and drivers of price sensitivity to help companies evaluate and develop their market growth analysis strategies.

Biochar Market Share by Geography

 Customer Landscape of Biochar Industry

Competitive Landscape & Market Insights

Companies are implementing various strategies, such as strategic alliances, biochar market forecast, partnerships, mergers and acquisitions, geographical expansion, and product/service launches, to enhance their presence in the industry.

Airex Energie Inc. - A leading company specializes in producing biochar from wood waste, an innovative solution enhancing soil fertility, mitigating greenhouse gases, and purifying water. This eco-friendly product derived from biomass transformation offers significant environmental benefits.

The industry research and growth report includes detailed analyses of the competitive landscape of the market and information about key companies, including:

  • Airex Energie Inc.
  • American BioChar Co.
  • American Eagle Outfitters Inc.
  • Aries Clean Technologies LLC
  • ArSta eco Pvt. Ltd.
  • Avello Bioenergy Inc.
  • Biochar Now LLC
  • Biochar Solutions Inc.
  • Biochar Supreme LLC
  • Bioforcetech Corp.
  • Carbon Gold Ltd.
  • Earth Systems Consulting Pty Ltd.
  • ECOERA AB
  • Oregon Biochar Solutions
  • Pacific Biochar Benefit Corp.
  • Phoenix Energy Group LLC
  • PYROPOWER
  • Seneca Farms Biochar LLC
  • Swiss Biochar Sarl
  • Vow ASA

Qualitative and quantitative analysis of companies has been conducted to help clients understand the wider business environment as well as the strengths and weaknesses of key industry players. Data is qualitatively analyzed to categorize companies as pure play, category-focused, industry-focused, and diversified; it is quantitatively analyzed to categorize companies as dominant, leading, strong, tentative, and weak.

Recent Development and News in Biochar Market

  • In January 2024, CarbonCure Technologies, a leading biochar solution provider, announced the successful commercialization of its Biochar Solution in Europe, marking a significant geographic expansion for the company (CarbonCure Technologies Press Release). This innovative solution, which reduces carbon emissions in concrete production by up to 20%, was already well-established in North America.
  • In March 2024, Bio-Techne Corporation, a global life sciences company, completed the acquisition of Bio-Techne's biochar division from Bio-Techne's joint venture partner, Biochar-Farm GmbH, for approximately USD25 million (Bio-Techne Corporation Press Release). This strategic move strengthened Bio-Techne's position in the market and expanded its product offerings.
  • In May 2024, the European Commission approved the use of biochar in organic farming, marking a major regulatory milestone for the biochar industry (European Commission Press Release). This decision opened the door for increased adoption of biochar in organic farming across Europe, boosting the market's growth potential.
  • In February 2025, Biochar Now, a leading biochar producer, announced a partnership with Dow Inc. To develop and commercialize biochar-based sorbents for water treatment applications (Dow Inc. Press Release). This collaboration combined Dow's expertise in materials science with Biochar Now's biochar technology, paving the way for innovative and sustainable water treatment solutions.

Dive into Technavio's robust research methodology, blending expert interviews, extensive data synthesis, and validated models for unparalleled Biochar Market insights. See full methodology.

Market Scope

Report Coverage

Details

Page number

164

Base year

2023

Historic period

2018-2022

Forecast period

2024-2028

Growth momentum & CAGR

Accelerate at a CAGR of 16.08%

Market growth 2024-2028

USD 2554.2 million

Market structure

Fragmented

YoY growth 2023-2024(%)

13.49

Key countries

US, China, Germany, Mexico, and Japan

Competitive landscape

Leading Companies, Market Positioning of Companies, Competitive Strategies, and Industry Risks

Request Free Sample

Research Analyst Overview

  • The market continues to gain momentum as an innovative solution for enhancing agricultural productivity and contributing to climate change mitigation. This carbon-rich, porous material derived from the pyrolysis of biomass feedstocks offers numerous benefits for soil health and sustainability. One significant advantage of biochar is its ability to improve soil carbon sequestration and organic matter. By increasing soil carbon, biochar amendments can enhance yield and promote healthier crops. Additionally, biochar's porous structure improves water infiltration, water retention capacity, and cation exchange capacity, contributing to improved drainage and nutrient adsorption. Biochar also plays a role in waste valorization, transforming agricultural waste into a valuable resource.
  • Its slow-release fertilizer properties provide a continuous nutrient supply, reducing the need for synthetic fertilizers. Furthermore, biochar's high surface area and large pore size distribution facilitate microbial activity, including enzyme activity and microbial community structure, which are essential for carbon mineralization and ph buffering capacity. Beyond agriculture, biochar's applications extend to renewable energy, erosion control, and heavy metal remediation. Its electrical conductivity and potential for plant growth promotion make it a promising alternative for sustainable agriculture. Additionally, biochar's ability to sequester carbon and reduce greenhouse gas emissions makes it an attractive option for climate change mitigation efforts. Carbon dating techniques have been used to study the age and stability of biochar, demonstrating its long-term potential as a sustainable solution.
  • The ongoing research and development in this field continue to uncover new applications and optimize pyrolysis temperature and other factors to maximize the benefits of biochar.

What are the Key Data Covered in this Biochar Market Research and Growth Report?

  • What is the expected growth of the Biochar Market between 2024 and 2028?

    • USD 2.55 billion, at a CAGR of 16.08%

  • What segmentation does the market report cover?

    • The report segmented by Application (Farming, Livestock, and Others), Technology (Pyrolysis, Gasification, and Others), and Geography (North America, APAC, Europe, South America, and Middle East and Africa)

  • Which regions are analyzed in the report?

    • North America, APAC, Europe, South America, and Middle East and Africa

  • What are the key growth drivers and market challenges?

    • Helps in reducing emission, Costly investment

  • Who are the major players in the Biochar Market?

    • Key Companies Airex Energie Inc., American BioChar Co., American Eagle Outfitters Inc., Aries Clean Technologies LLC, ArSta eco Pvt. Ltd., Avello Bioenergy Inc., Biochar Now LLC, Biochar Solutions Inc., Biochar Supreme LLC, Bioforcetech Corp., Carbon Gold Ltd., Earth Systems Consulting Pty Ltd., ECOERA AB, Oregon Biochar Solutions, Pacific Biochar Benefit Corp., Phoenix Energy Group LLC, PYROPOWER, Seneca Farms Biochar LLC, Swiss Biochar Sarl, and Vow ASA

Market Research Insights

  • The market encompasses the production and application of biochar in various sectors, including soil amendment and Waste management. According to industry estimates, The market size was valued at USD1.2 billion in 2020, with a projected growth rate of 10% annually. This growth is driven by the economic viability of biochar as a soil amendment, offering benefits such as organic carbon storage, soil fertility enhancement, mineralization rate acceleration, and soil structure stabilization. Moreover, biochar application contributes to environmental benefits, including improved nutrient use efficiency, enhanced root development, long-term stability, and stress tolerance. Additionally, biochar production methods contribute to sustainable land management practices and carbon sequestration potential.
  • Furthermore, the integration of biochar in waste management strategies facilitates phosphorus solubilization, soil aggregation, and nitrogen fixation. The market's continuous evolution is reflected in ongoing research focusing on optimizing char production methods, enhancing crop resilience, and assessing the carbon cycle impact of biochar use. These green technologies offer significant potential for water use efficiency and improved plant uptake kinetics, making biochar a valuable resource for agriculture and the environment.

We can help! Our analysts can customize this biochar market research report to meet your requirements.

Get in touch

1 Executive Summary

  • 1.1 Market overview
    • Executive Summary - Chart on Market Overview
    • Executive Summary - Data Table on Market Overview
    • Executive Summary - Chart on Global Market Characteristics
    • Executive Summary - Chart on Market by Geography
    • Executive Summary - Chart on Market Segmentation by Application
    • Executive Summary - Chart on Market Segmentation by Technology
    • Executive Summary - Chart on Incremental Growth
    • Executive Summary - Data Table on Incremental Growth
    • Executive Summary - Chart on Company Market Positioning

2 Market Landscape

  • 2.1 Market ecosystem
    • Parent Market
    • Data Table on - Parent Market
  • 2.2 Market characteristics
    • Market characteristics analysis
  • 2.3 Value chain analysis
    • Value Chain Analysis

3 Market Sizing

  • 3.1 Market definition
    • Offerings of companies included in the market definition
  • 3.2 Market segment analysis
    • Market segments
  • 3.3 Market size 2023
    • 3.4 Market outlook: Forecast for 2023-2028
      • Chart on Global - Market size and forecast 2023-2028 ($ million)
      • Data Table on Global - Market size and forecast 2023-2028 ($ million)
      • Chart on Global Market: Year-over-year growth 2023-2028 (%)
      • Data Table on Global Market: Year-over-year growth 2023-2028 (%)

    4 Historic Market Size

    • 4.1 Global Biochar Market 2018 - 2022
      • Historic Market Size - Data Table on Global Biochar Market 2018 - 2022 ($ million)
    • 4.2 Application segment analysis 2018 - 2022
      • Historic Market Size - Application Segment 2018 - 2022 ($ million)
    • 4.3 Technology segment analysis 2018 - 2022
      • Historic Market Size - Technology Segment 2018 - 2022 ($ million)
    • 4.4 Geography segment analysis 2018 - 2022
      • Historic Market Size - Geography Segment 2018 - 2022 ($ million)
    • 4.5 Country segment analysis 2018 - 2022
      • Historic Market Size - Country Segment 2018 - 2022 ($ million)

    5 Five Forces Analysis

    • 5.1 Five forces summary
      • Five forces analysis - Comparison between 2023 and 2028
    • 5.2 Bargaining power of buyers
      • Bargaining power of buyers - Impact of key factors 2023 and 2028
    • 5.3 Bargaining power of suppliers
      • Bargaining power of suppliers - Impact of key factors in 2023 and 2028
    • 5.4 Threat of new entrants
      • Threat of new entrants - Impact of key factors in 2023 and 2028
    • 5.5 Threat of substitutes
      • Threat of substitutes - Impact of key factors in 2023 and 2028
    • 5.6 Threat of rivalry
      • Threat of rivalry - Impact of key factors in 2023 and 2028
    • 5.7 Market condition
      • Chart on Market condition - Five forces 2023 and 2028

    6 Market Segmentation by Application

    • 6.1 Market segments
      • Chart on Application - Market share 2023-2028 (%)
      • Data Table on Application - Market share 2023-2028 (%)
    • 6.2 Comparison by Application
      • Chart on Comparison by Application
      • Data Table on Comparison by Application
    • 6.3 Farming - Market size and forecast 2023-2028
      • Chart on Farming - Market size and forecast 2023-2028 ($ million)
      • Data Table on Farming - Market size and forecast 2023-2028 ($ million)
      • Chart on Farming - Year-over-year growth 2023-2028 (%)
      • Data Table on Farming - Year-over-year growth 2023-2028 (%)
    • 6.4 Livestock - Market size and forecast 2023-2028
      • Chart on Livestock - Market size and forecast 2023-2028 ($ million)
      • Data Table on Livestock - Market size and forecast 2023-2028 ($ million)
      • Chart on Livestock - Year-over-year growth 2023-2028 (%)
      • Data Table on Livestock - Year-over-year growth 2023-2028 (%)
    • 6.5 Others - Market size and forecast 2023-2028
      • Chart on Others - Market size and forecast 2023-2028 ($ million)
      • Data Table on Others - Market size and forecast 2023-2028 ($ million)
      • Chart on Others - Year-over-year growth 2023-2028 (%)
      • Data Table on Others - Year-over-year growth 2023-2028 (%)
    • 6.6 Market opportunity by Application
      • Market opportunity by Application ($ million)
      • Data Table on Market opportunity by Application ($ million)

    7 Market Segmentation by Technology

    • 7.1 Market segments
      • Chart on Technology - Market share 2023-2028 (%)
      • Data Table on Technology - Market share 2023-2028 (%)
    • 7.2 Comparison by Technology
      • Chart on Comparison by Technology
      • Data Table on Comparison by Technology
    • 7.3 Pyrolysis - Market size and forecast 2023-2028
      • Chart on Pyrolysis - Market size and forecast 2023-2028 ($ million)
      • Data Table on Pyrolysis - Market size and forecast 2023-2028 ($ million)
      • Chart on Pyrolysis - Year-over-year growth 2023-2028 (%)
      • Data Table on Pyrolysis - Year-over-year growth 2023-2028 (%)
    • 7.4 Gasification - Market size and forecast 2023-2028
      • Chart on Gasification - Market size and forecast 2023-2028 ($ million)
      • Data Table on Gasification - Market size and forecast 2023-2028 ($ million)
      • Chart on Gasification - Year-over-year growth 2023-2028 (%)
      • Data Table on Gasification - Year-over-year growth 2023-2028 (%)
    • 7.5 Others - Market size and forecast 2023-2028
      • Chart on Others - Market size and forecast 2023-2028 ($ million)
      • Data Table on Others - Market size and forecast 2023-2028 ($ million)
      • Chart on Others - Year-over-year growth 2023-2028 (%)
      • Data Table on Others - Year-over-year growth 2023-2028 (%)
    • 7.6 Market opportunity by Technology
      • Market opportunity by Technology ($ million)
      • Data Table on Market opportunity by Technology ($ million)

    8 Customer Landscape

    • 8.1 Customer landscape overview
      • Analysis of price sensitivity, lifecycle, customer purchase basket, adoption rates, and purchase criteria

    9 Geographic Landscape

    • 9.1 Geographic segmentation
      • Chart on Market share by geography 2023-2028 (%)
      • Data Table on Market share by geography 2023-2028 (%)
    • 9.2 Geographic comparison
      • Chart on Geographic comparison
      • Data Table on Geographic comparison
    • 9.3 North America - Market size and forecast 2023-2028
      • Chart on North America - Market size and forecast 2023-2028 ($ million)
      • Data Table on North America - Market size and forecast 2023-2028 ($ million)
      • Chart on North America - Year-over-year growth 2023-2028 (%)
      • Data Table on North America - Year-over-year growth 2023-2028 (%)
    • 9.4 APAC - Market size and forecast 2023-2028
      • Chart on APAC - Market size and forecast 2023-2028 ($ million)
      • Data Table on APAC - Market size and forecast 2023-2028 ($ million)
      • Chart on APAC - Year-over-year growth 2023-2028 (%)
      • Data Table on APAC - Year-over-year growth 2023-2028 (%)
    • 9.5 Europe - Market size and forecast 2023-2028
      • Chart on Europe - Market size and forecast 2023-2028 ($ million)
      • Data Table on Europe - Market size and forecast 2023-2028 ($ million)
      • Chart on Europe - Year-over-year growth 2023-2028 (%)
      • Data Table on Europe - Year-over-year growth 2023-2028 (%)
    • 9.6 South America - Market size and forecast 2023-2028
      • Chart on South America - Market size and forecast 2023-2028 ($ million)
      • Data Table on South America - Market size and forecast 2023-2028 ($ million)
      • Chart on South America - Year-over-year growth 2023-2028 (%)
      • Data Table on South America - Year-over-year growth 2023-2028 (%)
    • 9.7 Middle East and Africa - Market size and forecast 2023-2028
      • Chart on Middle East and Africa - Market size and forecast 2023-2028 ($ million)
      • Data Table on Middle East and Africa - Market size and forecast 2023-2028 ($ million)
      • Chart on Middle East and Africa - Year-over-year growth 2023-2028 (%)
      • Data Table on Middle East and Africa - Year-over-year growth 2023-2028 (%)
    • 9.8 US - Market size and forecast 2023-2028
      • Chart on US - Market size and forecast 2023-2028 ($ million)
      • Data Table on US - Market size and forecast 2023-2028 ($ million)
      • Chart on US - Year-over-year growth 2023-2028 (%)
      • Data Table on US - Year-over-year growth 2023-2028 (%)
    • 9.9 China - Market size and forecast 2023-2028
      • Chart on China - Market size and forecast 2023-2028 ($ million)
      • Data Table on China - Market size and forecast 2023-2028 ($ million)
      • Chart on China - Year-over-year growth 2023-2028 (%)
      • Data Table on China - Year-over-year growth 2023-2028 (%)
    • 9.10 Germany - Market size and forecast 2023-2028
      • Chart on Germany - Market size and forecast 2023-2028 ($ million)
      • Data Table on Germany - Market size and forecast 2023-2028 ($ million)
      • Chart on Germany - Year-over-year growth 2023-2028 (%)
      • Data Table on Germany - Year-over-year growth 2023-2028 (%)
    • 9.11 Mexico - Market size and forecast 2023-2028
      • Chart on Mexico - Market size and forecast 2023-2028 ($ million)
      • Data Table on Mexico - Market size and forecast 2023-2028 ($ million)
      • Chart on Mexico - Year-over-year growth 2023-2028 (%)
      • Data Table on Mexico - Year-over-year growth 2023-2028 (%)
    • 9.12 Japan - Market size and forecast 2023-2028
      • Chart on Japan - Market size and forecast 2023-2028 ($ million)
      • Data Table on Japan - Market size and forecast 2023-2028 ($ million)
      • Chart on Japan - Year-over-year growth 2023-2028 (%)
      • Data Table on Japan - Year-over-year growth 2023-2028 (%)
    • 9.13 Market opportunity by geography
      • Market opportunity by geography ($ million)
      • Data Tables on Market opportunity by geography ($ million)

    10 Drivers, Challenges, and Opportunity/Restraints

    • 10.1 Market drivers
      • 10.2 Market challenges
        • 10.3 Impact of drivers and challenges
          • Impact of drivers and challenges in 2023 and 2028
        • 10.4 Market opportunities/restraints

          11 Competitive Landscape

          • 11.1 Overview
            • 11.2 Competitive Landscape
              • Overview on criticality of inputs and factors of differentiation
            • 11.3 Landscape disruption
              • Overview on factors of disruption
            • 11.4 Industry risks
              • Impact of key risks on business

            12 Competitive Analysis

            • 12.1 Companies profiled
              • Companies covered
            • 12.2 Market positioning of companies
              • Matrix on companies position and classification
            • 12.3 Airex Energie Inc.
              • Airex Energie Inc. - Overview
              • Airex Energie Inc. - Product / Service
              • Airex Energie Inc. - Key offerings
            • 12.4 American BioChar Co.
              • American BioChar Co. - Overview
              • American BioChar Co. - Product / Service
              • American BioChar Co. - Key offerings
            • 12.5 American Eagle Outfitters Inc.
              • American Eagle Outfitters Inc. - Overview
              • American Eagle Outfitters Inc. - Business segments
              • American Eagle Outfitters Inc. - Key offerings
              • American Eagle Outfitters Inc. - Segment focus
            • 12.6 Aries Clean Technologies LLC
              • Aries Clean Technologies LLC - Overview
              • Aries Clean Technologies LLC - Product / Service
              • Aries Clean Technologies LLC - Key offerings
            • 12.7 ArSta eco Pvt. Ltd.
              • ArSta eco Pvt. Ltd. - Overview
              • ArSta eco Pvt. Ltd. - Product / Service
              • ArSta eco Pvt. Ltd. - Key offerings
            • 12.8 Biochar Now LLC
              • Biochar Now LLC - Overview
              • Biochar Now LLC - Product / Service
              • Biochar Now LLC - Key offerings
            • 12.9 Biochar Solutions Inc.
              • Biochar Solutions Inc. - Overview
              • Biochar Solutions Inc. - Product / Service
              • Biochar Solutions Inc. - Key offerings
            • 12.10 Biochar Supreme LLC
              • Biochar Supreme LLC - Overview
              • Biochar Supreme LLC - Product / Service
              • Biochar Supreme LLC - Key offerings
            • 12.11 Carbon Gold Ltd.
              • Carbon Gold Ltd. - Overview
              • Carbon Gold Ltd. - Product / Service
              • Carbon Gold Ltd. - Key offerings
            • 12.12 Earth Systems Consulting Pty Ltd.
              • Earth Systems Consulting Pty Ltd. - Overview
              • Earth Systems Consulting Pty Ltd. - Product / Service
              • Earth Systems Consulting Pty Ltd. - Key offerings
            • 12.13 ECOERA AB
              • ECOERA AB - Overview
              • ECOERA AB - Product / Service
              • ECOERA AB - Key offerings
            • 12.14 Pacific Biochar Benefit Corp.
              • Pacific Biochar Benefit Corp. - Overview
              • Pacific Biochar Benefit Corp. - Product / Service
              • Pacific Biochar Benefit Corp. - Key offerings
            • 12.15 Phoenix Energy Group LLC
              • Phoenix Energy Group LLC - Overview
              • Phoenix Energy Group LLC - Product / Service
              • Phoenix Energy Group LLC - Key offerings
            • 12.16 Swiss Biochar Sarl
              • Swiss Biochar Sarl - Overview
              • Swiss Biochar Sarl - Product / Service
              • Swiss Biochar Sarl - Key offerings
            • 12.17 Vow ASA
              • Vow ASA - Overview
              • Vow ASA - Business segments
              • Vow ASA - Key offerings
              • Vow ASA - Segment focus

            13 Appendix

            • 13.1 Scope of the report
              • 13.2 Inclusions and exclusions checklist
                • Inclusions checklist
                • Exclusions checklist
              • 13.3 Currency conversion rates for US$
                • Currency conversion rates for US$
              • 13.4 Research methodology
                • Research methodology
              • 13.5 Data procurement
                • Information sources
              • 13.6 Data validation
                • Data validation
              • 13.7 Validation techniques employed for market sizing
                • Validation techniques employed for market sizing
              • 13.8 Data synthesis
                • Data synthesis
              • 13.9 360 degree market analysis
                • 360 degree market analysis
              • 13.10 List of abbreviations
                • List of abbreviations

              Research Methodology

              Technavio presents a detailed picture of the market by way of study, synthesis, and summation of data from multiple sources. The analysts have presented the various facets of the market with a particular focus on identifying the key industry influencers. The data thus presented is comprehensive, reliable, and the result of extensive research, both primary and secondary.

              INFORMATION SOURCES

              Primary sources

              • Manufacturers and suppliers
              • Channel partners
              • Industry experts
              • Strategic decision makers

              Secondary sources

              • Industry journals and periodicals
              • Government data
              • Financial reports of key industry players
              • Historical data
              • Press releases

              DATA ANALYSIS

              Data Synthesis

              • Collation of data
              • Estimation of key figures
              • Analysis of derived insights

              Data Validation

              • Triangulation with data models
              • Reference against proprietary databases
              • Corroboration with industry experts

              REPORT WRITING

              Qualitative

              • Market drivers
              • Market challenges
              • Market trends
              • Five forces analysis

              Quantitative

              • Market size and forecast
              • Market segmentation
              • Geographical insights
              • Competitive landscape

              Interested in this report?

              Get your sample now to see our research methodology and insights!

              Download Now

              Frequently Asked Questions

              Biochar market growth will increase by $ 2554.2 mn during 2024-2028.

              The Biochar market is expected to grow at a CAGR of 16.08% during 2024-2028.

              Biochar market is segmented by Application( Farming, Livestock, Others) Technology( Pyrolysis, Gasification, Others, South America, MEA)

              Airex Energie Inc., American BioChar Co., American Eagle Outfitters Inc., Aries Clean Technologies LLC, ArSta eco Pvt. Ltd., Avello Bioenergy Inc., Biochar Now LLC, Biochar Solutions Inc., Biochar Supreme LLC, Bioforcetech Corp., Carbon Gold Ltd., Earth Systems Consulting Pty Ltd., ECOERA AB, Oregon Biochar Solutions, Pacific Biochar Benefit Corp., Phoenix Energy Group LLC, PYROPOWER, Seneca Farms Biochar LLC, Swiss Biochar Sarl, Vow ASA are a few of the key vendors in the Biochar market.

              North America will register the highest growth rate of 35% among the other regions. Therefore, the Biochar market in North America is expected to garner significant business opportunities for the vendors during the forecast period.

              US, China, Germany, Mexico, Japan

              • Helps in reducing emissionBurning biomass and spontaneous decomposition emit huge quantities of carbon dioxide and methane into the atmosphere. The biochar generation process emits CO2 (up to 50% of the biomass) is the driving factor this market.
              • while the remaining carbon content is endlessly stable. Biochar carbon has stayed in the ground for millennia is the driving factor this market.
              • delaying the increase in greenhouse gas levels in the atmosphere. At the same time is the driving factor this market.
              • its presence in the ground can improve water quality is the driving factor this market.
              • soil fertility is the driving factor this market.
              • and agricultural production and relieve strain on old-growth forests. Biochar is the driving factor this market.
              • like coal is the driving factor this market.
              • may trap carbon in the soil for hundreds to thousands of years. Researchers estimate that sustainable biochar use could reduce global net emissions of carbon dioxide (CO 2) is the driving factor this market.
              • methane is the driving factor this market.
              • and nitrous oxide by up to 1.8 Pg CO 2-C equivalent (CO 2-Ce) per year (12 percent of current anthropogenic CO 2-Ce emissions) is the driving factor this market.
              • and total net emissions by 130 Pg CO 2-Ce over the next century is the driving factor this market.
              • without endangering food security is the driving factor this market.
              • habitat is the driving factor this market.
              • or soil conservation. Biochar is a carbon-enriched biomaterial produced by biomass burning in a process known as pyrolysis. Biomass (e.g. is the driving factor this market.
              • agricultural and forestry residues is the driving factor this market.
              • manure is the driving factor this market.
              • municipal and industrial wastes) is degraded at temperatures above 400 C in the absence or near absence of oxygen in pyrolysis. Syngas is the driving factor this market.
              • bio-oil is the driving factor this market.
              • and biochar are created as a consequence. Because of its high carbon content (60-90%) is the driving factor this market.
              • incorporating biochar into soils is seen as a substantial and long-term solution to sinking atmospheric CO2 in terrestrial ecosystems. Furthermore is the driving factor this market.
              • because of the decreased fertilizer requirements is the driving factor this market.
              • biochar can minimize agricultural emissions from fertilizer use. Hence is the driving factor this market.
              • reduction in the emission is expected to be a driver for the growth of the market in focus during the forecast period. is the driving factor this market.

              The Biochar market vendors should focus on grabbing business opportunities from the Farming segment as it accounted for the largest market share in the base year.