Billboard Sign Manufacturing Market Analysis North America, Europe, APAC, South America, Middle East and Africa - US, China, UK, Canada, Japan - Size and Forecast 2024-2028

Billboard Sign Manufacturing Market Analysis North America, Europe, APAC, South America, Middle East and Africa - US, China, UK, Canada, Japan - Size and Forecast 2024-2028

Published: Jul 2024 157 Pages SKU: IRTNTR75064

Market Overview at a Glance

$9.37 B
Market Opportunity
3.71%
CAGR
3.05
YoY growth 2023-2024(%)

Billboard Sign Manufacturing Market Size 2024-2028

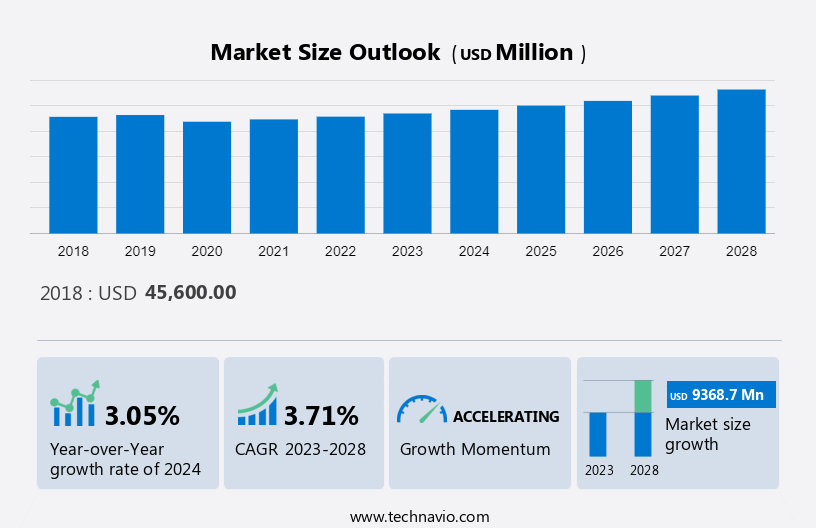
The billboard sign manufacturing market size is estimated to grow by USD 9.36 billion at a CAGR of 3.71% between 2023 and 2028. In the dynamic world of retail marketing, mall operators are leveraging technology to enhance the shopping experience and boost advertising effectiveness. One key offering is the high growth of retail space, which provides ample opportunity for brands to showcase their products. Moreover, the integration of analytics enables targeted and personalized ads, increasing their impact. Additionally, the use of outdoor ads in sync with mobile phones through beacon technology offers a seamless customer journey, bridging the gap between physical and digital marketing. This innovative approach not only attracts footfall but also ensures higher engagement and conversions.

What will be the Size of the Market During the Forecast Period?

Billboard Sign Manufacturing Market Size

To learn more about this report, View Report Sample

Market Dynamics and Customer Landscape

The market is evolving with innovations in backlit displays and 4K digitized sign displays. Companies are leveraging large-format printing and ultra HD digital signage solutions to enhance advertisement content and impact logos for maximum visibility. Strategic Factory, A Signs, and other industry leaders are incorporating embedded software and media players into digital signage boards to deliver dynamic, digitized promotion. Applications include building signage, pylon signs, monument signs, and vehicle graphics for fleet branding. Wayfinding and directional signs are becoming more sophisticated with gaze tracking and biometric technology. This market caters to diverse needs, from home monitoring systems to leak detector systems, all while adapting to the shift from traditional advertising and print marketing to innovative products and digital displays. Our researchers analyzed the data with 2023 as the base year, along with the key drivers, trends, and challenges. A holistic analysis of drivers will help companies refine their marketing strategies to gain a competitive advantage.

Key Market Driver

The high growth of retail space is notably driving the market growth.  The retail industry is growing rapidly due to the increasing demand for consumer goods and business expansion plans by retailers. Factors such as increasing urbanization, rising household incomes, and increasing demand for quality products and experiences are driving the growth of the retail sector. The growth of the global retail industry is similar in both developed and developing countries. In April 2021, China recorded a growth rate of around 17.7% compared to the same month in 2020. In the US. retail sales are up about 7.2% year-over-year in 2021.

Developing countries are also contributing to the growth of the global retail market, with countries such as India seeing high levels of investment in the retail sector. In March 2022, DLF, India's largest commercial property developer, announced a USD 241 million investment. DLF plans to expand its retail property portfolio and develop two new shopping centers. Moreover, in February 2021, the Indian retail industry reached around 93% of its pre-COVID-19 business levels. As retail space expands, manufacturing signage acceptance increases. A key factor in disseminating information, creating an engaging customer experience, and attracting more customers, signage can be used as part of a company's customer relationship management and marketing tools. Therefore, as the sales area expands, the demand for signboard production is expected to increase worldwide. These factors are expected to drive the growth of the market during the forecast period.  

Significant Market Trends

The advent of collaborative robots for billboard sign manufacturing is a key trend influencing market growth. Robots, also known as industrial robots, are widely used in the manufacturing industry around the world. These machines help companies optimize speed, improve accuracy and reduce reliance on human labor. Sign manufacturing uses industrial robots for tasks such as order picking, component assembly, final inspection, sorting, and packaging. In recent years, advances in robotics have led to the development of collaborative robots, also known as cobots. Collaborative robots can interact and work with humans. 

Cobots are compact, lightweight, and highly flexible. Cobots are widely used in sign manufacturing to assemble and test the electronic parts or components of signs. Vendors operating in the market are increasingly adopting cobots to help human workers manufacture products efficiently. Cobots are not only cost-effective, highly productive, and adaptable, but they also contribute to the sustainability of the supply chain. These benefits associated with the use of robots in sign manufacturing are expected to help sign manufacturers increase their revenues during the forecast period. 

Major Market Challenge

The growing popularity of digital marketing is challenging the market growth. Social media has become an important data source for many businesses as it allows US to provide instant feedback on content via blogs and social networks. Content developers and advertisers are using social computing tools for branding, marketing, and broadening knowledge management initiatives, which will improve cost-effective collaboration for their global workforce. Vendors are exploring new platforms to market their latest services, products, and solutions, and to receive public feedback and opinions, by registering on social networking sites such as Twitter and Facebook. The growing importance of sentiment analysis and advances in text analytics are driving companies to integrate social media into their business processes.

Digital marketing provides broad reach to target customers regardless of their geographic footprint. Businesses use online marketing through websites and social media platforms to increase brand awareness, sign-up, and grow their audience. The cost efficiency associated with digital marketing outperforms other advertising methods using low-frequency dunking sonar (LFDS) installations. Investing in digital marketing campaigns on social media is cost-effective and controllable. Additionally, the availability of various online marketing tools allows marketers to reach a wider audience at a lower cost. The continuous shortcoming of traditional marketing methods and the high costs associated with their installation is expected to increase digital marketing acceptance and decrease signage acceptance. This is expected to have a negative impact on the growth of the global sign manufacturing market during the forecast period. 

Key Market Customer Landscape

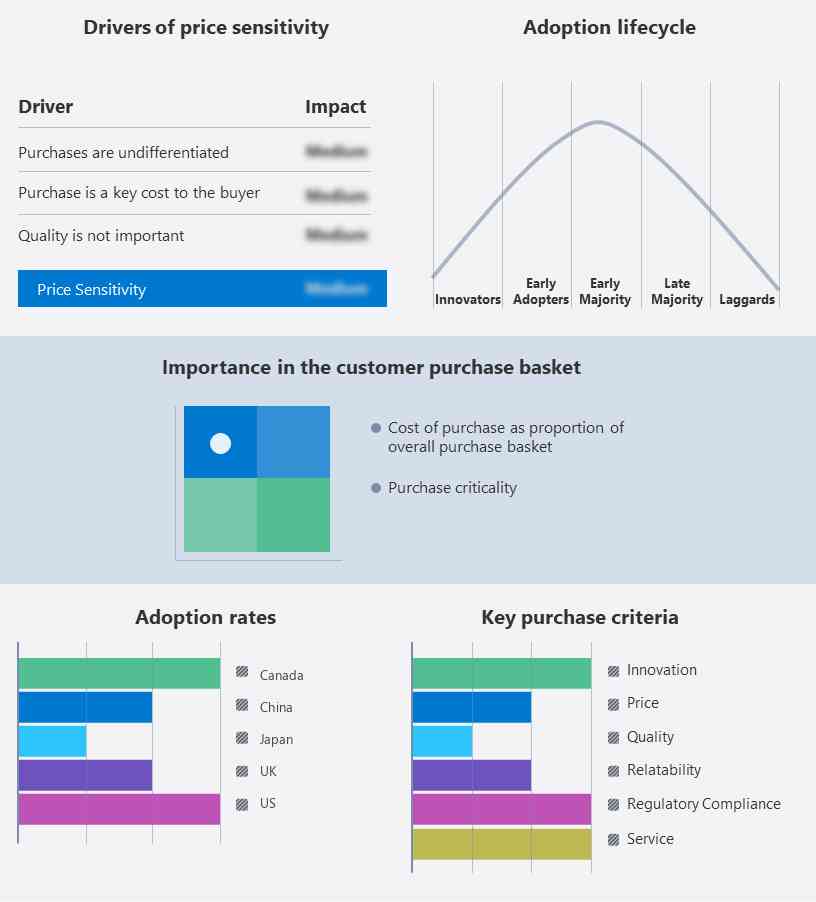
The report includes the adoption lifecycle of the market, covering from the innovator’s stage to the laggard’s stage. It focuses on adoption rates in different regions based on penetration. Furthermore, the report also includes key purchase criteria and drivers of price sensitivity to help companies evaluate and develop their growth strategies.

Billboard Sign Manufacturing Market Share by Geography

Global Market Customer Landscape

Who are the Major Market Companies?

Companies are implementing various strategies, such as strategic alliances, partnerships, mergers and acquisitions, geographical expansion, and product/service launches, to enhance their presence in the market.

APG SGA SA: The company deals in digital and analog poster advertising in railway stations, on streets and squares at airports, in shopping centers, and in transport facilities. The company offers billboard sign manufacturing for public spaces available across Switzerland in digital or analog and tailored according to the need.

The report also includes detailed analyses of the competitive landscape of the market and information about 15 market players, including:

  • Bennett Coleman and Co. Ltd.
  • Burkhart Advertising Inc.
  • Clear Channel Outdoor Holdings Inc.
  • Daktronics Inc.
  • Drury Displays Inc.
  • Euro Media Group
  • EyeMedia
  • Fairway Outdoor LLC
  • Global Media and Entertainment Ltd.
  • IZON Global Media
  • JCDecaux SE
  • Kesion Co. Ltd.
  • Nomadic Genius LLC
  • oOh media Ltd.
  • OUTFRONT Media Inc.

Qualitative and quantitative analysis of vendors has been conducted to help clients understand the wider business environment as well as the strengths and weaknesses of key market players. Data is qualitatively analyzed to categorize vendors as pure play, category-focused, industry-focused, and diversified; it is quantitatively analyzed to categorize vendors as dominant, leading, strong, tentative, and weak.

Market Segmentation

By End-User

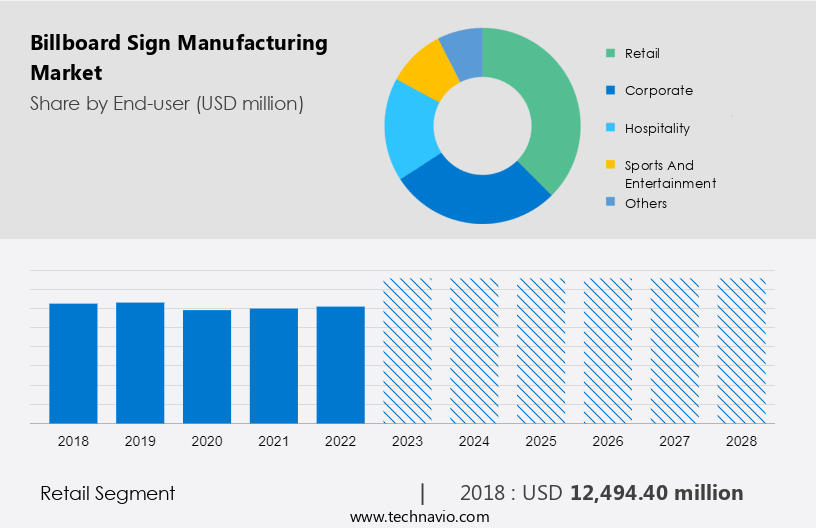
The market share growth by the retail segment will be significant during the forecast period. Retail is one of the key industries contributing to the growth of the market. As the competition among retailers increases, businesses are looking for new ways to attract customers and provide innovative customer service. Retailers are looking to integrate games, interactive gesture recognition, smartphone applications, social media applications, and interactive touch recognition capabilities into their digital billboards.

Billboard Sign Manufacturing Market Size

Get a glance at the market contribution of various segments View the PDF Sample

The retail segment was valued at USD 12.49 billion in 2018. Digital signage offers many advantages over traditional signage as it facilitates customer interaction, provides precise and centralized control, and offers superior design options. Retailers use digital billboards to provide information about discount updates and in-store product offers. Retailers also use digital signage to disseminate business information and specific product information to sell more products to their customers. Many retailers in the apparel industry use digital billboards to support their customers' shopping experiences. These factors are anticipated to drive the growth of this market segment during the forecast period.  

By Region

Billboard Sign Manufacturing Market Share by Geography

For more insights on the market share of various regions Download PDF Sample now!

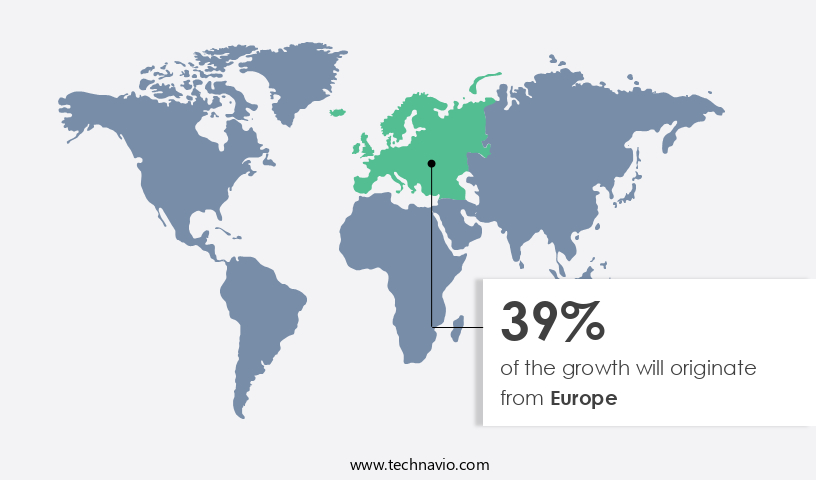
Europe is estimated to contribute 39% to the growth of the global market during the forecast period. Technavio’s analysts have elaborately explained the regional trends and drivers that shape the market during the forecast period.

Countries such as Canada, Mexico, and the United States are the largest contributors to sales in the market in North America. The North American signage manufacturing market has been primarily driven by a high demand for signage solutions. Businesses across all industries implement billboard solutions to engage customers, increase customer retention, and derive actionable insights based on audience analytics. Additionally, North American companies are looking for high-definition billboard solutions to offer their customers a unique experience. Various vendors in this region also offer a variety of digital billboard options tailored to the end user's needs. This includes a small high-definition digital billboard for up-close viewing. Therefore, these factors are expected to increase the adoption of signage and are expected to boost the growth of the regional market during the forecast period. 

Segment Overview

The market research report provides comprehensive data (region-wise segment analysis), with forecasts and estimates in "USD billion " for the period 2024-2028, as well as historical data from 2018-2022 for the following segments.

  • End-user Outlook 
    • Retail
    • Corporate
    • Hospitality
    • Sports and entertainment
    • Others
  • Region Outlook 
    • North America
      • The U.S.
      • Canada
    • Europe
      • The U.K.
      • Germany
      • France
      • Rest of Europe
    • APAC
      • China
      • India
    • South America
      • Chile
      • Brazil
    • Middle East & Africa
      • Saudi Arabia
      • South Africa
      • Rest of the Middle East & Africa

You may also interested in the below market reports

  • Digital OOH Market Analysis APAC, North America, Europe, Middle East and Africa, South America - US, Canada, China, Japan, Germany - Size and Forecast

  • Out of Home Advertising Market by Platform, Type, and Geography - Forecast and Analysis

  • Printed Signage Market Analysis APAC, North America, Europe, South America, Middle East and Africa - US, China, Japan, UK, Germany - Size and Forecast 

Market Analyst Overview

The market is dynamically evolving with the integration of ultra HD digital signage solutions and advanced display technologies such as OLED, Super AMOLED, and UHD. Companies are leveraging media players and software & hardware compatibility to deliver high-resolution banners, posters, and video walls. Innovations in PVC-based media and transparent LED screens cater to diverse needs, from e-commerce and real estate to automobiles and consumer durables. Media owners and tech companies are embracing artificial intelligence and machine learning to enhance touchless & interactive solutions and optimize display screens for foot traffic and hyperlocal services. Partnerships and collaborations drive growth across sectors like hospitality, banking, and entertainment, reflecting a shift towards online advertisement & broadcast and 5G technology integration. The market also focuses on maintenance, consulting, and complex taxations to ensure effective integration & installation and compliance with regulatory processes.

Market Scope

Report Coverage

Details

Page number

157

Base year

2023

Historic period

2018 - 2022

Forecast period

2024-2028

Growth momentum & CAGR

Accelerate at a CAGR of 3.71%

Market growth 2024-2028

USD 9.36 billion

Market structure

Fragmented

YoY growth 2023-2024(%)

3.05

Regional analysis

North America, Europe, APAC, South America, and Middle East and Africa

Performing market contribution

Europe at 39%

Key countries

US, China, UK, Canada, and Japan

Competitive landscape

Leading Companies, Market Positioning of Companies, Competitive Strategies, and Industry Risks

Key companies profiled

APG SGA SA, Bennett Coleman and Co. Ltd., Burkhart Advertising Inc., Clear Channel Outdoor Holdings Inc., Daktronics Inc., Drury Displays Inc., Euro Media Group, EyeMedia, Fairway Outdoor LLC, Global Media Group Services Ltd., IZON Global Media, JCDecaux SE, Kesion Co. Ltd., Nomadic Genius LLC, oOh media Ltd., OUTFRONT Media Inc., Primedia Pty Ltd., Stroer SE and Co. KGaA, Talon Outdoor Ltd., and Total Outdoor Media

Market dynamics

Parent market analysis, Market Forecasting, Market growth inducers and obstacles, Fast-growing and slow-growing segment analysis, Market growth and Forecasting, COVID-19 impact and recovery analysis and future consumer dynamics, Market condition analysis for market forecast period

Customization purview

If our report has not included the data that you are looking for, you can reach out to our analysts and get segments customized.

View the PDF sample

What are the Key Data Covered in this Market Report?

  • CAGR of the market during the forecast period
  • Detailed information on factors that will drive the market growth and forecasting of the market between 2024 and 2028
  • Precise estimation of the size of the market size and its contribution to the parent market
  • Accurate predictions about upcoming market trends and analysis and changes in consumer behavior
  • Growth of the market industry across Europe, North America, APAC, South America, and Middle East and Africa
  • Thorough market growth analysis of the market’s competitive landscape and detailed information about companies
  • Comprehensive market analysis and report on the factors that will challenge the market research and growth of market companies

We can help! Our analysts can customize this market research report to meet your requirements. Get in touch

1 Executive Summary

  • 1.1 Market overview
    • Executive Summary - Chart on Market Overview
    • Executive Summary - Data Table on Market Overview
    • Executive Summary - Chart on Global Market Characteristics
    • Executive Summary - Chart on Market by Geography
    • Executive Summary - Chart on Market Segmentation by End-user
    • Executive Summary - Chart on Incremental Growth
    • Executive Summary - Data Table on Incremental Growth
    • Executive Summary - Chart on Company Market Positioning

2 Market Landscape

  • 2.1 Market ecosystem
    • Parent Market
    • Data Table on - Parent Market
  • 2.2 Market characteristics
    • Market characteristics analysis
  • 2.3 Value chain analysis
    • Value Chain Analysis

3 Market Sizing

  • 3.1 Market definition
    • Offerings of companies included in the market definition
  • 3.2 Market segment analysis
    • Market segments
  • 3.3 Market size 2023
    • 3.4 Market outlook: Forecast for 2023-2028
      • Chart on Global - Market size and forecast 2023-2028 ($ million)
      • Data Table on Global - Market size and forecast 2023-2028 ($ million)
      • Chart on Global Market: Year-over-year growth 2023-2028 (%)
      • Data Table on Global Market: Year-over-year growth 2023-2028 (%)

    4 Historic Market Size

    • 4.1 Global Billboard Sign Manufacturing Market 2018 - 2022
      • Historic Market Size - Data Table on Global Billboard Sign Manufacturing Market 2018 - 2022 ($ million)
    • 4.2 End-user segment analysis 2018 - 2022
      • Historic Market Size - End-user Segment 2018 - 2022 ($ million)
    • 4.3 Geography segment analysis 2018 - 2022
      • Historic Market Size - Geography Segment 2018 - 2022 ($ million)
    • 4.4 Country segment analysis 2018 - 2022
      • Historic Market Size - Country Segment 2018 - 2022 ($ million)

    5 Five Forces Analysis

    • 5.1 Five forces summary
      • Five forces analysis - Comparison between 2023 and 2028
    • 5.2 Bargaining power of buyers
      • Bargaining power of buyers - Impact of key factors 2023 and 2028
    • 5.3 Bargaining power of suppliers
      • Bargaining power of suppliers - Impact of key factors in 2023 and 2028
    • 5.4 Threat of new entrants
      • Threat of new entrants - Impact of key factors in 2023 and 2028
    • 5.5 Threat of substitutes
      • Threat of substitutes - Impact of key factors in 2023 and 2028
    • 5.6 Threat of rivalry
      • Threat of rivalry - Impact of key factors in 2023 and 2028
    • 5.7 Market condition
      • Chart on Market condition - Five forces 2023 and 2028

    6 Market Segmentation by End-user

    • 6.1 Market segments
      • Chart on End-user - Market share 2023-2028 (%)
      • Data Table on End-user - Market share 2023-2028 (%)
    • 6.2 Comparison by End-user
      • Chart on Comparison by End-user
      • Data Table on Comparison by End-user
    • 6.3 Retail - Market size and forecast 2023-2028
      • Chart on Retail - Market size and forecast 2023-2028 ($ million)
      • Data Table on Retail - Market size and forecast 2023-2028 ($ million)
      • Chart on Retail - Year-over-year growth 2023-2028 (%)
      • Data Table on Retail - Year-over-year growth 2023-2028 (%)
    • 6.4 Corporate - Market size and forecast 2023-2028
      • Chart on Corporate - Market size and forecast 2023-2028 ($ million)
      • Data Table on Corporate - Market size and forecast 2023-2028 ($ million)
      • Chart on Corporate - Year-over-year growth 2023-2028 (%)
      • Data Table on Corporate - Year-over-year growth 2023-2028 (%)
    • 6.5 Hospitality - Market size and forecast 2023-2028
      • Chart on Hospitality - Market size and forecast 2023-2028 ($ million)
      • Data Table on Hospitality - Market size and forecast 2023-2028 ($ million)
      • Chart on Hospitality - Year-over-year growth 2023-2028 (%)
      • Data Table on Hospitality - Year-over-year growth 2023-2028 (%)
    • 6.6 Transportation - Market size and forecast 2023-2028
      • Chart on Transportation - Market size and forecast 2023-2028 ($ million)
      • Data Table on Transportation - Market size and forecast 2023-2028 ($ million)
      • Chart on Transportation - Year-over-year growth 2023-2028 (%)
      • Data Table on Transportation - Year-over-year growth 2023-2028 (%)
    • 6.7 Others - Market size and forecast 2023-2028
      • Chart on Others - Market size and forecast 2023-2028 ($ million)
      • Data Table on Others - Market size and forecast 2023-2028 ($ million)
      • Chart on Others - Year-over-year growth 2023-2028 (%)
      • Data Table on Others - Year-over-year growth 2023-2028 (%)
    • 6.8 Market opportunity by End-user
      • Market opportunity by End-user ($ million)
      • Data Table on Market opportunity by End-user ($ million)

    7 Customer Landscape

    • 7.1 Customer landscape overview
      • Analysis of price sensitivity, lifecycle, customer purchase basket, adoption rates, and purchase criteria

    8 Geographic Landscape

    • 8.1 Geographic segmentation
      • Chart on Market share by geography 2023-2028 (%)
      • Data Table on Market share by geography 2023-2028 (%)
    • 8.2 Geographic comparison
      • Chart on Geographic comparison
      • Data Table on Geographic comparison
    • 8.3 North America - Market size and forecast 2023-2028
      • Chart on North America - Market size and forecast 2023-2028 ($ million)
      • Data Table on North America - Market size and forecast 2023-2028 ($ million)
      • Chart on North America - Year-over-year growth 2023-2028 (%)
      • Data Table on North America - Year-over-year growth 2023-2028 (%)
    • 8.4 Europe - Market size and forecast 2023-2028
      • Chart on Europe - Market size and forecast 2023-2028 ($ million)
      • Data Table on Europe - Market size and forecast 2023-2028 ($ million)
      • Chart on Europe - Year-over-year growth 2023-2028 (%)
      • Data Table on Europe - Year-over-year growth 2023-2028 (%)
    • 8.5 APAC - Market size and forecast 2023-2028
      • Chart on APAC - Market size and forecast 2023-2028 ($ million)
      • Data Table on APAC - Market size and forecast 2023-2028 ($ million)
      • Chart on APAC - Year-over-year growth 2023-2028 (%)
      • Data Table on APAC - Year-over-year growth 2023-2028 (%)
    • 8.6 South America - Market size and forecast 2023-2028
      • Chart on South America - Market size and forecast 2023-2028 ($ million)
      • Data Table on South America - Market size and forecast 2023-2028 ($ million)
      • Chart on South America - Year-over-year growth 2023-2028 (%)
      • Data Table on South America - Year-over-year growth 2023-2028 (%)
    • 8.7 Middle East and Africa - Market size and forecast 2023-2028
      • Chart on Middle East and Africa - Market size and forecast 2023-2028 ($ million)
      • Data Table on Middle East and Africa - Market size and forecast 2023-2028 ($ million)
      • Chart on Middle East and Africa - Year-over-year growth 2023-2028 (%)
      • Data Table on Middle East and Africa - Year-over-year growth 2023-2028 (%)
    • 8.8 US - Market size and forecast 2023-2028
      • Chart on US - Market size and forecast 2023-2028 ($ million)
      • Data Table on US - Market size and forecast 2023-2028 ($ million)
      • Chart on US - Year-over-year growth 2023-2028 (%)
      • Data Table on US - Year-over-year growth 2023-2028 (%)
    • 8.9 China - Market size and forecast 2023-2028
      • Chart on China - Market size and forecast 2023-2028 ($ million)
      • Data Table on China - Market size and forecast 2023-2028 ($ million)
      • Chart on China - Year-over-year growth 2023-2028 (%)
      • Data Table on China - Year-over-year growth 2023-2028 (%)
    • 8.10 UK - Market size and forecast 2023-2028
      • Chart on UK - Market size and forecast 2023-2028 ($ million)
      • Data Table on UK - Market size and forecast 2023-2028 ($ million)
      • Chart on UK - Year-over-year growth 2023-2028 (%)
      • Data Table on UK - Year-over-year growth 2023-2028 (%)
    • 8.11 Canada - Market size and forecast 2023-2028
      • Chart on Canada - Market size and forecast 2023-2028 ($ million)
      • Data Table on Canada - Market size and forecast 2023-2028 ($ million)
      • Chart on Canada - Year-over-year growth 2023-2028 (%)
      • Data Table on Canada - Year-over-year growth 2023-2028 (%)
    • 8.12 Japan - Market size and forecast 2023-2028
      • Chart on Japan - Market size and forecast 2023-2028 ($ million)
      • Data Table on Japan - Market size and forecast 2023-2028 ($ million)
      • Chart on Japan - Year-over-year growth 2023-2028 (%)
      • Data Table on Japan - Year-over-year growth 2023-2028 (%)
    • 8.13 Market opportunity by geography
      • Market opportunity by geography ($ million)
      • Data Tables on Market opportunity by geography ($ million)

    9 Drivers, Challenges, and Opportunity/Restraints

    • 9.1 Market drivers
      • 9.2 Market challenges
        • 9.3 Impact of drivers and challenges
          • Impact of drivers and challenges in 2023 and 2028
        • 9.4 Market opportunities/restraints

          10 Competitive Landscape

          • 10.1 Overview
            • 10.2 Competitive Landscape
              • Overview on criticality of inputs and factors of differentiation
            • 10.3 Landscape disruption
              • Overview on factors of disruption
            • 10.4 Industry risks
              • Impact of key risks on business

            11 Competitive Analysis

            • 11.1 Companies profiled
              • Companies covered
            • 11.2 Market positioning of companies
              • Matrix on companies position and classification
            • 11.3 APG SGA SA
              • APG SGA SA - Overview
              • APG SGA SA - Product / Service
              • APG SGA SA - Key offerings
            • 11.4 Burkhart Advertising Inc.
              • Burkhart Advertising Inc. - Overview
              • Burkhart Advertising Inc. - Product / Service
              • Burkhart Advertising Inc. - Key offerings
            • 11.5 Clear Channel Outdoor Holdings Inc.
              • Clear Channel Outdoor Holdings Inc. - Overview
              • Clear Channel Outdoor Holdings Inc. - Business segments
              • Clear Channel Outdoor Holdings Inc. - Key offerings
              • Clear Channel Outdoor Holdings Inc. - Segment focus
            • 11.6 Daktronics Inc.
              • Daktronics Inc. - Overview
              • Daktronics Inc. - Business segments
              • Daktronics Inc. - Key offerings
              • Daktronics Inc. - Segment focus
            • 11.7 Drury Displays Inc.
              • Drury Displays Inc. - Overview
              • Drury Displays Inc. - Product / Service
              • Drury Displays Inc. - Key offerings
            • 11.8 Euro Media Group
              • Euro Media Group - Overview
              • Euro Media Group - Product / Service
              • Euro Media Group - Key offerings
            • 11.9 Fairway Outdoor LLC
              • Fairway Outdoor LLC - Overview
              • Fairway Outdoor LLC - Product / Service
              • Fairway Outdoor LLC - Key offerings
            • 11.10 Global Media Group Services Ltd.
              • Global Media Group Services Ltd. - Overview
              • Global Media Group Services Ltd. - Product / Service
              • Global Media Group Services Ltd. - Key news
              • Global Media Group Services Ltd. - Key offerings
            • 11.11 JCDecaux SE
              • JCDecaux SE - Overview
              • JCDecaux SE - Business segments
              • JCDecaux SE - Key offerings
              • JCDecaux SE - Segment focus
            • 11.12 Kesion Co. Ltd.
              • Kesion Co. Ltd. - Overview
              • Kesion Co. Ltd. - Product / Service
              • Kesion Co. Ltd. - Key offerings
            • 11.13 oOh media Ltd.
              • oOh media Ltd. - Overview
              • oOh media Ltd. - Product / Service
              • oOh media Ltd. - Key offerings
            • 11.14 OUTFRONT Media Inc.
              • OUTFRONT Media Inc. - Overview
              • OUTFRONT Media Inc. - Business segments
              • OUTFRONT Media Inc. - Key offerings
              • OUTFRONT Media Inc. - Segment focus
            • 11.15 Stroer SE and Co. KGaA
              • Stroer SE and Co. KGaA - Overview
              • Stroer SE and Co. KGaA - Business segments
              • Stroer SE and Co. KGaA - Key offerings
              • Stroer SE and Co. KGaA - Segment focus
            • 11.16 Talon Outdoor Ltd.
              • Talon Outdoor Ltd. - Overview
              • Talon Outdoor Ltd. - Product / Service
              • Talon Outdoor Ltd. - Key offerings
            • 11.17 Total Outdoor Media
              • Total Outdoor Media - Overview
              • Total Outdoor Media - Product / Service
              • Total Outdoor Media - Key offerings

            12 Appendix

            • 12.1 Scope of the report
              • 12.2 Inclusions and exclusions checklist
                • Inclusions checklist
                • Exclusions checklist
              • 12.3 Currency conversion rates for US$
                • Currency conversion rates for US$
              • 12.4 Research methodology
                • Research methodology
              • 12.5 Data procurement
                • Information sources
              • 12.6 Data validation
                • Data validation
              • 12.7 Validation techniques employed for market sizing
                • Validation techniques employed for market sizing
              • 12.8 Data synthesis
                • Data synthesis
              • 12.9 360 degree market analysis
                • 360 degree market analysis
              • 12.10 List of abbreviations
                • List of abbreviations

              Research Methodology

              Technavio presents a detailed picture of the market by way of study, synthesis, and summation of data from multiple sources. The analysts have presented the various facets of the market with a particular focus on identifying the key industry influencers. The data thus presented is comprehensive, reliable, and the result of extensive research, both primary and secondary.

              INFORMATION SOURCES

              Primary sources

              • Manufacturers and suppliers
              • Channel partners
              • Industry experts
              • Strategic decision makers

              Secondary sources

              • Industry journals and periodicals
              • Government data
              • Financial reports of key industry players
              • Historical data
              • Press releases

              DATA ANALYSIS

              Data Synthesis

              • Collation of data
              • Estimation of key figures
              • Analysis of derived insights

              Data Validation

              • Triangulation with data models
              • Reference against proprietary databases
              • Corroboration with industry experts

              REPORT WRITING

              Qualitative

              • Market drivers
              • Market challenges
              • Market trends
              • Five forces analysis

              Quantitative

              • Market size and forecast
              • Market segmentation
              • Geographical insights
              • Competitive landscape

              Interested in this report?

              Get your sample now to see our research methodology and insights!

              Download Now

              Frequently Asked Questions

              Billboard Sign Manufacturing market growth will increase by $ 9368.7 mn during 2024-2028.

              The Billboard Sign Manufacturing market is expected to grow at a CAGR of 3.71% during 2024-2028.

              Billboard Sign Manufacturing market is segmented by End-user( Retail, Corporate, Hospitality, Sports and entertainment, Others)

              APG SGA SA, Bennett Coleman and Co. Ltd., Burkhart Advertising Inc., Clear Channel Outdoor Holdings Inc., Daktronics Inc., Drury Displays Inc., Euro Media Group, EyeMedia, Fairway Outdoor LLC, Global Media Group Services Ltd., IZON Global Media, JCDecaux SE, Kesion Co. Ltd., Nomadic Genius LLC, oOh media Ltd., OUTFRONT Media Inc., Primedia Pty Ltd., Stroer SE and Co. KGaA, Talon Outdoor Ltd., Total Outdoor Media are a few of the key vendors in the Billboard Sign Manufacturing market.

              Europe will register the highest growth rate of 39% among the other regions. Therefore, the Billboard Sign Manufacturing market in Europe is expected to garner significant business opportunities for the vendors during the forecast period.

              US, China, UK, Canada, Japan

              • High growth of retail spaceThe high growth of the retail industry can be attributed to a rise in demand for consumer goods is the driving factor this market.
              • promoting the retailers to expand their market presence. Factors such as increasing urbanization is the driving factor this market.
              • growing household incomes is the driving factor this market.
              • and the rise in demand for quality products and experiences have led to high growth in the retail industry. The growth in the global retail industry is similar in developed and developing countries. China registered a growth rate of around 17.7% in April 2021 as compared to the same month in the previous year. Besides is the driving factor this market.
              • retail sales in the US grew at a rate of around 7.2% in 2021 as compared to that of the previous year. Developing countries are also adding to the growth of the global retail market is the driving factor this market.
              • with countries such as India recording high investments in the retail sector. In March 2022 is the driving factor this market.
              • DLF is the driving factor this market.
              • India's largest commercial real estate developer is the driving factor this market.
              • announced an investment of $241 million. DLF is expanding its retail real estate portfolio and will develop two new shopping malls. Furthermore is the driving factor this market.
              • in February 2021 is the driving factor this market.
              • the retail industry in India achieved approximately 93% of the pre-COVID-19 levels of business. With the expanding retail space is the driving factor this market.
              • the adoption of billboard sign manufacturing will rise. Billboard sign is the driving factor this market.
              • being a prominent enabler for information dissemination is the driving factor this market.
              • creating engaging customer experiences is the driving factor this market.
              • and attracting more customers is the driving factor this market.
              • can be deployed as a part of customer relationship management and marketing tools for companies. Thus is the driving factor this market.
              • with the growing retail space is the driving factor this market.
              • the demand for billboard sign manufacturing is expected to increase globally. Hence is the driving factor this market.
              • such factors are expected to fuel the growth of the market in focus during the forecast period. is the driving factor this market.

              The Billboard Sign Manufacturing market vendors should focus on grabbing business opportunities from the Retail segment as it accounted for the largest market share in the base year.