Beauty Camera Apps Market Analysis, Size, and Forecast 2026-2030: APAC (China, India, and Japan), North America (US, Canada, and Mexico), Europe (Germany, UK, and France), South America (Brazil, Argentina, and Colombia), Middle East and Africa (Saudi Arabia, UAE, and South Africa), and Rest of World (ROW)

Beauty Camera Apps Market Analysis, Size, and Forecast 2026-2030:
APAC (China, India, and Japan), North America (US, Canada, and Mexico), Europe (Germany, UK, and France), South America (Brazil, Argentina, and Colombia), Middle East and Africa (Saudi Arabia, UAE, and South Africa), and Rest of World (ROW)

Published: Jan 2026 282 Pages SKU: IRTNTR74436

Market Overview at a Glance

$2.12 B
Market Opportunity
17.2%
CAGR 2025 - 2030
49%
APAC Growth
$659.3 Mn
Android segment 2024

Beauty Camera Apps Market Size 2026-2030

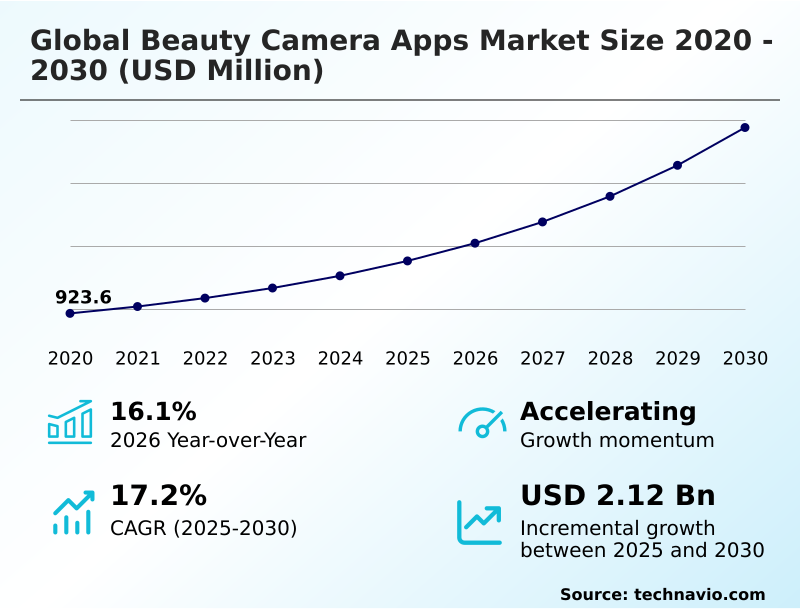
The beauty camera apps market size is valued to increase by USD 2.12 billion, at a CAGR of 17.2% from 2025 to 2030. Increasing smartphone penetration globally will drive the beauty camera apps market.

Major Market Trends & Insights

  • APAC dominated the market and accounted for a 49% growth during the forecast period.
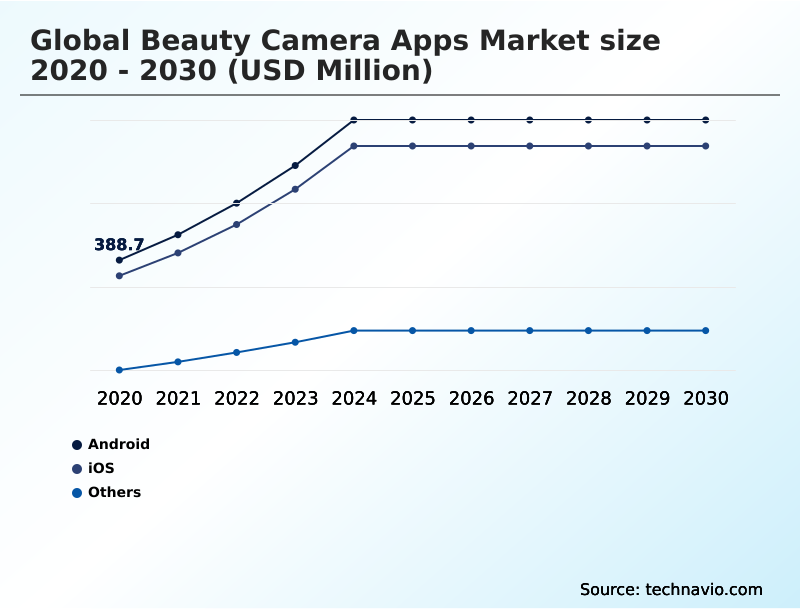
  • By Product Type - Android segment was valued at USD 659.3 million in 2024
  • By Solution - Free with in-app purchases segment accounted for the largest market revenue share in 2024

Market Size & Forecast

  • Market Opportunities: USD 2.96 billion
  • Market Future Opportunities: USD 2.12 billion
  • CAGR from 2025 to 2030 : 17.2%

Market Summary

  • The beauty camera apps market is defined by rapid technological evolution, centered on sophisticated artificial intelligence and augmented reality. The industry has moved beyond simple filters to complex generative AI models that offer high-fidelity digital enhancements. This progression is fueled by the rising influence of social media platforms and growing consumer demand for professional-grade editing tools on mobile devices.
  • A key business application involves e-commerce integration, where a cosmetics brand can deploy a virtual makeup application using 3D facial reconstruction. This allows customers to engage in a virtual try-on experience, significantly boosting user engagement and driving sales without the need for physical product samples.
  • However, the market's trajectory is tempered by significant challenges, including intense competition from free applications and growing consumer concerns regarding the privacy and use of facial data. Success in this landscape requires continuous innovation in features, monetization strategies, and a commitment to data security.
  • Vendors are focusing on creating unique, value-added experiences that free alternatives cannot easily replicate, such as hyper-realistic AR effects and advanced video editing capabilities.

What will be the Size of the Beauty Camera Apps Market during the forecast period?

Get Key Insights on Market Forecast (PDF) Request Free Sample

How is the Beauty Camera Apps Market Segmented?

The beauty camera apps industry research report provides comprehensive data (region-wise segment analysis), with forecasts and estimates in "USD million" for the period 2026-2030, as well as historical data from 2020-2024 for the following segments.

  • Product type
    • Android
    • iOS
    • Others
  • Solution
    • Free with in-app purchases
    • Freemium
    • Paid subscription
  • Type
    • Standalone apps
    • Integrated into social media platforms
    • Camera accessories
  • Geography
    • APAC
      • China
      • India
      • Japan
    • North America
      • US
      • Canada
      • Mexico
    • Europe
      • Germany
      • UK
      • France
    • South America
      • Brazil
      • Argentina
      • Colombia
    • Middle East and Africa
      • Saudi Arabia
      • UAE
      • South Africa
    • Rest of World (ROW)

By Product Type Insights

The android segment is estimated to witness significant growth during the forecast period.

The market is segmented by product type, solution, and geography. The Android segment is a significant market force, driven by a diverse hardware ecosystem and a large global user base.

Developers in this space face challenges related to device fragmentation, which they address by leveraging advanced photo enhancement APIs and photo retouching SDKs. The increasing adoption of on-device AI processing is critical for delivering low-latency, privacy-centric experiences.

As core AI-powered photo editing features become standard in native operating systems, third-party app developers are compelled to innovate with specialized portrait editing tools and deep learning models.

This competition has accelerated the integration of sophisticated facial feature mapping, with some platforms achieving a 99% accuracy rate in real-time facial landmark detection, enabling more realistic digital enhancements and personalized user experiences.

Request Free Sample

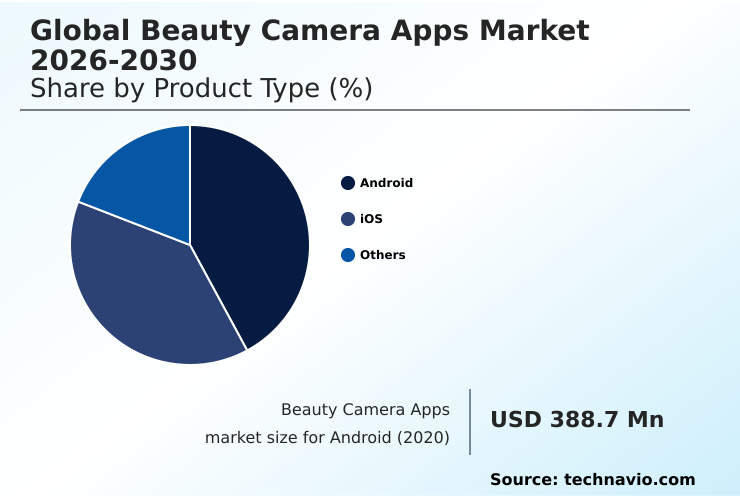
The Android segment was valued at USD 659.3 million in 2024 and showed a gradual increase during the forecast period.

Request Free Sample

Regional Analysis

APAC is estimated to contribute 49% to the growth of the global market during the forecast period.Technavio’s analysts have elaborately explained the regional trends and drivers that shape the market during the forecast period.

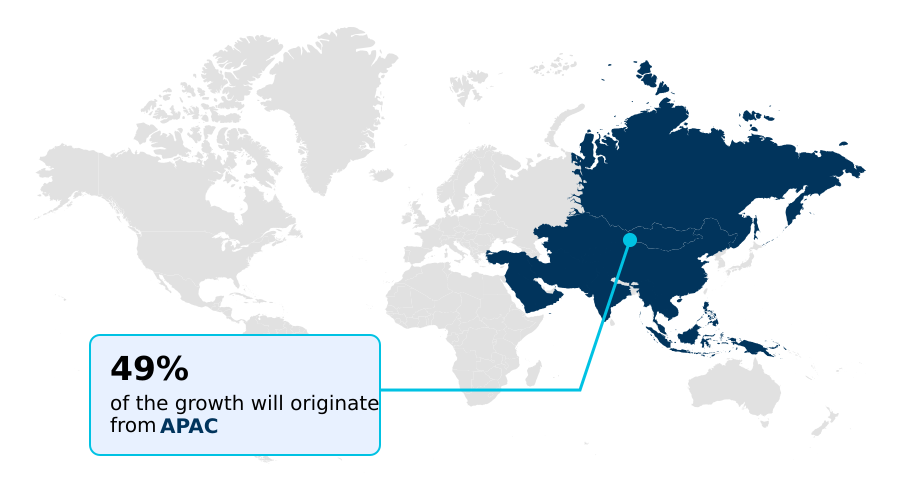
See How Beauty Camera Apps Market Demand is Rising in APAC Request Free Sample

The geographic landscape of the market is led by the APAC region, which is projected to contribute approximately 49% of the market's incremental growth.

This dominance is fueled by a strong culture of digital self-expression in countries like China and high smartphone penetration in India.

In these markets, there is a strong demand for localized predictive AI filters and virtual hairstyle simulation that align with regional beauty standards. North America follows, with a focus on integrating these technologies with social commerce.

The competitive environment is driving innovation in generative adversarial networks and image reconstruction algorithms, forcing developers to utilize cross-platform AR development and AR effects for social media to capture and retain user interest in a crowded marketplace.

Market Dynamics

Our researchers analyzed the data with 2025 as the base year, along with the key drivers, trends, and challenges. A holistic analysis of drivers will help companies refine their marketing strategies to gain a competitive advantage.

  • The evolution of the market is increasingly focused on technical sophistication, moving toward hyper-realism and specialized use cases. Core advancements in AI for realistic skin retouching and 3D facial mesh generation are establishing new quality benchmarks. These technologies enable more immersive applications, such as real-time video makeup application and seamless, real-time hair color changing.
  • Beyond personal use, these tools have significant commercial implications. AR filters for brand marketing are becoming a key component of digital campaigns, while AI photo enhancement for e-commerce helps create compelling product visuals. Enterprises that integrate augmented reality for jewelry try-on often report user engagement metrics that are twice as high as static image galleries.
  • The technical debate between on-device vs cloud AI processing is central to strategy, as developers balance performance with user privacy in facial data analysis. Innovations like generative AI avatar creation tools and AI to adjust facial symmetry are pushing the boundaries of personalization.
  • Further specialized functions, such as AI for automatic blemish removal, AI to enhance photo resolution, and the ability to create custom AR filters through a beauty tech SDK for developers, define the competitive frontier.
  • This rich feature set is vital for both standalone apps and AI in social media filters, which continue to drive mainstream adoption and user engagement through features like automated video highlight generation.

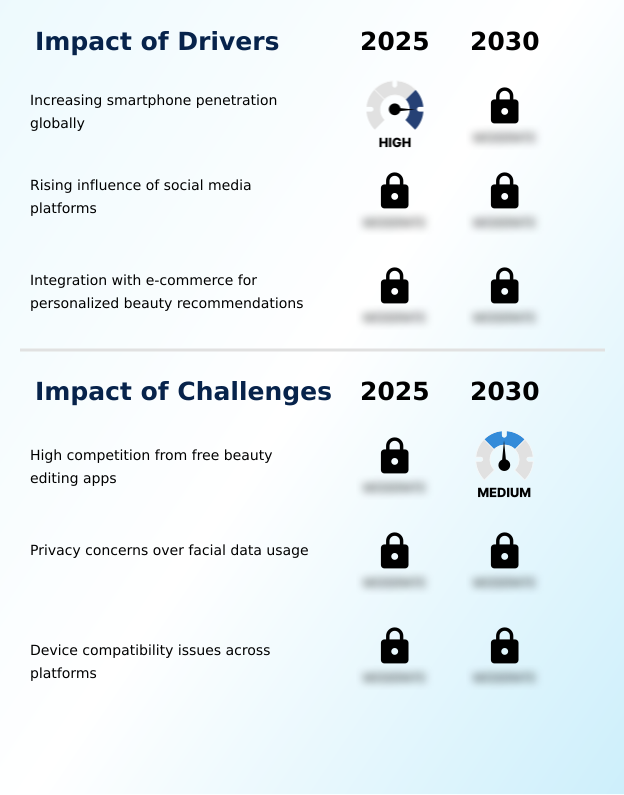
What are the key market drivers leading to the rise in the adoption of Beauty Camera Apps Industry?

  • The expansion of the market is significantly driven by the increasing global penetration of high-capability smartphones.

  • Market growth is fundamentally driven by the global proliferation of smartphones equipped with powerful hardware, including advanced cameras and dedicated neural processing units.
  • This hardware acceleration enables complex, on-device AI-driven video beautification and high-resolution rendering without significant latency, which is critical for real-time applications. The rising influence of social media platforms, which prioritize visually compelling content, further fuels demand.
  • Smartphone adoption in key emerging markets continues to drive a 25% year-over-year increase in related app downloads. Developers are harnessing these conditions by implementing sophisticated computer vision algorithms and style transfer technology.
  • The demand for AI-powered camera features and selfie enhancement technology is pushing innovation in mobile GPU acceleration for AI, creating a dynamic ecosystem for growth and user acquisition.

What are the market trends shaping the Beauty Camera Apps Industry?

  • The market is increasingly shaped by the emergence of AI-powered real-time beauty enhancement tools. This trend is redefining user expectations for digital self-expression and interaction.

  • Key market trends are centered on the integration of advanced AI and AR technologies to deliver hyper-realistic user experiences. The adoption of generative AI models enables 3D facial reconstruction and sophisticated virtual makeup application, creating effects that were previously achievable only with professional software.
  • This shift is driving demand for AR beauty filter development and virtual try-on for e-commerce, with AR-driven product visualizations proven to increase online sales conversion rates by over 60%. Innovations in real-time facial analysis and AI image processing allow for dynamic adjustments that maintain realism.
  • Leading applications are incorporating real-time video processing APIs and tools for generative AI for content creation, setting new standards for user engagement and creative expression.

What challenges does the Beauty Camera Apps Industry face during its growth?

  • Industry growth is constrained by high competition from a wide array of free beauty editing applications.

  • A primary market challenge is the intense competition from free alternatives, including features embedded within native smartphone cameras and major social media platforms. With over 80% of consumers expressing reluctance to pay for applications when comparable free options are available, monetizing through subscriptions or premium sales is difficult. This forces developers to innovate continuously to justify their value proposition.
  • Furthermore, rising consumer awareness and regulatory scrutiny around facial recognition privacy compliance create significant operational and legal hurdles. Effectively managing user data privacy in AI apps is now a critical business imperative.
  • The need to deliver unique features like superior skin texture preservation, flawless digital cosmetic overlays, and precise semantic image segmentation, while navigating a price-sensitive and privacy-conscious market, remains a core strategic challenge.

Exclusive Technavio Analysis on Customer Landscape

The beauty camera apps market forecasting report includes the adoption lifecycle of the market, covering from the innovator’s stage to the laggard’s stage. It focuses on adoption rates in different regions based on penetration. Furthermore, the beauty camera apps market report also includes key purchase criteria and drivers of price sensitivity to help companies evaluate and develop their market growth analysis strategies.

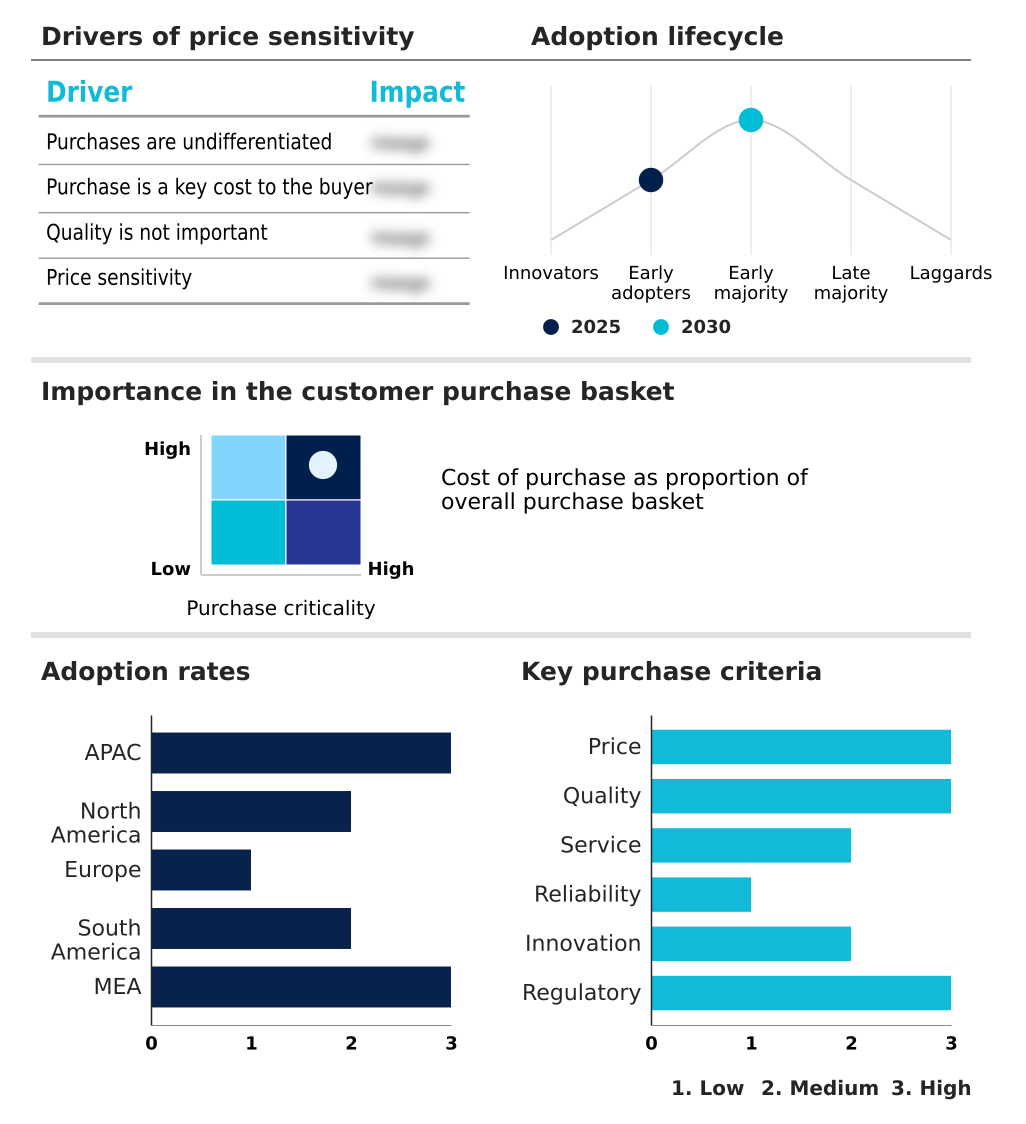
Customer Landscape of Beauty Camera Apps Industry

Competitive Landscape

Companies are implementing various strategies, such as strategic alliances, beauty camera apps market forecast, partnerships, mergers and acquisitions, geographical expansion, and product/service launches, to enhance their presence in the industry.

Adobe Inc. - Key offerings include integrated AI and AR solutions that provide professional-grade digital content creation tools and optimize customer experiences on mobile platforms.

The industry research and growth report includes detailed analyses of the competitive landscape of the market and information about key companies, including:

  • Adobe Inc.
  • Beijing Beta Technology
  • ByteDance Ltd.
  • Chengdu Pinguo Technology Co.
  • Claranova SE
  • CyberLink Corp.
  • FaceApp
  • InShot lnc.
  • Lightricks Ltd.
  • Meitu Inc.
  • Perfect Corp.
  • PicsArt Inc.
  • Pixocial Technology Pte. Ltd.
  • Prisma Labs Inc
  • Reface
  • Snap Inc.
  • SNOW Corp.
  • TOGL Technology Sdn Bhd

Qualitative and quantitative analysis of companies has been conducted to help clients understand the wider business environment as well as the strengths and weaknesses of key industry players. Data is qualitatively analyzed to categorize companies as pure play, category-focused, industry-focused, and diversified; it is quantitatively analyzed to categorize companies as dominant, leading, strong, tentative, and weak.

Recent Development and News in Beauty camera apps market

  • In August, 2025, Xiaomi introduced a decentralized artificial intelligence processing framework, enabling beauty camera applications to execute complex facial reconstruction algorithms locally on mid-range hardware without cloud connectivity.
  • In April, 2025, BeautyPlus released a significant facial reshaping update, introducing precision tools for adjusting face shape, eyes, and other facial features with natural-looking results through advanced AI.
  • In January, 2025, Samsung Electronics unveiled its new ProVisual Engine with the latest smartphone series, which uses artificial intelligence to enhance facial textures in real-time during video captures.
  • In January, 2025, YouCam Makeup introduced an Expression Switcheroo feature, which allows users to modify facial expressions in photos using powerful AI-driven editing tools.

Dive into Technavio’s robust research methodology, blending expert interviews, extensive data synthesis, and validated models for unparalleled Beauty Camera Apps Market insights. See full methodology.

Market Scope
Page number 282
Base year 2025
Historic period 2020-2024
Forecast period 2026-2030
Growth momentum & CAGR Accelerate at a CAGR of 17.2%
Market growth 2026-2030 USD 2122.6 million
Market structure Fragmented
YoY growth 2025-2026(%) 16.1%
Key countries China, India, Japan, South Korea, Australia, Indonesia, US, Canada, Mexico, Germany, UK, France, Italy, Spain, The Netherlands, Brazil, Argentina, Colombia, Saudi Arabia, UAE, South Africa, Israel and Egypt
Competitive landscape Leading Companies, Market Positioning of Companies, Competitive Strategies, and Industry Risks

Request Free Sample

Research Analyst Overview

  • The market is undergoing a strategic shift driven by the integration of sophisticated technologies. Boardroom decisions increasingly center on R&D investments in proprietary generative AI models and on-device AI processing to mitigate reliance on cloud services and address data privacy concerns.
  • This pivot is critical, as on-device implementation can reduce server-side operational costs by up to 40% for applications with high daily active users. The competitive landscape demands mastery of a wide array of tools, including AI-powered photo editing, augmented reality filters, and virtual makeup application.
  • Success requires advanced capabilities in real-time facial analysis, 3D facial reconstruction, and AI image processing while ensuring skin texture preservation. The use of generative adversarial networks, deep learning models, and computer vision algorithms is now standard. Key functionalities such as AI-driven video beautification, semantic image segmentation, and style transfer technology are differentiators.
  • Developers are leveraging neural processing units for high-resolution rendering and dynamic lighting adaptation to create more realistic interactive AR features and virtual hairstyle simulation with a real-time beautification engine.

What are the Key Data Covered in this Beauty Camera Apps Market Research and Growth Report?

  • What is the expected growth of the Beauty Camera Apps Market between 2026 and 2030?

    • USD 2.12 billion, at a CAGR of 17.2%

  • What segmentation does the market report cover?

    • The report is segmented by Product Type (Android, iOS, and Others), Solution (Free with in-app purchases, Freemium, and Paid subscription), Type (Standalone apps, Integrated into social media platforms, and Camera accessories) and Geography (APAC, North America, Europe, South America, Middle East and Africa)

  • Which regions are analyzed in the report?

    • APAC, North America, Europe, South America and Middle East and Africa

  • What are the key growth drivers and market challenges?

    • Increasing smartphone penetration globally, High competition from free beauty editing apps

  • Who are the major players in the Beauty Camera Apps Market?

    • Adobe Inc., Beijing Beta Technology, ByteDance Ltd., Chengdu Pinguo Technology Co., Claranova SE, CyberLink Corp., FaceApp, InShot lnc., Lightricks Ltd., Meitu Inc., Perfect Corp., PicsArt Inc., Pixocial Technology Pte. Ltd., Prisma Labs Inc, Reface, Snap Inc., SNOW Corp. and TOGL Technology Sdn Bhd

Market Research Insights

  • The market's competitive dynamics are shaped by the strategic implementation of advanced technologies to improve business outcomes. Analysis of AI-driven user engagement metrics reveals that a well-executed AR beauty filter development strategy can increase average user session times by over 50%.
  • Furthermore, integrating a virtual try-on for e-commerce solution has proven to reduce product returns by more than 30% for participating cosmetic brands. Developers are leveraging mobile camera enhancement software and real-time video processing APIs to deliver superior user experiences. Success depends on effective AI for personalized advertising, adherence to facial recognition privacy compliance, and utilizing generative AI for content creation.
  • As the sector matures, differentiation is achieved through advanced portrait retouching, cross-platform AR development, and optimizing AI model optimization for mobile to ensure seamless performance.

We can help! Our analysts can customize this beauty camera apps market research report to meet your requirements.

Get in touch

1. Executive Summary

1.1 Market overview

Executive Summary - Chart on Market Overview
Executive Summary - Data Table on Market Overview
Executive Summary - Chart on Global Market Characteristics
Executive Summary - Chart on Market by Geography
Executive Summary - Chart on Market Segmentation by Product Type
Executive Summary - Chart on Market Segmentation by Solution
Executive Summary - Chart on Market Segmentation by Type
Executive Summary - Chart on Incremental Growth
Executive Summary - Data Table on Incremental Growth
Executive Summary - Chart on Company Market Positioning

2. Technavio Analysis

2.1 Analysis of price sensitivity, lifecycle, customer purchase basket, adoption rates, and purchase criteria

2.2 Criticality of inputs and Factors of differentiation

Chart on Overview on criticality of inputs and factors of differentiation

2.3 Factors of disruption

Chart on Overview on factors of disruption

2.4 Impact of drivers and challenges

Chart on Impact of drivers and challenges in 2025 and 2030

3. Market Landscape

3.1 Market ecosystem

Chart on Parent Market
Data Table on - Parent Market

3.2 Market characteristics

Chart on Market characteristics analysis

3.3 Value chain analysis

Chart on Value chain analysis

4. Market Sizing

4.1 Market definition

Data Table on Offerings of companies included in the market definition

4.2 Market segment analysis

Market segments

4.3 Market size 2025

4.4 Market outlook: Forecast for 2025-2030

Chart on Global - Market size and forecast 2025-2030 ($ million)
Data Table on Global - Market size and forecast 2025-2030 ($ million)
Chart on Global Market: Year-over-year growth 2025-2030 (%)
Data Table on Global Market: Year-over-year growth 2025-2030 (%)

5. Historic Market Size

5.1 Global Beauty Camera Apps Market 2020 - 2024

Historic Market Size - Data Table on Global Beauty Camera Apps Market 2020 - 2024 ($ million)

5.2 Product Type segment analysis 2020 - 2024

Historic Market Size - Product Type Segment 2020 - 2024 ($ million)

5.3 Solution segment analysis 2020 - 2024

Historic Market Size - Solution Segment 2020 - 2024 ($ million)

5.4 Type segment analysis 2020 - 2024

Historic Market Size - Type Segment 2020 - 2024 ($ million)

5.5 Geography segment analysis 2020 - 2024

Historic Market Size - Geography Segment 2020 - 2024 ($ million)

5.6 Country segment analysis 2020 - 2024

Historic Market Size - Country Segment 2020 - 2024 ($ million)

6. Qualitative Analysis

6.1 The Impact of AI on Global Beauty Camera Apps Market

7. Five Forces Analysis

7.1 Five forces summary

Five forces analysis - Comparison between 2025 and 2030

7.2 Bargaining power of buyers

Bargaining power of buyers - Impact of key factors 2025 and 2030

7.3 Bargaining power of suppliers

Bargaining power of suppliers - Impact of key factors in 2025 and 2030

7.4 Threat of new entrants

Threat of new entrants - Impact of key factors in 2025 and 2030

7.5 Threat of substitutes

Threat of substitutes - Impact of key factors in 2025 and 2030

7.6 Threat of rivalry

Threat of rivalry - Impact of key factors in 2025 and 2030

7.7 Market condition

Chart on Market condition - Five forces 2025 and 2030

8. Market Segmentation by Product Type

8.1 Market segments

Chart on Product Type - Market share 2025-2030 (%)
Data Table on Product Type - Market share 2025-2030 (%)

8.2 Comparison by Product Type

Chart on Comparison by Product Type
Data Table on Comparison by Product Type

8.3 Android - Market size and forecast 2025-2030

Chart on Android - Market size and forecast 2025-2030 ($ million)
Data Table on Android - Market size and forecast 2025-2030 ($ million)
Chart on Android - Year-over-year growth 2025-2030 (%)
Data Table on Android - Year-over-year growth 2025-2030 (%)

8.4 iOS - Market size and forecast 2025-2030

Chart on iOS - Market size and forecast 2025-2030 ($ million)
Data Table on iOS - Market size and forecast 2025-2030 ($ million)
Chart on iOS - Year-over-year growth 2025-2030 (%)
Data Table on iOS - Year-over-year growth 2025-2030 (%)

8.5 Others - Market size and forecast 2025-2030

Chart on Others - Market size and forecast 2025-2030 ($ million)
Data Table on Others - Market size and forecast 2025-2030 ($ million)
Chart on Others - Year-over-year growth 2025-2030 (%)
Data Table on Others - Year-over-year growth 2025-2030 (%)

8.6 Market opportunity by Product Type

Market opportunity by Product Type ($ million)
Data Table on Market opportunity by Product Type ($ million)

9. Market Segmentation by Solution

9.1 Market segments

Chart on Solution - Market share 2025-2030 (%)
Data Table on Solution - Market share 2025-2030 (%)

9.2 Comparison by Solution

Chart on Comparison by Solution
Data Table on Comparison by Solution

9.3 Free with in-app purchases - Market size and forecast 2025-2030

Chart on Free with in-app purchases - Market size and forecast 2025-2030 ($ million)
Data Table on Free with in-app purchases - Market size and forecast 2025-2030 ($ million)
Chart on Free with in-app purchases - Year-over-year growth 2025-2030 (%)
Data Table on Free with in-app purchases - Year-over-year growth 2025-2030 (%)

9.4 Freemium - Market size and forecast 2025-2030

Chart on Freemium - Market size and forecast 2025-2030 ($ million)
Data Table on Freemium - Market size and forecast 2025-2030 ($ million)
Chart on Freemium - Year-over-year growth 2025-2030 (%)
Data Table on Freemium - Year-over-year growth 2025-2030 (%)

9.5 Paid subscription - Market size and forecast 2025-2030

Chart on Paid subscription - Market size and forecast 2025-2030 ($ million)
Data Table on Paid subscription - Market size and forecast 2025-2030 ($ million)
Chart on Paid subscription - Year-over-year growth 2025-2030 (%)
Data Table on Paid subscription - Year-over-year growth 2025-2030 (%)

9.6 Market opportunity by Solution

Market opportunity by Solution ($ million)
Data Table on Market opportunity by Solution ($ million)

10. Market Segmentation by Type

10.1 Market segments

Chart on Type - Market share 2025-2030 (%)
Data Table on Type - Market share 2025-2030 (%)

10.2 Comparison by Type

Chart on Comparison by Type
Data Table on Comparison by Type

10.3 Standalone apps - Market size and forecast 2025-2030

Chart on Standalone apps - Market size and forecast 2025-2030 ($ million)
Data Table on Standalone apps - Market size and forecast 2025-2030 ($ million)
Chart on Standalone apps - Year-over-year growth 2025-2030 (%)
Data Table on Standalone apps - Year-over-year growth 2025-2030 (%)

10.4 Integrated into social media platforms - Market size and forecast 2025-2030

Chart on Integrated into social media platforms - Market size and forecast 2025-2030 ($ million)
Data Table on Integrated into social media platforms - Market size and forecast 2025-2030 ($ million)
Chart on Integrated into social media platforms - Year-over-year growth 2025-2030 (%)
Data Table on Integrated into social media platforms - Year-over-year growth 2025-2030 (%)

10.5 Camera accessories - Market size and forecast 2025-2030

Chart on Camera accessories - Market size and forecast 2025-2030 ($ million)
Data Table on Camera accessories - Market size and forecast 2025-2030 ($ million)
Chart on Camera accessories - Year-over-year growth 2025-2030 (%)
Data Table on Camera accessories - Year-over-year growth 2025-2030 (%)

10.6 Market opportunity by Type

Market opportunity by Type ($ million)
Data Table on Market opportunity by Type ($ million)

11. Customer Landscape

11.1 Customer landscape overview

Analysis of price sensitivity, lifecycle, customer purchase basket, adoption rates, and purchase criteria

12. Geographic Landscape

12.1 Geographic segmentation

Chart on Market share by geography 2025-2030 (%)
Data Table on Market share by geography 2025-2030 (%)

12.2 Geographic comparison

Chart on Geographic comparison
Data Table on Geographic comparison

12.3 APAC - Market size and forecast 2025-2030

Chart on APAC - Market size and forecast 2025-2030 ($ million)
Data Table on APAC - Market size and forecast 2025-2030 ($ million)
Chart on APAC - Year-over-year growth 2025-2030 (%)
Data Table on APAC - Year-over-year growth 2025-2030 (%)
Chart on Regional Comparison - APAC
Data Table on Regional Comparison - APAC

12.3.1 China - Market size and forecast 2025-2030

Chart on China - Market size and forecast 2025-2030 ($ million)
Data Table on China - Market size and forecast 2025-2030 ($ million)
Chart on China - Year-over-year growth 2025-2030 (%)
Data Table on China - Year-over-year growth 2025-2030 (%)

12.3.2 India - Market size and forecast 2025-2030

Chart on India - Market size and forecast 2025-2030 ($ million)
Data Table on India - Market size and forecast 2025-2030 ($ million)
Chart on India - Year-over-year growth 2025-2030 (%)
Data Table on India - Year-over-year growth 2025-2030 (%)

12.3.3 Japan - Market size and forecast 2025-2030

Chart on Japan - Market size and forecast 2025-2030 ($ million)
Data Table on Japan - Market size and forecast 2025-2030 ($ million)
Chart on Japan - Year-over-year growth 2025-2030 (%)
Data Table on Japan - Year-over-year growth 2025-2030 (%)

12.3.4 South Korea - Market size and forecast 2025-2030

Chart on South Korea - Market size and forecast 2025-2030 ($ million)
Data Table on South Korea - Market size and forecast 2025-2030 ($ million)
Chart on South Korea - Year-over-year growth 2025-2030 (%)
Data Table on South Korea - Year-over-year growth 2025-2030 (%)

12.3.5 Australia - Market size and forecast 2025-2030

Chart on Australia - Market size and forecast 2025-2030 ($ million)
Data Table on Australia - Market size and forecast 2025-2030 ($ million)
Chart on Australia - Year-over-year growth 2025-2030 (%)
Data Table on Australia - Year-over-year growth 2025-2030 (%)

12.3.6 Indonesia - Market size and forecast 2025-2030

Chart on Indonesia - Market size and forecast 2025-2030 ($ million)
Data Table on Indonesia - Market size and forecast 2025-2030 ($ million)
Chart on Indonesia - Year-over-year growth 2025-2030 (%)
Data Table on Indonesia - Year-over-year growth 2025-2030 (%)

12.4 North America - Market size and forecast 2025-2030

Chart on North America - Market size and forecast 2025-2030 ($ million)
Data Table on North America - Market size and forecast 2025-2030 ($ million)
Chart on North America - Year-over-year growth 2025-2030 (%)
Data Table on North America - Year-over-year growth 2025-2030 (%)
Chart on Regional Comparison - North America
Data Table on Regional Comparison - North America

12.4.1 US - Market size and forecast 2025-2030

Chart on US - Market size and forecast 2025-2030 ($ million)
Data Table on US - Market size and forecast 2025-2030 ($ million)
Chart on US - Year-over-year growth 2025-2030 (%)
Data Table on US - Year-over-year growth 2025-2030 (%)

12.4.2 Canada - Market size and forecast 2025-2030

Chart on Canada - Market size and forecast 2025-2030 ($ million)
Data Table on Canada - Market size and forecast 2025-2030 ($ million)
Chart on Canada - Year-over-year growth 2025-2030 (%)
Data Table on Canada - Year-over-year growth 2025-2030 (%)

12.4.3 Mexico - Market size and forecast 2025-2030

Chart on Mexico - Market size and forecast 2025-2030 ($ million)
Data Table on Mexico - Market size and forecast 2025-2030 ($ million)
Chart on Mexico - Year-over-year growth 2025-2030 (%)
Data Table on Mexico - Year-over-year growth 2025-2030 (%)

12.5 Europe - Market size and forecast 2025-2030

Chart on Europe - Market size and forecast 2025-2030 ($ million)
Data Table on Europe - Market size and forecast 2025-2030 ($ million)
Chart on Europe - Year-over-year growth 2025-2030 (%)
Data Table on Europe - Year-over-year growth 2025-2030 (%)
Chart on Regional Comparison - Europe
Data Table on Regional Comparison - Europe

12.5.1 Germany - Market size and forecast 2025-2030

Chart on Germany - Market size and forecast 2025-2030 ($ million)
Data Table on Germany - Market size and forecast 2025-2030 ($ million)
Chart on Germany - Year-over-year growth 2025-2030 (%)
Data Table on Germany - Year-over-year growth 2025-2030 (%)

12.5.2 UK - Market size and forecast 2025-2030

Chart on UK - Market size and forecast 2025-2030 ($ million)
Data Table on UK - Market size and forecast 2025-2030 ($ million)
Chart on UK - Year-over-year growth 2025-2030 (%)
Data Table on UK - Year-over-year growth 2025-2030 (%)

12.5.3 France - Market size and forecast 2025-2030

Chart on France - Market size and forecast 2025-2030 ($ million)
Data Table on France - Market size and forecast 2025-2030 ($ million)
Chart on France - Year-over-year growth 2025-2030 (%)
Data Table on France - Year-over-year growth 2025-2030 (%)

12.5.4 Italy - Market size and forecast 2025-2030

Chart on Italy - Market size and forecast 2025-2030 ($ million)
Data Table on Italy - Market size and forecast 2025-2030 ($ million)
Chart on Italy - Year-over-year growth 2025-2030 (%)
Data Table on Italy - Year-over-year growth 2025-2030 (%)

12.5.5 Spain - Market size and forecast 2025-2030

Chart on Spain - Market size and forecast 2025-2030 ($ million)
Data Table on Spain - Market size and forecast 2025-2030 ($ million)
Chart on Spain - Year-over-year growth 2025-2030 (%)
Data Table on Spain - Year-over-year growth 2025-2030 (%)

12.5.6 The Netherlands - Market size and forecast 2025-2030

Chart on The Netherlands - Market size and forecast 2025-2030 ($ million)
Data Table on The Netherlands - Market size and forecast 2025-2030 ($ million)
Chart on The Netherlands - Year-over-year growth 2025-2030 (%)
Data Table on The Netherlands - Year-over-year growth 2025-2030 (%)

12.6 South America - Market size and forecast 2025-2030

Chart on South America - Market size and forecast 2025-2030 ($ million)
Data Table on South America - Market size and forecast 2025-2030 ($ million)
Chart on South America - Year-over-year growth 2025-2030 (%)
Data Table on South America - Year-over-year growth 2025-2030 (%)
Chart on Regional Comparison - South America
Data Table on Regional Comparison - South America

12.6.1 Brazil - Market size and forecast 2025-2030

Chart on Brazil - Market size and forecast 2025-2030 ($ million)
Data Table on Brazil - Market size and forecast 2025-2030 ($ million)
Chart on Brazil - Year-over-year growth 2025-2030 (%)
Data Table on Brazil - Year-over-year growth 2025-2030 (%)

12.6.2 Argentina - Market size and forecast 2025-2030

Chart on Argentina - Market size and forecast 2025-2030 ($ million)
Data Table on Argentina - Market size and forecast 2025-2030 ($ million)
Chart on Argentina - Year-over-year growth 2025-2030 (%)
Data Table on Argentina - Year-over-year growth 2025-2030 (%)

12.6.3 Colombia - Market size and forecast 2025-2030

Chart on Colombia - Market size and forecast 2025-2030 ($ million)
Data Table on Colombia - Market size and forecast 2025-2030 ($ million)
Chart on Colombia - Year-over-year growth 2025-2030 (%)
Data Table on Colombia - Year-over-year growth 2025-2030 (%)

12.7 Middle East and Africa - Market size and forecast 2025-2030

Chart on Middle East and Africa - Market size and forecast 2025-2030 ($ million)
Data Table on Middle East and Africa - Market size and forecast 2025-2030 ($ million)
Chart on Middle East and Africa - Year-over-year growth 2025-2030 (%)
Data Table on Middle East and Africa - Year-over-year growth 2025-2030 (%)
Chart on Regional Comparison - Middle East and Africa
Data Table on Regional Comparison - Middle East and Africa

12.7.1 Saudi Arabia - Market size and forecast 2025-2030

Chart on Saudi Arabia - Market size and forecast 2025-2030 ($ million)
Data Table on Saudi Arabia - Market size and forecast 2025-2030 ($ million)
Chart on Saudi Arabia - Year-over-year growth 2025-2030 (%)
Data Table on Saudi Arabia - Year-over-year growth 2025-2030 (%)

12.7.2 UAE - Market size and forecast 2025-2030

Chart on UAE - Market size and forecast 2025-2030 ($ million)
Data Table on UAE - Market size and forecast 2025-2030 ($ million)
Chart on UAE - Year-over-year growth 2025-2030 (%)
Data Table on UAE - Year-over-year growth 2025-2030 (%)

12.7.3 South Africa - Market size and forecast 2025-2030

Chart on South Africa - Market size and forecast 2025-2030 ($ million)
Data Table on South Africa - Market size and forecast 2025-2030 ($ million)
Chart on South Africa - Year-over-year growth 2025-2030 (%)
Data Table on South Africa - Year-over-year growth 2025-2030 (%)

12.7.4 Israel - Market size and forecast 2025-2030

Chart on Israel - Market size and forecast 2025-2030 ($ million)
Data Table on Israel - Market size and forecast 2025-2030 ($ million)
Chart on Israel - Year-over-year growth 2025-2030 (%)
Data Table on Israel - Year-over-year growth 2025-2030 (%)

12.7.5 Egypt - Market size and forecast 2025-2030

Chart on Egypt - Market size and forecast 2025-2030 ($ million)
Data Table on Egypt - Market size and forecast 2025-2030 ($ million)
Chart on Egypt - Year-over-year growth 2025-2030 (%)
Data Table on Egypt - Year-over-year growth 2025-2030 (%)

12.8 Market opportunity by geography

Market opportunity by geography ($ million)
Data Tables on Market opportunity by geography ($ million)

13. Drivers, Challenges, and Opportunity

13.1 Market drivers

Increasing smartphone penetration globally
Rising influence of social media platforms
Integration with e-commerce for personalized beauty recommendations

13.2 Market challenges

High competition from free beauty editing apps
Privacy concerns over facial data usage
Device compatibility issues across platforms

13.3 Impact of drivers and challenges

Impact of drivers and challenges in 2025 and 2030

13.4 Market opportunities

AI-powered real-time beauty enhancement tools
AR-based virtual makeup and hairstyle previews
Subscription-based premium filter models emerging

14. Competitive Landscape

14.1 Overview

14.2

Overview on criticality of inputs and factors of differentiation

14.3 Landscape disruption

Overview on factors of disruption

14.4 Industry risks

Impact of key risks on business

15. Competitive Analysis

15.1 Companies profiled

Companies covered

15.2 Company ranking index

15.3 Market positioning of companies

Matrix on companies position and classification

15.4 Adobe Inc.

Adobe Inc. - Overview
Adobe Inc. - Business segments
Adobe Inc. - Key news
Adobe Inc. - Key offerings
Adobe Inc. - Segment focus
SWOT

15.5 Beijing Beta Technology

Beijing Beta Technology - Overview
Beijing Beta Technology - Product / Service
Beijing Beta Technology - Key offerings
SWOT

15.6 ByteDance Ltd.

ByteDance Ltd. - Overview
ByteDance Ltd. - Product / Service
ByteDance Ltd. - Key offerings
SWOT

15.7 Chengdu Pinguo Technology Co.

Chengdu Pinguo Technology Co. - Overview
Chengdu Pinguo Technology Co. - Product / Service
Chengdu Pinguo Technology Co. - Key offerings
SWOT

15.8 Claranova SE

Claranova SE - Overview
Claranova SE - Business segments
Claranova SE - Key offerings
Claranova SE - Segment focus
SWOT

15.9 CyberLink Corp.

CyberLink Corp. - Overview
CyberLink Corp. - Product / Service
CyberLink Corp. - Key offerings
SWOT

15.10 FaceApp

FaceApp - Overview
FaceApp - Product / Service
FaceApp - Key offerings
SWOT

15.11 InShot lnc.

InShot lnc. - Overview
InShot lnc. - Product / Service
InShot lnc. - Key offerings
SWOT

15.12 Lightricks Ltd.

Lightricks Ltd. - Overview
Lightricks Ltd. - Product / Service
Lightricks Ltd. - Key offerings
SWOT

15.13 Meitu Inc.

Meitu Inc. - Overview
Meitu Inc. - Product / Service
Meitu Inc. - Key offerings
SWOT

15.14 Perfect Corp.

Perfect Corp. - Overview
Perfect Corp. - Product / Service
Perfect Corp. - Key offerings
SWOT

15.15 PicsArt Inc.

PicsArt Inc. - Overview
PicsArt Inc. - Product / Service
PicsArt Inc. - Key offerings
SWOT

15.16 Pixocial Technology Pte. Ltd.

Pixocial Technology Pte. Ltd. - Overview
Pixocial Technology Pte. Ltd. - Product / Service
Pixocial Technology Pte. Ltd. - Key offerings
SWOT

15.17 Snap Inc.

Snap Inc. - Overview
Snap Inc. - Product / Service
Snap Inc. - Key offerings
SWOT

15.18 SNOW Corp.

SNOW Corp. - Overview
SNOW Corp. - Product / Service
SNOW Corp. - Key offerings
SWOT

16. Appendix

16.1 Scope of the report

Market definition
Objectives
Notes and caveats

16.2 Inclusions and exclusions checklist

Inclusions checklist
Exclusions checklist

16.3 Currency conversion rates for US$

16.4 Research methodology

16.5 Data procurement

Information sources

16.6 Data validation

16.7 Validation techniques employed for market sizing

16.8 Data synthesis

16.9 360 degree market analysis

16.10 List of abbreviations

Research Methodology

Technavio presents a detailed picture of the market by way of study, synthesis, and summation of data from multiple sources. The analysts have presented the various facets of the market with a particular focus on identifying the key industry influencers. The data thus presented is comprehensive, reliable, and the result of extensive research, both primary and secondary.

INFORMATION SOURCES

Primary sources

  • Manufacturers and suppliers
  • Channel partners
  • Industry experts
  • Strategic decision makers

Secondary sources

  • Industry journals and periodicals
  • Government data
  • Financial reports of key industry players
  • Historical data
  • Press releases

DATA ANALYSIS

Data Synthesis

  • Collation of data
  • Estimation of key figures
  • Analysis of derived insights

Data Validation

  • Triangulation with data models
  • Reference against proprietary databases
  • Corroboration with industry experts

REPORT WRITING

Qualitative

  • Market drivers
  • Market challenges
  • Market trends
  • Five forces analysis

Quantitative

  • Market size and forecast
  • Market segmentation
  • Geographical insights
  • Competitive landscape

Interested in this report?

Get your sample now to see our research methodology and insights!

Download Now

Frequently Asked Questions

Beauty Camera Apps market growth will increase by USD 2122.6 million during 2026-2030.

The Beauty Camera Apps market is expected to grow at a CAGR of 17.2% during 2026-2030.

Beauty Camera Apps market is segmented by Product type (Android, iOS, Others) Solution (Free with in-app purchases, Freemium, Paid subscription) Type (Standalone apps, Integrated into social media platforms, Camera accessories)

Adobe Inc., Beijing Beta Technology, ByteDance Ltd., Chengdu Pinguo Technology Co., Claranova SE, CyberLink Corp., FaceApp, InShot lnc., Lightricks Ltd., Meitu Inc., Perfect Corp., PicsArt Inc., Pixocial Technology Pte. Ltd., Prisma Labs Inc, Reface, Snap Inc., SNOW Corp., TOGL Technology Sdn Bhd are a few of the key vendors in the Beauty Camera Apps market.

APAC will register the highest growth rate of 49% among the other regions. Therefore, the Beauty Camera Apps market in APAC is expected to garner significant business opportunities for the vendors during the forecast period.

China, India, Japan, South Korea, Australia, Indonesia, US, Canada, Mexico, Germany, UK, France, Italy, Spain, The Netherlands, Brazil, Argentina, Colombia, Saudi Arabia, UAE, South Africa, Israel, Egypt

  • Increasing smartphone penetration globally is the driving factor this market.

The Beauty Camera Apps market vendors should focus on grabbing business opportunities from the Product type segment as it accounted for the largest market share in the base year.