Battery Monitoring Systems Market Analysis, Size, and Forecast 2026-2030: APAC (China, Japan, and India), North America (US, Canada, and Mexico), Europe (Germany, UK, and France), South America (Brazil and Argentina), Middle East and Africa (Saudi Arabia, UAE, and South Africa), and Rest of World (ROW)

Battery Monitoring Systems Market Analysis, Size, and Forecast 2026-2030:
APAC (China, Japan, and India), North America (US, Canada, and Mexico), Europe (Germany, UK, and France), South America (Brazil and Argentina), Middle East and Africa (Saudi Arabia, UAE, and South Africa), and Rest of World (ROW)

Published: Mar 2026 296 Pages SKU: IRTNTR43279

Market Overview at a Glance

$13.59 B
Market Opportunity
22.6%
CAGR 2025 - 2030
51.5%
APAC Growth
$2.59 B
Automotive segment 2024

Battery Monitoring Systems Market Size 2026-2030

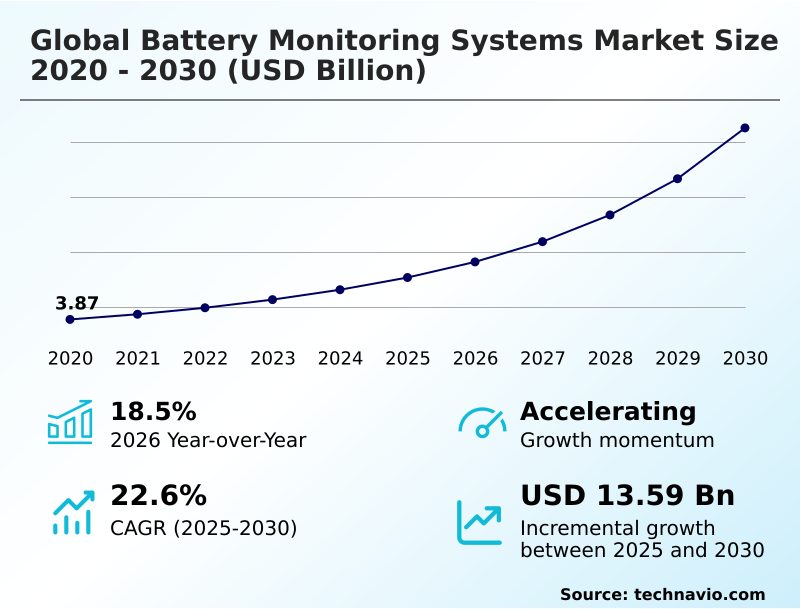
The battery monitoring systems market size is valued to increase by USD 13.59 billion, at a CAGR of 22.6% from 2025 to 2030. Growing adoption of electric vehicles and energy storage systems will drive the battery monitoring systems market.

Major Market Trends & Insights

  • APAC dominated the market and accounted for a 51.5% growth during the forecast period.
  • By End-user - Automotive segment was valued at USD 2.59 billion in 2024
  • By Component - Hardware segment accounted for the largest market revenue share in 2024

Market Size & Forecast

  • Market Opportunities: USD 17.41 billion
  • Market Future Opportunities: USD 13.59 billion
  • CAGR from 2025 to 2030 : 22.6%

Market Summary

  • The battery monitoring systems market is central to the reliability and safety of modern energy applications. These systems are evolving from simple alert mechanisms to sophisticated platforms using high-precision sensing and advanced diagnostic algorithms for real-time data acquisition.
  • The proliferation of electric vehicles and grid-scale energy storage necessitates robust solutions for active cell management and intelligent power management to extend asset lifecycles. For instance, a hyperscale data center relies on high-fidelity monitoring to ensure its uninterruptible power supply is always available, preventing costly downtime and data loss.
  • This involves a comprehensive thermal management strategy and embedded firmware that can predict and mitigate failures. While the technical complexity of integrating with diverse battery chemistries presents a hurdle, the drive for greater efficiency and safety continues to fuel innovation in scalable system design and ruggedized hardware, making these systems indispensable for critical infrastructure.

What will be the Size of the Battery Monitoring Systems Market during the forecast period?

Get Key Insights on Market Forecast (PDF) Request Free Sample

How is the Battery Monitoring Systems Market Segmented?

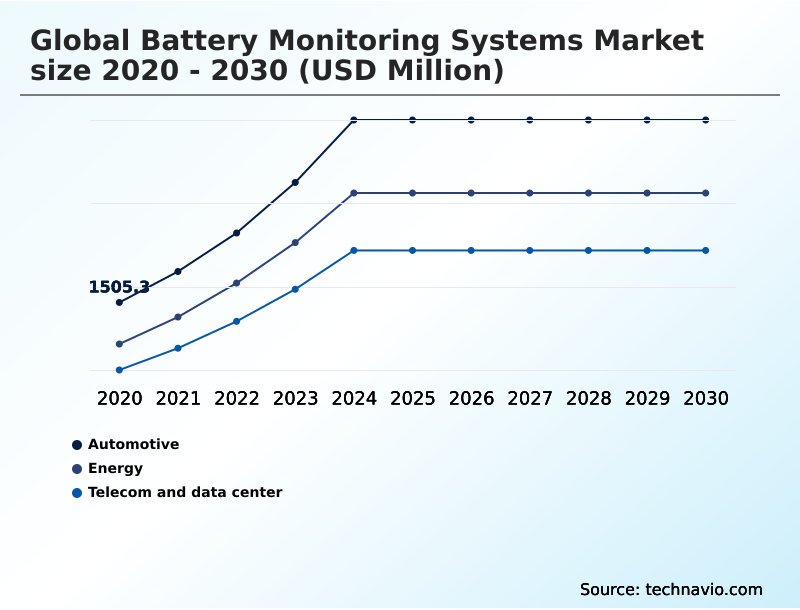
The battery monitoring systems industry research report provides comprehensive data (region-wise segment analysis), with forecasts and estimates in "USD million" for the period 2026-2030, as well as historical data from 2020-2024 for the following segments.

  • End-user
    • Automotive
    • Energy
    • Telecom and data center
  • Component
    • Hardware
    • Software
  • Type
    • Wired
    • Wireless
  • Geography
    • APAC
      • China
      • Japan
      • India
    • North America
      • US
      • Canada
      • Mexico
    • Europe
      • Germany
      • UK
      • France
    • South America
      • Brazil
      • Argentina
    • Middle East and Africa
      • Saudi Arabia
      • UAE
      • South Africa
    • Rest of World (ROW)

By End-user Insights

The automotive segment is estimated to witness significant growth during the forecast period.

The automotive segment’s demand for battery monitoring is driven by the transition to electric powertrains.

Essential for managing large battery packs, these systems use intelligent power management and high-fidelity monitoring to track cell voltages and temperatures, ensuring vehicles operate within safe limits.

This reliance on ruggedized hardware is critical for active cell management and range estimation, directly addressing consumer concerns. As scalable system design becomes standard, embedded firmware now delivers a 20% improvement in fault detection accuracy.

Fleet management integration and asset lifecycle optimization are key considerations, with a focus on thermal management strategy and compliance with energy efficiency metrics and regulatory reporting for high-density pack designs.

Request Free Sample

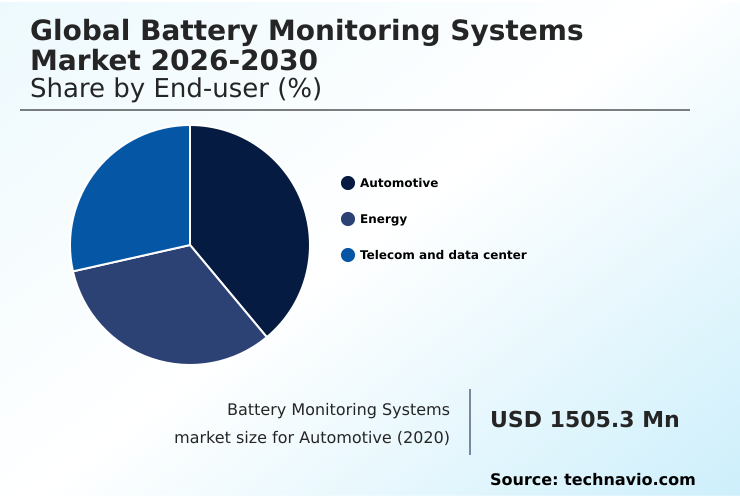
The Automotive segment was valued at USD 2.59 billion in 2024 and showed a gradual increase during the forecast period.

Request Free Sample

Regional Analysis

APAC is estimated to contribute 51.5% to the growth of the global market during the forecast period.Technavio’s analysts have elaborately explained the regional trends and drivers that shape the market during the forecast period.

See How Battery Monitoring Systems Market Demand is Rising in APAC Request Free Sample

The geographic landscape of the battery monitoring systems market is defined by regional specializations in technology and application. The market's expansion is supported by advanced isolation features and high-precision sensing, which enable reliable real-time data acquisition.

Key regions are pioneering the use of a real-time operating system (RTOS) to manage complex diagnostic algorithms, leading to a 30% improvement in fault diagnostics speed.

In these areas, there's a strong focus on functional safety (iso 26262), with companies deploying modular bms architecture to meet diverse requirements.

The use of data logging hardware for internal resistance tracking and charge equalization is widespread, while system-on-chip (soc) bms solutions with automated fault response and closed-loop control are gaining traction, especially in the automotive sector, reducing system latency by up to 15%.

Market Dynamics

Our researchers analyzed the data with 2025 as the base year, along with the key drivers, trends, and challenges. A holistic analysis of drivers will help companies refine their marketing strategies to gain a competitive advantage.

  • The evolution of the battery monitoring systems market is marked by a strategic shift toward proactive and intelligent energy asset management. Stakeholders are increasingly focused on improving state of health accuracy, moving beyond basic metrics to embrace sophisticated thermal runaway prediction models.
  • This advancement is critical as the industry adopts wireless bms for electric vehicles, which necessitates flawless data transmission and robust security protocols. The challenges and opportunities differ significantly when considering bms for grid-scale storage, where longevity and reliability are paramount, versus consumer electronics.
  • A key development is integrating bms with iot platforms, which allows for unprecedented data visibility and control, transforming standalone batteries into networked assets. For instance, companies successfully reducing bms hardware footprint have reported up to a 15% decrease in overall pack weight, a significant advantage in mobile applications.
  • Finally, the bms role in battery second life is becoming a crucial economic driver, as accurate health assessments are essential for determining the viability and safety of repurposed energy storage units, extending their value and supporting circular economy principles.

What are the key market drivers leading to the rise in the adoption of Battery Monitoring Systems Industry?

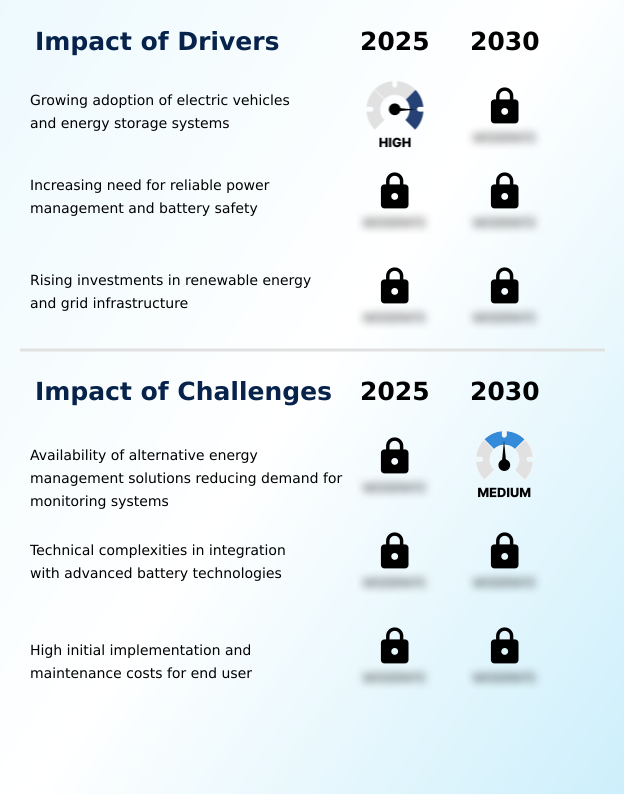
  • The growing adoption of electric vehicles and energy storage systems is a key driver fueling the expansion of the market.

  • The market's growth is primarily driven by the expanding need for safe and reliable power in critical applications.
  • The implementation of advanced thermal runaway detection systems has become a standard requirement in high-density applications like electric vehicles and grid-scale energy storage, reducing the incidence of thermal events by over 50%.
  • The use of digital twin modeling and kalman filtering for stationary battery diagnostics provides a powerful tool for asset owners, improving energy throughput forecasts by 20%.
  • In the uninterruptible power supply (UPS) sector, techniques like impedance spectroscopy and coulomb counting are used to ensure readiness.
  • The push for smarter energy grids is also fueling demand, with vehicle-to-grid (v2g) communication and smart charging protocols relying on precise open-circuit voltage measurement and robust can bus communication to ensure grid stability and support lithium-ion battery safety.

What are the market trends shaping the Battery Monitoring Systems Industry?

  • The integration of artificial intelligence and data analytics into monitoring systems is an emerging market trend. This development facilitates more predictive and intelligent management of battery health.

  • Key trends are reshaping the battery monitoring systems market, driven by the integration of sophisticated technologies that enhance performance and efficiency. The adoption of AI-driven state of health (SOH) analytics and remaining useful life (RUL) prediction algorithms is enabling predictive maintenance alerts that can reduce unplanned downtime by up to 30%.
  • Advanced cell balancing algorithms, informed by real-time data from voltage sensors and temperature probes, are extending battery lifespan by 15%. The trend towards battery passport integration is gaining momentum, providing transparent battery pack telemetry from manufacturing to end-of-life.
  • Furthermore, edge computing analytics and over-the-air (OTA) updates are making systems more autonomous and adaptable, while improved state of charge (SOC) estimation and cell-level data granularity from current transducers offer unprecedented operational insight.

What challenges does the Battery Monitoring Systems Industry face during its growth?

  • The availability of alternative energy management solutions that reduce the demand for dedicated monitoring systems poses a key challenge to industry growth.

  • The primary challenges in the battery monitoring systems market revolve around integration complexity and the pace of technological change. The shift to wireless mesh networking introduces concerns about data integrity and cybersecurity, while ensuring proper galvanic isolation and insulation resistance monitoring in compact, high-density designs remains a significant engineering hurdle.
  • The growing diversity of battery chemistries requires multi-chemistry support, complicating the development of universal electrochemical modeling and cycle life monitoring tools. For instance, integrating with a new solid-state battery interface can require up to 40% more development time compared to traditional lithium-ion systems.
  • Furthermore, the processes for second-life battery assessment are still being standardized, and the effective implementation of high-voltage contactor control, overcurrent protection, and deep discharge prevention in these repurposed systems presents ongoing technical difficulties that are being addressed through cloud-based data aggregation.

Exclusive Technavio Analysis on Customer Landscape

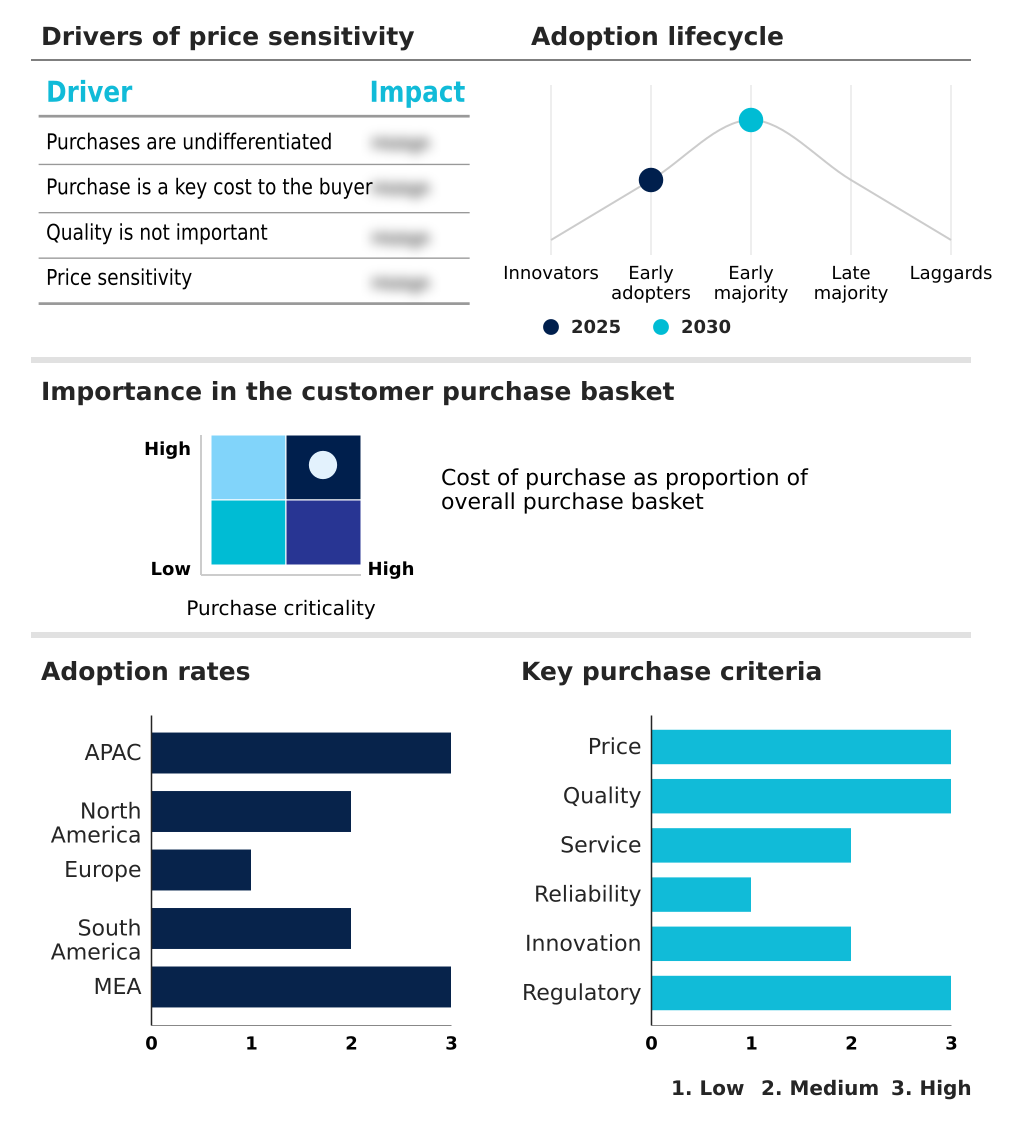
The battery monitoring systems market forecasting report includes the adoption lifecycle of the market, covering from the innovator’s stage to the laggard’s stage. It focuses on adoption rates in different regions based on penetration. Furthermore, the battery monitoring systems market report also includes key purchase criteria and drivers of price sensitivity to help companies evaluate and develop their market growth analysis strategies.

Customer Landscape of Battery Monitoring Systems Industry

Competitive Landscape

Companies are implementing various strategies, such as strategic alliances, battery monitoring systems market forecast, partnerships, mergers and acquisitions, geographical expansion, and product/service launches, to enhance their presence in the industry.

ABB Ltd. - Provides battery monitoring systems tracking voltage, temperature, and health for safe, efficient industrial and energy operations.

The industry research and growth report includes detailed analyses of the competitive landscape of the market and information about key companies, including:

  • ABB Ltd.
  • Analog Devices Inc.
  • BMS Powersafe
  • Curtis Instruments Inc.
  • Eaton Corp. Plc
  • Eberspacher Gruppe GmbH
  • Eagle Eye Power Solutions LLC
  • Efftronics Systems Pvt. Ltd
  • Elithion Inc.
  • General Electric Co.
  • Honeywell International Inc.
  • Infineon Technologies AG
  • NXP Semiconductors NV
  • Renesas Electronics Corp.
  • RTX Corp.
  • Schneider Electric SE
  • Sensata Technologies Inc.
  • Siemens AG
  • Texas Instruments Inc.
  • Vertiv Holdings Co.

Qualitative and quantitative analysis of companies has been conducted to help clients understand the wider business environment as well as the strengths and weaknesses of key industry players. Data is qualitatively analyzed to categorize companies as pure play, category-focused, industry-focused, and diversified; it is quantitatively analyzed to categorize companies as dominant, leading, strong, tentative, and weak.

Recent Development and News in Battery monitoring systems market

  • In August 2025, Texas Instruments introduced a new line of automotive-grade wireless battery management chips that employ a proprietary mesh network to guarantee 99% data reliability in environments with high vibration.
  • In July 2025, TWAICE revealed a significant advancement in its cloud-based battery analytics platform, which now integrates generative AI to simulate millions of stress test scenarios for lithium-ion cells in less than one hour.
  • In June 2025, Siemens Energy was awarded a major contract to supply advanced diagnostic and monitoring infrastructure for a large-scale offshore wind storage project in the North Sea.
  • In April 2025, Sensata Technologies introduced a new series of thermal runaway detection sensors tailored for heavy-duty commercial vehicle fleets to mitigate fire risks in high-density battery packs.

Dive into Technavio’s robust research methodology, blending expert interviews, extensive data synthesis, and validated models for unparalleled Battery Monitoring Systems Market insights. See full methodology.

Market Scope
Page number 296
Base year 2025
Historic period 2020-2024
Forecast period 2026-2030
Growth momentum & CAGR Accelerate at a CAGR of 22.6%
Market growth 2026-2030 USD 13594.4 million
Market structure Fragmented
YoY growth 2025-2026(%) 18.5%
Key countries China, Japan, India, South Korea, Australia, Indonesia, US, Canada, Mexico, Germany, UK, France, Italy, Spain, The Netherlands, Brazil, Argentina, Chile, Saudi Arabia, UAE, South Africa, Israel and Turkey
Competitive landscape Leading Companies, Market Positioning of Companies, Competitive Strategies, and Industry Risks

Request Free Sample

Research Analyst Overview

  • The battery monitoring systems market is defined by the convergence of advanced hardware and intelligent software, creating systems that are fundamental to modern energy infrastructure. The use of voltage sensors, current transducers, and temperature probes provides the raw data for sophisticated state of charge (soc) estimation and state of health (soh) analytics.
  • Algorithms for remaining useful life (rul) prediction and active cell management are now standard, while kalman filtering and digital twin modeling enhance predictive accuracy. On the hardware side, innovations in galvanic isolation, overcurrent protection, and deep discharge prevention ensure operational safety. Advanced techniques like impedance spectroscopy and coulomb counting, combined with open-circuit voltage measurement, refine energy assessments.
  • This shift toward high-fidelity monitoring, supported by ruggedized hardware and scalable system design with embedded firmware, has a direct impact on boardroom strategy, particularly in asset lifecycle planning. For example, the adoption of comprehensive fault diagnostics and internal resistance tracking has been shown to reduce critical failure analysis time by over 40%, directly impacting operational expenditure and uptime guarantees.

What are the Key Data Covered in this Battery Monitoring Systems Market Research and Growth Report?

  • What is the expected growth of the Battery Monitoring Systems Market between 2026 and 2030?

    • USD 13.59 billion, at a CAGR of 22.6%

  • What segmentation does the market report cover?

    • The report is segmented by End-user (Automotive, Energy, and Telecom and data center), Component (Hardware, and Software), Type (Wired, and Wireless) and Geography (APAC, North America, Europe, South America, Middle East and Africa)

  • Which regions are analyzed in the report?

    • APAC, North America, Europe, South America and Middle East and Africa

  • What are the key growth drivers and market challenges?

    • Growing adoption of electric vehicles and energy storage systems, Availability of alternative energy management solutions reducing demand for monitoring systems

  • Who are the major players in the Battery Monitoring Systems Market?

    • ABB Ltd., Analog Devices Inc., BMS Powersafe, Curtis Instruments Inc., Eaton Corp. Plc, Eberspacher Gruppe GmbH, Eagle Eye Power Solutions LLC, Efftronics Systems Pvt. Ltd, Elithion Inc., General Electric Co., Honeywell International Inc., Infineon Technologies AG, NXP Semiconductors NV, Renesas Electronics Corp., RTX Corp., Schneider Electric SE, Sensata Technologies Inc., Siemens AG, Texas Instruments Inc. and Vertiv Holdings Co.

Market Research Insights

  • The market is shaped by a confluence of technological advancements and expanding applications. The integration of predictive maintenance alerts, driven by sophisticated analytics, has led to a 25% reduction in unplanned downtime for critical systems. Similarly, the adoption of modular BMS architecture allows for greater scalability, with system expansion costs being 40% lower than with monolithic designs.
  • The shift towards cloud-based data aggregation and edge computing analytics is enabling real-time decision-making for geographically dispersed assets. Furthermore, achieving functional safety compliance is a key differentiator, with certified systems demonstrating superior performance in preventing hazardous events. These dynamics highlight a market moving toward more intelligent, interconnected, and reliable energy management solutions.

We can help! Our analysts can customize this battery monitoring systems market research report to meet your requirements.

Get in touch

1. Executive Summary

1.1 Market overview

Executive Summary - Chart on Market Overview
Executive Summary - Data Table on Market Overview
Executive Summary - Chart on Global Market Characteristics
Executive Summary - Chart on Market by Geography
Executive Summary - Chart on Market Segmentation by End-user
Executive Summary - Chart on Market Segmentation by Component
Executive Summary - Chart on Market Segmentation by Type
Executive Summary - Chart on Incremental Growth
Executive Summary - Data Table on Incremental Growth
Executive Summary - Chart on Company Market Positioning

2. Technavio Analysis

2.1 Analysis of price sensitivity, lifecycle, customer purchase basket, adoption rates, and purchase criteria

2.2 Criticality of inputs and Factors of differentiation

Chart on Overview on criticality of inputs and factors of differentiation

2.3 Factors of disruption

Chart on Overview on factors of disruption

2.4 Impact of drivers and challenges

Chart on Impact of drivers and challenges in 2025 and 2030

3. Market Landscape

3.1 Market ecosystem

Chart on Parent Market
Data Table on - Parent Market

3.2 Market characteristics

Chart on Market characteristics analysis

3.3 Value chain analysis

Chart on Value chain analysis

4. Market Sizing

4.1 Market definition

Data Table on Offerings of companies included in the market definition

4.2 Market segment analysis

Market segments

4.3 Market size 2025

4.4 Market outlook: Forecast for 2025-2030

Chart on Global - Market size and forecast 2025-2030 ($ million)
Data Table on Global - Market size and forecast 2025-2030 ($ million)
Chart on Global Market: Year-over-year growth 2025-2030 (%)
Data Table on Global Market: Year-over-year growth 2025-2030 (%)

5. Historic Market Size

5.1 Global Battery Monitoring Systems Market 2020 - 2024

Historic Market Size - Data Table on Global Battery Monitoring Systems Market 2020 - 2024 ($ million)

5.2 End-user segment analysis 2020 - 2024

Historic Market Size - End-user Segment 2020 - 2024 ($ million)

5.3 Component segment analysis 2020 - 2024

Historic Market Size - Component Segment 2020 - 2024 ($ million)

5.4 Type segment analysis 2020 - 2024

Historic Market Size - Type Segment 2020 - 2024 ($ million)

5.5 Geography segment analysis 2020 - 2024

Historic Market Size - Geography Segment 2020 - 2024 ($ million)

5.6 Country segment analysis 2020 - 2024

Historic Market Size - Country Segment 2020 - 2024 ($ million)

6. Qualitative Analysis

6.1 Impact of AI on Global Battery Monitoring Systems Market

6.2 Impact of Geopolitical Conflicts on Global Battery Monitoring Systems Market

7. Five Forces Analysis

7.1 Five forces summary

Five forces analysis - Comparison between 2025 and 2030

7.2 Bargaining power of buyers

Bargaining power of buyers - Impact of key factors 2025 and 2030

7.3 Bargaining power of suppliers

Bargaining power of suppliers - Impact of key factors in 2025 and 2030

7.4 Threat of new entrants

Threat of new entrants - Impact of key factors in 2025 and 2030

7.5 Threat of substitutes

Threat of substitutes - Impact of key factors in 2025 and 2030

7.6 Threat of rivalry

Threat of rivalry - Impact of key factors in 2025 and 2030

7.7 Market condition

Chart on Market condition - Five forces 2025 and 2030

8. Market Segmentation by End-user

8.1 Market segments

Chart on End-user - Market share 2025-2030 (%)
Data Table on End-user - Market share 2025-2030 (%)

8.2 Comparison by End-user

Chart on Comparison by End-user
Data Table on Comparison by End-user

8.3 Automotive - Market size and forecast 2025-2030

Chart on Automotive - Market size and forecast 2025-2030 ($ million)
Data Table on Automotive - Market size and forecast 2025-2030 ($ million)
Chart on Automotive - Year-over-year growth 2025-2030 (%)
Data Table on Automotive - Year-over-year growth 2025-2030 (%)

8.4 Energy - Market size and forecast 2025-2030

Chart on Energy - Market size and forecast 2025-2030 ($ million)
Data Table on Energy - Market size and forecast 2025-2030 ($ million)
Chart on Energy - Year-over-year growth 2025-2030 (%)
Data Table on Energy - Year-over-year growth 2025-2030 (%)

8.5 Telecom and data center - Market size and forecast 2025-2030

Chart on Telecom and data center - Market size and forecast 2025-2030 ($ million)
Data Table on Telecom and data center - Market size and forecast 2025-2030 ($ million)
Chart on Telecom and data center - Year-over-year growth 2025-2030 (%)
Data Table on Telecom and data center - Year-over-year growth 2025-2030 (%)

8.6 Market opportunity by End-user

Market opportunity by End-user ($ million)
Data Table on Market opportunity by End-user ($ million)

9. Market Segmentation by Component

9.1 Market segments

Chart on Component - Market share 2025-2030 (%)
Data Table on Component - Market share 2025-2030 (%)

9.2 Comparison by Component

Chart on Comparison by Component
Data Table on Comparison by Component

9.3 Hardware - Market size and forecast 2025-2030

Chart on Hardware - Market size and forecast 2025-2030 ($ million)
Data Table on Hardware - Market size and forecast 2025-2030 ($ million)
Chart on Hardware - Year-over-year growth 2025-2030 (%)
Data Table on Hardware - Year-over-year growth 2025-2030 (%)

9.4 Software - Market size and forecast 2025-2030

Chart on Software - Market size and forecast 2025-2030 ($ million)
Data Table on Software - Market size and forecast 2025-2030 ($ million)
Chart on Software - Year-over-year growth 2025-2030 (%)
Data Table on Software - Year-over-year growth 2025-2030 (%)

9.5 Market opportunity by Component

Market opportunity by Component ($ million)
Data Table on Market opportunity by Component ($ million)

10. Market Segmentation by Type

10.1 Market segments

Chart on Type - Market share 2025-2030 (%)
Data Table on Type - Market share 2025-2030 (%)

10.2 Comparison by Type

Chart on Comparison by Type
Data Table on Comparison by Type

10.3 Wired - Market size and forecast 2025-2030

Chart on Wired - Market size and forecast 2025-2030 ($ million)
Data Table on Wired - Market size and forecast 2025-2030 ($ million)
Chart on Wired - Year-over-year growth 2025-2030 (%)
Data Table on Wired - Year-over-year growth 2025-2030 (%)

10.4 Wireless - Market size and forecast 2025-2030

Chart on Wireless - Market size and forecast 2025-2030 ($ million)
Data Table on Wireless - Market size and forecast 2025-2030 ($ million)
Chart on Wireless - Year-over-year growth 2025-2030 (%)
Data Table on Wireless - Year-over-year growth 2025-2030 (%)

10.5 Market opportunity by Type

Market opportunity by Type ($ million)
Data Table on Market opportunity by Type ($ million)

11. Customer Landscape

11.1 Customer landscape overview

Analysis of price sensitivity, lifecycle, customer purchase basket, adoption rates, and purchase criteria

12. Geographic Landscape

12.1 Geographic segmentation

Chart on Market share by geography 2025-2030 (%)
Data Table on Market share by geography 2025-2030 (%)

12.2 Geographic comparison

Chart on Geographic comparison
Data Table on Geographic comparison

12.3 APAC - Market size and forecast 2025-2030

Chart on APAC - Market size and forecast 2025-2030 ($ million)
Data Table on APAC - Market size and forecast 2025-2030 ($ million)
Chart on APAC - Year-over-year growth 2025-2030 (%)
Data Table on APAC - Year-over-year growth 2025-2030 (%)
Chart on Regional Comparison - APAC
Data Table on Regional Comparison - APAC

12.3.1 China - Market size and forecast 2025-2030

Chart on China - Market size and forecast 2025-2030 ($ million)
Data Table on China - Market size and forecast 2025-2030 ($ million)
Chart on China - Year-over-year growth 2025-2030 (%)
Data Table on China - Year-over-year growth 2025-2030 (%)

12.3.2 Japan - Market size and forecast 2025-2030

Chart on Japan - Market size and forecast 2025-2030 ($ million)
Data Table on Japan - Market size and forecast 2025-2030 ($ million)
Chart on Japan - Year-over-year growth 2025-2030 (%)
Data Table on Japan - Year-over-year growth 2025-2030 (%)

12.3.3 India - Market size and forecast 2025-2030

Chart on India - Market size and forecast 2025-2030 ($ million)
Data Table on India - Market size and forecast 2025-2030 ($ million)
Chart on India - Year-over-year growth 2025-2030 (%)
Data Table on India - Year-over-year growth 2025-2030 (%)

12.3.4 South Korea - Market size and forecast 2025-2030

Chart on South Korea - Market size and forecast 2025-2030 ($ million)
Data Table on South Korea - Market size and forecast 2025-2030 ($ million)
Chart on South Korea - Year-over-year growth 2025-2030 (%)
Data Table on South Korea - Year-over-year growth 2025-2030 (%)

12.3.5 Australia - Market size and forecast 2025-2030

Chart on Australia - Market size and forecast 2025-2030 ($ million)
Data Table on Australia - Market size and forecast 2025-2030 ($ million)
Chart on Australia - Year-over-year growth 2025-2030 (%)
Data Table on Australia - Year-over-year growth 2025-2030 (%)

12.3.6 Indonesia - Market size and forecast 2025-2030

Chart on Indonesia - Market size and forecast 2025-2030 ($ million)
Data Table on Indonesia - Market size and forecast 2025-2030 ($ million)
Chart on Indonesia - Year-over-year growth 2025-2030 (%)
Data Table on Indonesia - Year-over-year growth 2025-2030 (%)

12.4 North America - Market size and forecast 2025-2030

Chart on North America - Market size and forecast 2025-2030 ($ million)
Data Table on North America - Market size and forecast 2025-2030 ($ million)
Chart on North America - Year-over-year growth 2025-2030 (%)
Data Table on North America - Year-over-year growth 2025-2030 (%)
Chart on Regional Comparison - North America
Data Table on Regional Comparison - North America

12.4.1 US - Market size and forecast 2025-2030

Chart on US - Market size and forecast 2025-2030 ($ million)
Data Table on US - Market size and forecast 2025-2030 ($ million)
Chart on US - Year-over-year growth 2025-2030 (%)
Data Table on US - Year-over-year growth 2025-2030 (%)

12.4.2 Canada - Market size and forecast 2025-2030

Chart on Canada - Market size and forecast 2025-2030 ($ million)
Data Table on Canada - Market size and forecast 2025-2030 ($ million)
Chart on Canada - Year-over-year growth 2025-2030 (%)
Data Table on Canada - Year-over-year growth 2025-2030 (%)

12.4.3 Mexico - Market size and forecast 2025-2030

Chart on Mexico - Market size and forecast 2025-2030 ($ million)
Data Table on Mexico - Market size and forecast 2025-2030 ($ million)
Chart on Mexico - Year-over-year growth 2025-2030 (%)
Data Table on Mexico - Year-over-year growth 2025-2030 (%)

12.5 Europe - Market size and forecast 2025-2030

Chart on Europe - Market size and forecast 2025-2030 ($ million)
Data Table on Europe - Market size and forecast 2025-2030 ($ million)
Chart on Europe - Year-over-year growth 2025-2030 (%)
Data Table on Europe - Year-over-year growth 2025-2030 (%)
Chart on Regional Comparison - Europe
Data Table on Regional Comparison - Europe

12.5.1 Germany - Market size and forecast 2025-2030

Chart on Germany - Market size and forecast 2025-2030 ($ million)
Data Table on Germany - Market size and forecast 2025-2030 ($ million)
Chart on Germany - Year-over-year growth 2025-2030 (%)
Data Table on Germany - Year-over-year growth 2025-2030 (%)

12.5.2 UK - Market size and forecast 2025-2030

Chart on UK - Market size and forecast 2025-2030 ($ million)
Data Table on UK - Market size and forecast 2025-2030 ($ million)
Chart on UK - Year-over-year growth 2025-2030 (%)
Data Table on UK - Year-over-year growth 2025-2030 (%)

12.5.3 France - Market size and forecast 2025-2030

Chart on France - Market size and forecast 2025-2030 ($ million)
Data Table on France - Market size and forecast 2025-2030 ($ million)
Chart on France - Year-over-year growth 2025-2030 (%)
Data Table on France - Year-over-year growth 2025-2030 (%)

12.5.4 Italy - Market size and forecast 2025-2030

Chart on Italy - Market size and forecast 2025-2030 ($ million)
Data Table on Italy - Market size and forecast 2025-2030 ($ million)
Chart on Italy - Year-over-year growth 2025-2030 (%)
Data Table on Italy - Year-over-year growth 2025-2030 (%)

12.5.5 Spain - Market size and forecast 2025-2030

Chart on Spain - Market size and forecast 2025-2030 ($ million)
Data Table on Spain - Market size and forecast 2025-2030 ($ million)
Chart on Spain - Year-over-year growth 2025-2030 (%)
Data Table on Spain - Year-over-year growth 2025-2030 (%)

12.5.6 The Netherlands - Market size and forecast 2025-2030

Chart on The Netherlands - Market size and forecast 2025-2030 ($ million)
Data Table on The Netherlands - Market size and forecast 2025-2030 ($ million)
Chart on The Netherlands - Year-over-year growth 2025-2030 (%)
Data Table on The Netherlands - Year-over-year growth 2025-2030 (%)

12.6 South America - Market size and forecast 2025-2030

Chart on South America - Market size and forecast 2025-2030 ($ million)
Data Table on South America - Market size and forecast 2025-2030 ($ million)
Chart on South America - Year-over-year growth 2025-2030 (%)
Data Table on South America - Year-over-year growth 2025-2030 (%)
Chart on Regional Comparison - South America
Data Table on Regional Comparison - South America

12.6.1 Brazil - Market size and forecast 2025-2030

Chart on Brazil - Market size and forecast 2025-2030 ($ million)
Data Table on Brazil - Market size and forecast 2025-2030 ($ million)
Chart on Brazil - Year-over-year growth 2025-2030 (%)
Data Table on Brazil - Year-over-year growth 2025-2030 (%)

12.6.2 Argentina - Market size and forecast 2025-2030

Chart on Argentina - Market size and forecast 2025-2030 ($ million)
Data Table on Argentina - Market size and forecast 2025-2030 ($ million)
Chart on Argentina - Year-over-year growth 2025-2030 (%)
Data Table on Argentina - Year-over-year growth 2025-2030 (%)

12.6.3 Chile - Market size and forecast 2025-2030

Chart on Chile - Market size and forecast 2025-2030 ($ million)
Data Table on Chile - Market size and forecast 2025-2030 ($ million)
Chart on Chile - Year-over-year growth 2025-2030 (%)
Data Table on Chile - Year-over-year growth 2025-2030 (%)

12.7 Middle East and Africa - Market size and forecast 2025-2030

Chart on Middle East and Africa - Market size and forecast 2025-2030 ($ million)
Data Table on Middle East and Africa - Market size and forecast 2025-2030 ($ million)
Chart on Middle East and Africa - Year-over-year growth 2025-2030 (%)
Data Table on Middle East and Africa - Year-over-year growth 2025-2030 (%)
Chart on Regional Comparison - Middle East and Africa
Data Table on Regional Comparison - Middle East and Africa

12.7.1 Saudi Arabia - Market size and forecast 2025-2030

Chart on Saudi Arabia - Market size and forecast 2025-2030 ($ million)
Data Table on Saudi Arabia - Market size and forecast 2025-2030 ($ million)
Chart on Saudi Arabia - Year-over-year growth 2025-2030 (%)
Data Table on Saudi Arabia - Year-over-year growth 2025-2030 (%)

12.7.2 UAE - Market size and forecast 2025-2030

Chart on UAE - Market size and forecast 2025-2030 ($ million)
Data Table on UAE - Market size and forecast 2025-2030 ($ million)
Chart on UAE - Year-over-year growth 2025-2030 (%)
Data Table on UAE - Year-over-year growth 2025-2030 (%)

12.7.3 South Africa - Market size and forecast 2025-2030

Chart on South Africa - Market size and forecast 2025-2030 ($ million)
Data Table on South Africa - Market size and forecast 2025-2030 ($ million)
Chart on South Africa - Year-over-year growth 2025-2030 (%)
Data Table on South Africa - Year-over-year growth 2025-2030 (%)

12.7.4 Israel - Market size and forecast 2025-2030

Chart on Israel - Market size and forecast 2025-2030 ($ million)
Data Table on Israel - Market size and forecast 2025-2030 ($ million)
Chart on Israel - Year-over-year growth 2025-2030 (%)
Data Table on Israel - Year-over-year growth 2025-2030 (%)

12.7.5 Turkey - Market size and forecast 2025-2030

Chart on Turkey - Market size and forecast 2025-2030 ($ million)
Data Table on Turkey - Market size and forecast 2025-2030 ($ million)
Chart on Turkey - Year-over-year growth 2025-2030 (%)
Data Table on Turkey - Year-over-year growth 2025-2030 (%)

12.8 Market opportunity by geography

Market opportunity by geography ($ million)
Data Tables on Market opportunity by geography ($ million)

13. Drivers, Challenges, and Opportunity

13.1 Market drivers

Growing adoption of electric vehicles and energy storage systems
Increasing need for reliable power management and battery safety
Rising investments in renewable energy and grid infrastructure

13.2 Market challenges

Availability of alternative energy management solutions reducing demand for monitoring systems
Technical complexities in integration with advanced battery technologies
High initial implementation and maintenance costs for end user

13.3 Impact of drivers and challenges

Impact of drivers and challenges in 2025 and 2030

13.4 Market opportunities

Integration of artificial intelligence and data analytics in monitoring systems
Increasing adoption of wireless and cloud based monitoring solutions
Growing use of battery monitoring in data centres and industrial applications

14. Competitive Landscape

14.1 Overview

14.2

Overview on criticality of inputs and factors of differentiation

14.3 Landscape disruption

Overview on factors of disruption

14.4 Industry risks

Impact of key risks on business

15. Competitive Analysis

15.1 Companies profiled

Companies covered

15.2 Company ranking index

15.3 Market positioning of companies

Matrix on companies position and classification

15.4 ABB Ltd.

ABB Ltd. - Overview
ABB Ltd. - Business segments
ABB Ltd. - Key news
ABB Ltd. - Key offerings
ABB Ltd. - Segment focus
SWOT

15.5 Analog Devices Inc.

Analog Devices Inc. - Overview
Analog Devices Inc. - Business segments
Analog Devices Inc. - Key offerings
Analog Devices Inc. - Segment focus
SWOT

15.6 Eaton Corp. Plc

Eaton Corp. Plc - Overview
Eaton Corp. Plc - Business segments
Eaton Corp. Plc - Key offerings
Eaton Corp. Plc - Segment focus
SWOT

15.7 Eberspacher Gruppe GmbH

Eberspacher Gruppe GmbH - Overview
Eberspacher Gruppe GmbH - Product / Service
Eberspacher Gruppe GmbH - Key offerings
SWOT

15.8 General Electric Co.

General Electric Co. - Overview
General Electric Co. - Business segments
General Electric Co. - Key offerings
General Electric Co. - Segment focus
SWOT

15.9 Honeywell International Inc.

Honeywell International Inc. - Overview
Honeywell International Inc. - Business segments
Honeywell International Inc. - Key news
Honeywell International Inc. - Key offerings
Honeywell International Inc. - Segment focus
SWOT

15.10 Infineon Technologies AG

Infineon Technologies AG - Overview
Infineon Technologies AG - Business segments
Infineon Technologies AG - Key news
Infineon Technologies AG - Key offerings
Infineon Technologies AG - Segment focus
SWOT

15.11 NXP Semiconductors NV

NXP Semiconductors NV - Overview
NXP Semiconductors NV - Business segments
NXP Semiconductors NV - Key news
NXP Semiconductors NV - Key offerings
NXP Semiconductors NV - Segment focus
SWOT

15.12 Renesas Electronics Corp.

Renesas Electronics Corp. - Overview
Renesas Electronics Corp. - Business segments
Renesas Electronics Corp. - Key news
Renesas Electronics Corp. - Key offerings
Renesas Electronics Corp. - Segment focus
SWOT

15.13 RTX Corp.

RTX Corp. - Overview
RTX Corp. - Business segments
RTX Corp. - Key offerings
RTX Corp. - Segment focus
SWOT

15.14 Schneider Electric SE

Schneider Electric SE - Overview
Schneider Electric SE - Business segments
Schneider Electric SE - Key offerings
Schneider Electric SE - Segment focus
SWOT

15.15 Sensata Technologies Inc.

Sensata Technologies Inc. - Overview
Sensata Technologies Inc. - Business segments
Sensata Technologies Inc. - Key news
Sensata Technologies Inc. - Key offerings
Sensata Technologies Inc. - Segment focus
SWOT

15.16 Siemens AG

Siemens AG - Overview
Siemens AG - Business segments
Siemens AG - Key news
Siemens AG - Key offerings
Siemens AG - Segment focus
SWOT

15.17 Texas Instruments Inc.

Texas Instruments Inc. - Overview
Texas Instruments Inc. - Business segments
Texas Instruments Inc. - Key offerings
Texas Instruments Inc. - Segment focus
SWOT

15.18 Vertiv Holdings Co.

Vertiv Holdings Co. - Overview
Vertiv Holdings Co. - Business segments
Vertiv Holdings Co. - Key news
Vertiv Holdings Co. - Key offerings
Vertiv Holdings Co. - Segment focus
SWOT

16. Appendix

16.1 Scope of the report

Market definition
Objectives
Notes and caveats

16.2 Inclusions and exclusions checklist

Inclusions checklist
Exclusions checklist

16.3 Currency conversion rates for US$

16.4 Research methodology

16.5 Data procurement

Information sources

16.6 Data validation

16.7 Validation techniques employed for market sizing

16.8 Data synthesis

16.9 360 degree market analysis

16.10 List of abbreviations

Research Methodology

Technavio presents a detailed picture of the market by way of study, synthesis, and summation of data from multiple sources. The analysts have presented the various facets of the market with a particular focus on identifying the key industry influencers. The data thus presented is comprehensive, reliable, and the result of extensive research, both primary and secondary.

INFORMATION SOURCES

Primary sources

  • Manufacturers and suppliers
  • Channel partners
  • Industry experts
  • Strategic decision makers

Secondary sources

  • Industry journals and periodicals
  • Government data
  • Financial reports of key industry players
  • Historical data
  • Press releases

DATA ANALYSIS

Data Synthesis

  • Collation of data
  • Estimation of key figures
  • Analysis of derived insights

Data Validation

  • Triangulation with data models
  • Reference against proprietary databases
  • Corroboration with industry experts

REPORT WRITING

Qualitative

  • Market drivers
  • Market challenges
  • Market trends
  • Five forces analysis

Quantitative

  • Market size and forecast
  • Market segmentation
  • Geographical insights
  • Competitive landscape

Interested in this report?

Get your sample now to see our research methodology and insights!

Download Now

Frequently Asked Questions

Battery Monitoring Systems market growth will increase by USD 13594.4 million during 2026-2030.

The Battery Monitoring Systems market is expected to grow at a CAGR of 22.6% during 2026-2030.

Battery Monitoring Systems market is segmented by End-user (Automotive, Energy, Telecom and data center) Component (Hardware, Software) Type (Wired, Wireless)

ABB Ltd., Analog Devices Inc., BMS Powersafe, Curtis Instruments Inc., Eaton Corp. Plc, Eberspacher Gruppe GmbH, Eagle Eye Power Solutions LLC, Efftronics Systems Pvt. Ltd, Elithion Inc., General Electric Co., Honeywell International Inc., Infineon Technologies AG, NXP Semiconductors NV, Renesas Electronics Corp., RTX Corp., Schneider Electric SE, Sensata Technologies Inc., Siemens AG, Texas Instruments Inc., Vertiv Holdings Co. are a few of the key vendors in the Battery Monitoring Systems market.

APAC will register the highest growth rate of 51.5% among the other regions. Therefore, the Battery Monitoring Systems market in APAC is expected to garner significant business opportunities for the vendors during the forecast period.

China, Japan, India, South Korea, Australia, Indonesia, US, Canada, Mexico, Germany, UK, France, Italy, Spain, The Netherlands, Brazil, Argentina, Chile, Saudi Arabia, UAE, South Africa, Israel, Turkey

  • Growing adoption of electric vehicles and energy storage systems is the driving factor this market.

The Battery Monitoring Systems market vendors should focus on grabbing business opportunities from the End-user segment as it accounted for the largest market share in the base year.
RIA - Research AI Assistant
Ask RIA