Banknote Market Analysis, Size, and Forecast 2026-2030: APAC (China, India, and Japan), Middle East and Africa (South Africa, Saudi Arabia, and UAE), South America (Brazil, Argentina, and Colombia), North America (US, Canada, and Mexico), Europe (Germany, UK, and France), and Rest of World (ROW)

Banknote Market Analysis, Size, and Forecast 2026-2030:
APAC (China, India, and Japan), Middle East and Africa (South Africa, Saudi Arabia, and UAE), South America (Brazil, Argentina, and Colombia), North America (US, Canada, and Mexico), Europe (Germany, UK, and France), and Rest of World (ROW)

Published: Jan 2026 285 Pages SKU: IRTNTR72100

Market Overview at a Glance

$2.19 B
Market Opportunity
4.7%
CAGR 2025 - 2030
68.1%
APAC Growth
$6.89 B
State-owned segment 2024

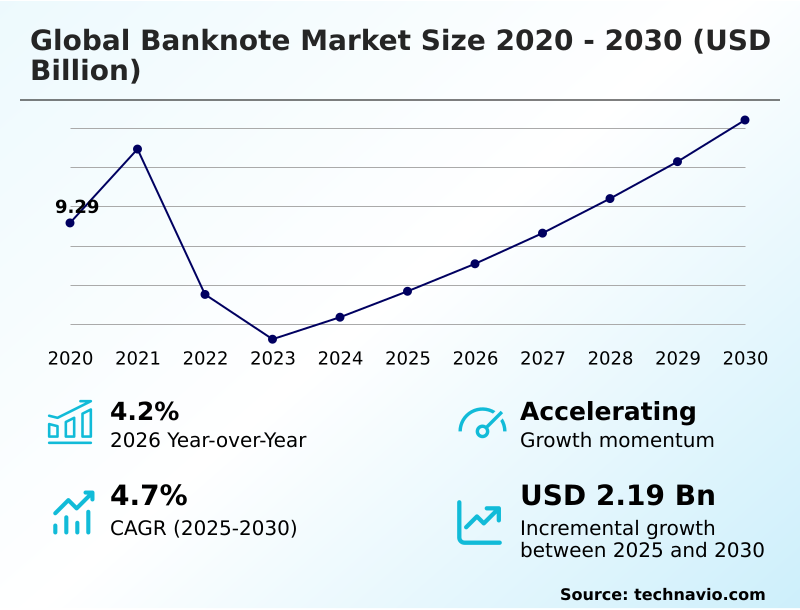
Banknote Market Size 2026-2030

The banknote market size is valued to increase by USD 2.19 billion, at a CAGR of 4.7% from 2025 to 2030. Escalating demand for high-security features and counterfeit deterrence will drive the banknote market.

Major Market Trends & Insights

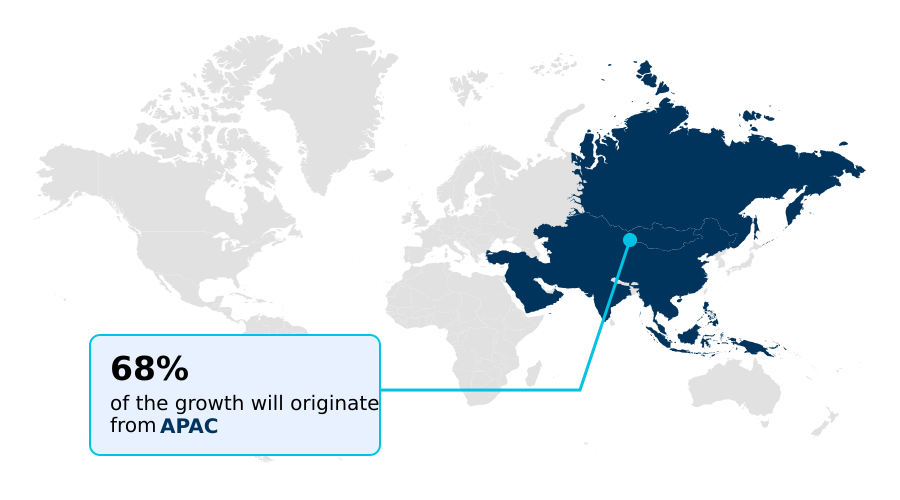
  • APAC dominated the market and accounted for a 68.1% growth during the forecast period.
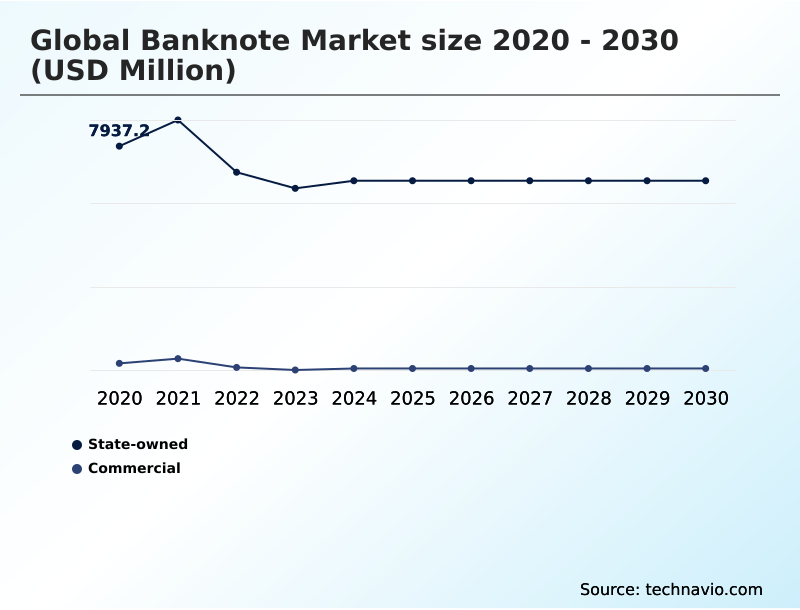
  • By Type - State-owned segment was valued at USD 6.89 billion in 2024
  • By Application - Intaglio printing segment accounted for the largest market revenue share in 2024

Market Size & Forecast

  • Market Opportunities: USD 1.31 billion
  • Market Future Opportunities: USD 2.19 billion
  • CAGR from 2025 to 2030 : 4.7%

Market Summary

  • The banknote market is defined by a continuous push for technological resilience and security innovation to maintain the relevance of physical currency. Central banks globally are focused on upgrading their currency with features that deter sophisticated counterfeiting, such as advanced holographic security threads and micro-optic features.
  • This involves a strategic shift towards more durable substrates, including polymer and hybrid materials, which not only extend the circulation life of notes but also accommodate more complex security elements.
  • For instance, a central monetary authority must balance the higher initial cost of polymer substrates, which offer superior durability and cleanliness, against the familiar tactility of banknote paper that the public trusts. This decision-making process is critical as cash remains vital for financial inclusion and as a resilient payment method during digital infrastructure outages.
  • The industry is also contending with the rise of digital payment infrastructure and central bank digital currencies, forcing a re-evaluation of cash cycle management and the long-term role of physical legal tender as both a medium of exchange and a store of value.
  • The strategic modernization of currency management systems, including secure printing and automated processing, is essential for operational efficiency.

What will be the Size of the Banknote Market during the forecast period?

Get Key Insights on Market Forecast (PDF) Request Free Sample

How is the Banknote Market Segmented?

The banknote industry research report provides comprehensive data (region-wise segment analysis), with forecasts and estimates in "USD million" for the period 2026-2030, as well as historical data from 2020-2024 for the following segments.

  • Type
    • State-owned
    • Commercial
  • Application
    • Intaglio printing
    • Offset printing
    • Letterpress printing
  • Material
    • Paper
    • Polymer
    • Hybrid
  • Geography
    • APAC
      • China
      • India
      • Japan
    • Middle East and Africa
      • South Africa
      • Saudi Arabia
      • UAE
    • South America
      • Brazil
      • Argentina
      • Colombia
    • North America
      • US
      • Canada
      • Mexico
    • Europe
      • Germany
      • UK
      • France
    • Rest of World (ROW)

By Type Insights

The state-owned segment is estimated to witness significant growth during the forecast period.

The global banknote market is segmented by type, application, material, and geography. By type, the market includes state-owned and commercial entities. Application-wise, it covers intaglio printing, offset printing, and letterpress printing. Material segmentation comprises paper, polymer, and hybrid substrates.

The market's geographical scope extends across APAC, the Middle East and Africa, South America, North America, and Europe. This segmentation reflects the diverse banknote production processes and material choices driven by varying security needs and operational priorities.

Advanced anti-counterfeit measures, such as holographic security threads and optically variable inks, are critical across segments, influencing decisions on substrate and printing techniques.

As digital payment infrastructure expands, the focus on durable and secure physical currency intensifies, shaping both state-owned and commercial banknote production strategies.

Request Free Sample

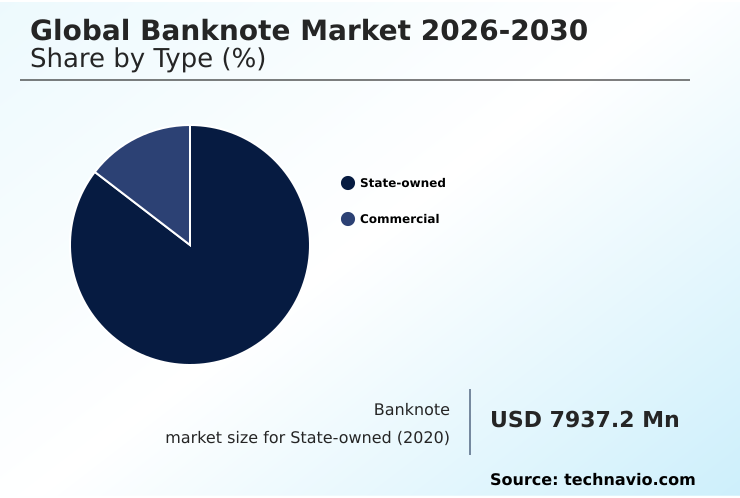
The State-owned segment was valued at USD 6.89 billion in 2024 and showed a gradual increase during the forecast period.

Request Free Sample

Regional Analysis

APAC is estimated to contribute 68.1% to the growth of the global market during the forecast period.Technavio’s analysts have elaborately explained the regional trends and drivers that shape the market during the forecast period.

See How Banknote Market Demand is Rising in APAC Request Free Sample

The geographic landscape of the banknote market is dominated by the APAC region, which is projected to contribute over 68% of the market's incremental growth, driven by high cash usage and currency modernization projects.

In contrast, North America and Europe collectively represent less than 8% of new growth opportunities, reflecting mature markets with high digital currency adoption.

Regional dynamics are increasingly influenced by the need for enhanced cash logistics and secure cash-in-transit operations, particularly in developing economies. Central banks are implementing measures like dye-staining technology to secure the currency supply chain.

Decisions regarding currency redesign and the selection of high-security paper versus polymer are often tied to regional economic factors and the need to ensure monetary stability.

The coexistence of physical legal tender with emerging tokenised bank liabilities is a key consideration shaping regional strategies.

Market Dynamics

Our researchers analyzed the data with 2025 as the base year, along with the key drivers, trends, and challenges. A holistic analysis of drivers will help companies refine their marketing strategies to gain a competitive advantage.

  • Strategic decisions within the global banknote market are increasingly shaped by the total cost of currency ownership, forcing a detailed comparison of polymer versus paper banknote durability. This analysis extends beyond initial production to encompass the entire banknote lifecycle management, where sustainability challenges are becoming a key factor.
  • The environmental impact of banknote substrate production is under intense scrutiny, driving innovation in hybrid substrate technology for currency longevity and improved methods for recycling polymer banknotes. In parallel, the technological arms race in banknote counterfeiting continues, elevating the role of intaglio printing in counterfeit deterrence and spurring the development of micro-optic features for public banknote authentication.
  • Central banks are adopting comprehensive currency redesign strategies that balance security features with banknote aesthetics to reinforce national identity. The integration of machine-readable features for automated cash processing is critical for managing cash cycles, especially in high-inflation economies where modernization of cash-in-transit security systems is also a priority.
  • Some authorities have reported a drop in counterfeit incidents of over 50% in the years following a new series launch, underscoring the effectiveness of these comprehensive upgrades. Ultimately, central bank policies on clean note circulation and the integration of tactile features for the visually impaired are becoming standard, ensuring cash remains an inclusive and secure medium.

What are the key market drivers leading to the rise in the adoption of Banknote Industry?

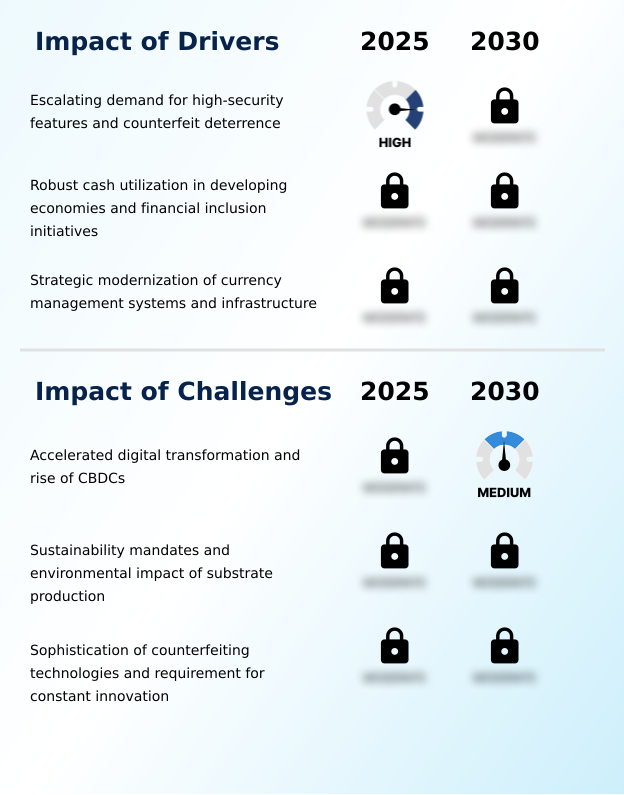
  • The escalating demand for high-security features to deter counterfeiting is a key driver for the market.

  • Market growth is primarily driven by the continuous need for advanced security features to maintain public trust in physical currency. The integration of micro-optic features, complex watermark technology, and color-shifting inks serves as a primary defense against counterfeiting.
  • These public authentication elements are designed for easy verification while remaining difficult to replicate. Innovations such as see-through registers and latent images, created through precision printing, further enhance security.
  • The demand for robust monetary policy instruments is fueling investment in a resilient currency infrastructure. Automation is also a significant factor, with cash handling automation and high-speed sorting systems requiring standardized machine-readable features.
  • This push for technological upgrades ensures banknotes can be processed with over 99.9% accuracy, strengthening the integrity of the cash ecosystem.

What are the market trends shaping the Banknote Industry?

  • The integration of advanced holographics and micro-optic security features is an emergent trend. This development is enhancing the anti-counterfeiting capabilities of modern banknotes.

  • Key market trends are centered on enhancing physical currency security and sustainability. The industry is witnessing a significant shift toward durable substrates and advanced banknote design to extend the currency lifecycle and improve banknote durability standards. These efforts are crucial for efficient cash management operations and securing the overall currency supply chain.
  • For example, the adoption of advanced polymers has demonstrated an ability to reduce the carbon footprint of the cash cycle by up to 30% compared to traditional materials. Furthermore, the integration of sophisticated anti-counterfeiting technologies and complex tactile features not only bolsters secure legal tender but also supports financial inclusion initiatives by making currency more accessible.
  • Effective cash cycle management is becoming a strategic priority, ensuring that physical cash remains a reliable component of the financial system.

What challenges does the Banknote Industry face during its growth?

  • Accelerated digital transformation and the emergence of central bank digital currencies (CBDCs) present a key challenge to industry growth.

  • The banknote market faces significant challenges from accelerating digital transformation and the imperative for sustainability. The rise of alternative payment systems and the exploration of central bank digital currencies are fundamentally altering the role of cash as a medium of exchange, although its function as a store of value remains resilient.
  • Concurrently, there is growing pressure to innovate with sustainable substrate materials and adopt greener currency processing methods. Central banks must now balance the high costs of banknote modernization, including the development of hybrid substrates and secure security windows, with environmental mandates. This includes addressing complexities in banknote recycling and adhering to a clean note policy.
  • Effective counterfeit detection methods and aesthetically pleasing currency aesthetics are essential to maintain public confidence amidst these transitions.

Exclusive Technavio Analysis on Customer Landscape

The banknote market forecasting report includes the adoption lifecycle of the market, covering from the innovator’s stage to the laggard’s stage. It focuses on adoption rates in different regions based on penetration. Furthermore, the banknote market report also includes key purchase criteria and drivers of price sensitivity to help companies evaluate and develop their market growth analysis strategies.

Customer Landscape of Banknote Industry

Competitive Landscape

Companies are implementing various strategies, such as strategic alliances, banknote market forecast, partnerships, mergers and acquisitions, geographical expansion, and product/service launches, to enhance their presence in the industry.

Banco de Portugal - Operations focus on producing secure legal tender through central-bank-grade printing, incorporating standardized security features to ensure currency integrity and public trust.

The industry research and growth report includes detailed analyses of the competitive landscape of the market and information about key companies, including:

  • Banco de Portugal
  • BEP
  • BNB Printing House AD
  • CCL Secure Ltd.
  • Central Engraving and Printing
  • China Banknote Group Co. Ltd.
  • Crane and Co. Inc.
  • De La Rue PLC
  • FNMT RCM
  • Giesecke Devrient GmbH
  • Goznak
  • Hong Kong Note Printing Ltd.
  • National Printing Bureau
  • Note Printing Australia Ltd.
  • Orell Fussli AG
  • Reserve Bank of India
  • Security Papers Ltd.
  • Security Printing and Minting
  • SPS TechnoScreen GmbH
  • The Security Printing Corp.

Qualitative and quantitative analysis of companies has been conducted to help clients understand the wider business environment as well as the strengths and weaknesses of key industry players. Data is qualitatively analyzed to categorize companies as pure play, category-focused, industry-focused, and diversified; it is quantitatively analyzed to categorize companies as dominant, leading, strong, tentative, and weak.

Recent Development and News in Banknote market

  • In September 2024, the Reserve Bank of India reported that 97.96% of the withdrawn INR 2,000 banknotes had been returned to the banking system, marking a significant step in its currency management policy.
  • In January 2025, the Governing Council of the European Central Bank selected the final motifs for the future euro banknotes, focusing on themes of European culture and nature, initiating the design phase for the new series.
  • In March 2025, the Central Bank of the UAE announced the issuance of a new AED 100 banknote made from polymer, incorporating innovative designs and advanced security elements as part of its currency modernization project.
  • In April 2025, the board of De La Rue recommended a takeover offer from Atlas Holdings, signaling a major strategic shift from public listing to private ownership for the prominent commercial currency printer.

Dive into Technavio’s robust research methodology, blending expert interviews, extensive data synthesis, and validated models for unparalleled Banknote Market insights. See full methodology.

Market Scope
Page number 285
Base year 2025
Historic period 2020-2024
Forecast period 2026-2030
Growth momentum & CAGR Accelerate at a CAGR of 4.7%
Market growth 2026-2030 USD 2187.0 million
Market structure Fragmented
YoY growth 2025-2026(%) 4.2%
Key countries China, India, Japan, South Korea, Australia, Indonesia, South Africa, Saudi Arabia, Egypt, UAE, Nigeria, Brazil, Argentina, Colombia, US, Canada, Mexico, Germany, UK, France, Italy, Spain and The Netherlands
Competitive landscape Leading Companies, Market Positioning of Companies, Competitive Strategies, and Industry Risks

Request Free Sample

Research Analyst Overview

  • The banknote market is undergoing a significant transformation driven by the need for advanced counterfeit deterrence and operational efficiency. Central banks are prioritizing the integration of complex security features, moving beyond traditional banknote paper to adopt polymer substrates and hybrid substrates.
  • These materials support sophisticated elements like holographic security threads, optically variable inks, and tactile features, which are critical for both public verification and automated currency processing. The implementation of enhanced security printing techniques is essential in the face of rising threats, with a focus on durability and resilience throughout the currency lifecycle.
  • A key boardroom-level consideration is aligning the high capital expenditure of banknote modernization programs with national ESG mandates and sustainability goals. For instance, the transition to durable substrates that reduce replacement frequency can lower the environmental footprint of the cash cycle.
  • Advanced security threads have been shown to enhance verification speed by up to 40% in automated sorting machines, directly improving the efficiency of cash cycle management. This commitment to innovation ensures that central bank money remains a secure and trusted form of legal tender.

What are the Key Data Covered in this Banknote Market Research and Growth Report?

  • What is the expected growth of the Banknote Market between 2026 and 2030?

    • USD 2.19 billion, at a CAGR of 4.7%

  • What segmentation does the market report cover?

    • The report is segmented by Type (State-owned, and Commercial), Application (Intaglio printing, Offset printing, and Letterpress printing), Material (Paper, Polymer, and Hybrid) and Geography (APAC, Middle East and Africa, South America, North America, Europe)

  • Which regions are analyzed in the report?

    • APAC, Middle East and Africa, South America, North America and Europe

  • What are the key growth drivers and market challenges?

    • Escalating demand for high-security features and counterfeit deterrence, Accelerated digital transformation and rise of CBDCs

  • Who are the major players in the Banknote Market?

    • Banco de Portugal, BEP, BNB Printing House AD, CCL Secure Ltd., Central Engraving and Printing, China Banknote Group Co. Ltd., Crane and Co. Inc., De La Rue PLC, FNMT RCM, Giesecke Devrient GmbH, Goznak, Hong Kong Note Printing Ltd., National Printing Bureau, Note Printing Australia Ltd., Orell Fussli AG, Reserve Bank of India, Security Papers Ltd., Security Printing and Minting, SPS TechnoScreen GmbH and The Security Printing Corp.

Market Research Insights

  • The banknote market's dynamics are shaped by the dual pressures of technological innovation and evolving payment ecosystems. While the adoption of digital currencies and mobile payments is accelerating, physical currency security remains a paramount concern for central banks, driving investment in advanced anti-counterfeit measures.
  • For example, the use of polymer substrates has been shown to reduce replacement frequency by over 60% compared to traditional paper, significantly lowering long-term operational costs. Concurrently, the integration of machine-readable features into banknotes allows for high-speed sorting and verification, with some automated systems achieving authentication accuracy rates exceeding 99.9%.
  • These advancements in currency security technologies are crucial for maintaining public trust in secure legal tender, especially in regions with ongoing financial inclusion initiatives where cash is the primary medium of exchange. The industry must navigate these shifts to ensure cash remains a resilient and viable component of the monetary system.

We can help! Our analysts can customize this banknote market research report to meet your requirements.

Get in touch

1. Executive Summary

1.1 Market overview

Executive Summary - Chart on Market Overview
Executive Summary - Data Table on Market Overview
Executive Summary - Chart on Global Market Characteristics
Executive Summary - Chart on Market by Geography
Executive Summary - Chart on Market Segmentation by Type
Executive Summary - Chart on Market Segmentation by Application
Executive Summary - Chart on Market Segmentation by Material
Executive Summary - Chart on Incremental Growth
Executive Summary - Data Table on Incremental Growth
Executive Summary - Chart on Company Market Positioning

2. Technavio Analysis

2.1 Analysis of price sensitivity, lifecycle, customer purchase basket, adoption rates, and purchase criteria

2.2 Criticality of inputs and Factors of differentiation

Chart on Overview on criticality of inputs and factors of differentiation

2.3 Factors of disruption

Chart on Overview on factors of disruption

2.4 Impact of drivers and challenges

Chart on Impact of drivers and challenges in 2025 and 2030

3. Market Landscape

3.1 Market ecosystem

Chart on Parent Market
Data Table on - Parent Market

3.2 Market characteristics

Chart on Market characteristics analysis

3.3 Value chain analysis

Chart on Value chain analysis

4. Market Sizing

4.1 Market definition

Data Table on Offerings of companies included in the market definition

4.2 Market segment analysis

Market segments

4.3 Market size 2025

4.4 Market outlook: Forecast for 2025-2030

Chart on Global - Market size and forecast 2025-2030 ($ million)
Data Table on Global - Market size and forecast 2025-2030 ($ million)
Chart on Global Market: Year-over-year growth 2025-2030 (%)
Data Table on Global Market: Year-over-year growth 2025-2030 (%)

5. Historic Market Size

5.1 Global Banknote Market 2020 - 2024

Historic Market Size - Data Table on Global Banknote Market 2020 - 2024 ($ million)

5.2 Type segment analysis 2020 - 2024

Historic Market Size - Type Segment 2020 - 2024 ($ million)

5.3 Application segment analysis 2020 - 2024

Historic Market Size - Application Segment 2020 - 2024 ($ million)

5.4 Material segment analysis 2020 - 2024

Historic Market Size - Material Segment 2020 - 2024 ($ million)

5.5 Geography segment analysis 2020 - 2024

Historic Market Size - Geography Segment 2020 - 2024 ($ million)

5.6 Country segment analysis 2020 - 2024

Historic Market Size - Country Segment 2020 - 2024 ($ million)

6. Qualitative Analysis

6.1 Impact of AI on Global Banknote Market

7. Five Forces Analysis

7.1 Five forces summary

Five forces analysis - Comparison between 2025 and 2030

7.2 Bargaining power of buyers

Bargaining power of buyers - Impact of key factors 2025 and 2030

7.3 Bargaining power of suppliers

Bargaining power of suppliers - Impact of key factors in 2025 and 2030

7.4 Threat of new entrants

Threat of new entrants - Impact of key factors in 2025 and 2030

7.5 Threat of substitutes

Threat of substitutes - Impact of key factors in 2025 and 2030

7.6 Threat of rivalry

Threat of rivalry - Impact of key factors in 2025 and 2030

7.7 Market condition

Chart on Market condition - Five forces 2025 and 2030

8. Market Segmentation by Type

8.1 Market segments

Chart on Type - Market share 2025-2030 (%)
Data Table on Type - Market share 2025-2030 (%)

8.2 Comparison by Type

Chart on Comparison by Type
Data Table on Comparison by Type

8.3 State-owned - Market size and forecast 2025-2030

Chart on State-owned - Market size and forecast 2025-2030 ($ million)
Data Table on State-owned - Market size and forecast 2025-2030 ($ million)
Chart on State-owned - Year-over-year growth 2025-2030 (%)
Data Table on State-owned - Year-over-year growth 2025-2030 (%)

8.4 Commercial - Market size and forecast 2025-2030

Chart on Commercial - Market size and forecast 2025-2030 ($ million)
Data Table on Commercial - Market size and forecast 2025-2030 ($ million)
Chart on Commercial - Year-over-year growth 2025-2030 (%)
Data Table on Commercial - Year-over-year growth 2025-2030 (%)

8.5 Market opportunity by Type

Market opportunity by Type ($ million)
Data Table on Market opportunity by Type ($ million)

9. Market Segmentation by Application

9.1 Market segments

Chart on Application - Market share 2025-2030 (%)
Data Table on Application - Market share 2025-2030 (%)

9.2 Comparison by Application

Chart on Comparison by Application
Data Table on Comparison by Application

9.3 Intaglio printing - Market size and forecast 2025-2030

Chart on Intaglio printing - Market size and forecast 2025-2030 ($ million)
Data Table on Intaglio printing - Market size and forecast 2025-2030 ($ million)
Chart on Intaglio printing - Year-over-year growth 2025-2030 (%)
Data Table on Intaglio printing - Year-over-year growth 2025-2030 (%)

9.4 Offset printing - Market size and forecast 2025-2030

Chart on Offset printing - Market size and forecast 2025-2030 ($ million)
Data Table on Offset printing - Market size and forecast 2025-2030 ($ million)
Chart on Offset printing - Year-over-year growth 2025-2030 (%)
Data Table on Offset printing - Year-over-year growth 2025-2030 (%)

9.5 Letterpress printing - Market size and forecast 2025-2030

Chart on Letterpress printing - Market size and forecast 2025-2030 ($ million)
Data Table on Letterpress printing - Market size and forecast 2025-2030 ($ million)
Chart on Letterpress printing - Year-over-year growth 2025-2030 (%)
Data Table on Letterpress printing - Year-over-year growth 2025-2030 (%)

9.6 Market opportunity by Application

Market opportunity by Application ($ million)
Data Table on Market opportunity by Application ($ million)

10. Market Segmentation by Material

10.1 Market segments

Chart on Material - Market share 2025-2030 (%)
Data Table on Material - Market share 2025-2030 (%)

10.2 Comparison by Material

Chart on Comparison by Material
Data Table on Comparison by Material

10.3 Paper - Market size and forecast 2025-2030

Chart on Paper - Market size and forecast 2025-2030 ($ million)
Data Table on Paper - Market size and forecast 2025-2030 ($ million)
Chart on Paper - Year-over-year growth 2025-2030 (%)
Data Table on Paper - Year-over-year growth 2025-2030 (%)

10.4 Polymer - Market size and forecast 2025-2030

Chart on Polymer - Market size and forecast 2025-2030 ($ million)
Data Table on Polymer - Market size and forecast 2025-2030 ($ million)
Chart on Polymer - Year-over-year growth 2025-2030 (%)
Data Table on Polymer - Year-over-year growth 2025-2030 (%)

10.5 Hybrid - Market size and forecast 2025-2030

Chart on Hybrid - Market size and forecast 2025-2030 ($ million)
Data Table on Hybrid - Market size and forecast 2025-2030 ($ million)
Chart on Hybrid - Year-over-year growth 2025-2030 (%)
Data Table on Hybrid - Year-over-year growth 2025-2030 (%)

10.6 Market opportunity by Material

Market opportunity by Material ($ million)
Data Table on Market opportunity by Material ($ million)

11. Customer Landscape

11.1 Customer landscape overview

Analysis of price sensitivity, lifecycle, customer purchase basket, adoption rates, and purchase criteria

12. Geographic Landscape

12.1 Geographic segmentation

Chart on Market share by geography 2025-2030 (%)
Data Table on Market share by geography 2025-2030 (%)

12.2 Geographic comparison

Chart on Geographic comparison
Data Table on Geographic comparison

12.3 APAC - Market size and forecast 2025-2030

Chart on APAC - Market size and forecast 2025-2030 ($ million)
Data Table on APAC - Market size and forecast 2025-2030 ($ million)
Chart on APAC - Year-over-year growth 2025-2030 (%)
Data Table on APAC - Year-over-year growth 2025-2030 (%)
Chart on Regional Comparison - APAC
Data Table on Regional Comparison - APAC

12.3.1 China - Market size and forecast 2025-2030

Chart on China - Market size and forecast 2025-2030 ($ million)
Data Table on China - Market size and forecast 2025-2030 ($ million)
Chart on China - Year-over-year growth 2025-2030 (%)
Data Table on China - Year-over-year growth 2025-2030 (%)

12.3.2 India - Market size and forecast 2025-2030

Chart on India - Market size and forecast 2025-2030 ($ million)
Data Table on India - Market size and forecast 2025-2030 ($ million)
Chart on India - Year-over-year growth 2025-2030 (%)
Data Table on India - Year-over-year growth 2025-2030 (%)

12.3.3 Japan - Market size and forecast 2025-2030

Chart on Japan - Market size and forecast 2025-2030 ($ million)
Data Table on Japan - Market size and forecast 2025-2030 ($ million)
Chart on Japan - Year-over-year growth 2025-2030 (%)
Data Table on Japan - Year-over-year growth 2025-2030 (%)

12.3.4 South Korea - Market size and forecast 2025-2030

Chart on South Korea - Market size and forecast 2025-2030 ($ million)
Data Table on South Korea - Market size and forecast 2025-2030 ($ million)
Chart on South Korea - Year-over-year growth 2025-2030 (%)
Data Table on South Korea - Year-over-year growth 2025-2030 (%)

12.3.5 Australia - Market size and forecast 2025-2030

Chart on Australia - Market size and forecast 2025-2030 ($ million)
Data Table on Australia - Market size and forecast 2025-2030 ($ million)
Chart on Australia - Year-over-year growth 2025-2030 (%)
Data Table on Australia - Year-over-year growth 2025-2030 (%)

12.3.6 Indonesia - Market size and forecast 2025-2030

Chart on Indonesia - Market size and forecast 2025-2030 ($ million)
Data Table on Indonesia - Market size and forecast 2025-2030 ($ million)
Chart on Indonesia - Year-over-year growth 2025-2030 (%)
Data Table on Indonesia - Year-over-year growth 2025-2030 (%)

12.4 Middle East and Africa - Market size and forecast 2025-2030

Chart on Middle East and Africa - Market size and forecast 2025-2030 ($ million)
Data Table on Middle East and Africa - Market size and forecast 2025-2030 ($ million)
Chart on Middle East and Africa - Year-over-year growth 2025-2030 (%)
Data Table on Middle East and Africa - Year-over-year growth 2025-2030 (%)
Chart on Regional Comparison - Middle East and Africa
Data Table on Regional Comparison - Middle East and Africa

12.4.1 South Africa - Market size and forecast 2025-2030

Chart on South Africa - Market size and forecast 2025-2030 ($ million)
Data Table on South Africa - Market size and forecast 2025-2030 ($ million)
Chart on South Africa - Year-over-year growth 2025-2030 (%)
Data Table on South Africa - Year-over-year growth 2025-2030 (%)

12.4.2 Saudi Arabia - Market size and forecast 2025-2030

Chart on Saudi Arabia - Market size and forecast 2025-2030 ($ million)
Data Table on Saudi Arabia - Market size and forecast 2025-2030 ($ million)
Chart on Saudi Arabia - Year-over-year growth 2025-2030 (%)
Data Table on Saudi Arabia - Year-over-year growth 2025-2030 (%)

12.4.3 Egypt - Market size and forecast 2025-2030

Chart on Egypt - Market size and forecast 2025-2030 ($ million)
Data Table on Egypt - Market size and forecast 2025-2030 ($ million)
Chart on Egypt - Year-over-year growth 2025-2030 (%)
Data Table on Egypt - Year-over-year growth 2025-2030 (%)

12.4.4 UAE - Market size and forecast 2025-2030

Chart on UAE - Market size and forecast 2025-2030 ($ million)
Data Table on UAE - Market size and forecast 2025-2030 ($ million)
Chart on UAE - Year-over-year growth 2025-2030 (%)
Data Table on UAE - Year-over-year growth 2025-2030 (%)

12.4.5 Nigeria - Market size and forecast 2025-2030

Chart on Nigeria - Market size and forecast 2025-2030 ($ million)
Data Table on Nigeria - Market size and forecast 2025-2030 ($ million)
Chart on Nigeria - Year-over-year growth 2025-2030 (%)
Data Table on Nigeria - Year-over-year growth 2025-2030 (%)

12.5 South America - Market size and forecast 2025-2030

Chart on South America - Market size and forecast 2025-2030 ($ million)
Data Table on South America - Market size and forecast 2025-2030 ($ million)
Chart on South America - Year-over-year growth 2025-2030 (%)
Data Table on South America - Year-over-year growth 2025-2030 (%)
Chart on Regional Comparison - South America
Data Table on Regional Comparison - South America

12.5.1 Brazil - Market size and forecast 2025-2030

Chart on Brazil - Market size and forecast 2025-2030 ($ million)
Data Table on Brazil - Market size and forecast 2025-2030 ($ million)
Chart on Brazil - Year-over-year growth 2025-2030 (%)
Data Table on Brazil - Year-over-year growth 2025-2030 (%)

12.5.2 Argentina - Market size and forecast 2025-2030

Chart on Argentina - Market size and forecast 2025-2030 ($ million)
Data Table on Argentina - Market size and forecast 2025-2030 ($ million)
Chart on Argentina - Year-over-year growth 2025-2030 (%)
Data Table on Argentina - Year-over-year growth 2025-2030 (%)

12.5.3 Colombia - Market size and forecast 2025-2030

Chart on Colombia - Market size and forecast 2025-2030 ($ million)
Data Table on Colombia - Market size and forecast 2025-2030 ($ million)
Chart on Colombia - Year-over-year growth 2025-2030 (%)
Data Table on Colombia - Year-over-year growth 2025-2030 (%)

12.6 North America - Market size and forecast 2025-2030

Chart on North America - Market size and forecast 2025-2030 ($ million)
Data Table on North America - Market size and forecast 2025-2030 ($ million)
Chart on North America - Year-over-year growth 2025-2030 (%)
Data Table on North America - Year-over-year growth 2025-2030 (%)
Chart on Regional Comparison - North America
Data Table on Regional Comparison - North America

12.6.1 US - Market size and forecast 2025-2030

Chart on US - Market size and forecast 2025-2030 ($ million)
Data Table on US - Market size and forecast 2025-2030 ($ million)
Chart on US - Year-over-year growth 2025-2030 (%)
Data Table on US - Year-over-year growth 2025-2030 (%)

12.6.2 Canada - Market size and forecast 2025-2030

Chart on Canada - Market size and forecast 2025-2030 ($ million)
Data Table on Canada - Market size and forecast 2025-2030 ($ million)
Chart on Canada - Year-over-year growth 2025-2030 (%)
Data Table on Canada - Year-over-year growth 2025-2030 (%)

12.6.3 Mexico - Market size and forecast 2025-2030

Chart on Mexico - Market size and forecast 2025-2030 ($ million)
Data Table on Mexico - Market size and forecast 2025-2030 ($ million)
Chart on Mexico - Year-over-year growth 2025-2030 (%)
Data Table on Mexico - Year-over-year growth 2025-2030 (%)

12.7 Europe - Market size and forecast 2025-2030

Chart on Europe - Market size and forecast 2025-2030 ($ million)
Data Table on Europe - Market size and forecast 2025-2030 ($ million)
Chart on Europe - Year-over-year growth 2025-2030 (%)
Data Table on Europe - Year-over-year growth 2025-2030 (%)
Chart on Regional Comparison - Europe
Data Table on Regional Comparison - Europe

12.7.1 Germany - Market size and forecast 2025-2030

Chart on Germany - Market size and forecast 2025-2030 ($ million)
Data Table on Germany - Market size and forecast 2025-2030 ($ million)
Chart on Germany - Year-over-year growth 2025-2030 (%)
Data Table on Germany - Year-over-year growth 2025-2030 (%)

12.7.2 UK - Market size and forecast 2025-2030

Chart on UK - Market size and forecast 2025-2030 ($ million)
Data Table on UK - Market size and forecast 2025-2030 ($ million)
Chart on UK - Year-over-year growth 2025-2030 (%)
Data Table on UK - Year-over-year growth 2025-2030 (%)

12.7.3 France - Market size and forecast 2025-2030

Chart on France - Market size and forecast 2025-2030 ($ million)
Data Table on France - Market size and forecast 2025-2030 ($ million)
Chart on France - Year-over-year growth 2025-2030 (%)
Data Table on France - Year-over-year growth 2025-2030 (%)

12.7.4 Italy - Market size and forecast 2025-2030

Chart on Italy - Market size and forecast 2025-2030 ($ million)
Data Table on Italy - Market size and forecast 2025-2030 ($ million)
Chart on Italy - Year-over-year growth 2025-2030 (%)
Data Table on Italy - Year-over-year growth 2025-2030 (%)

12.7.5 Spain - Market size and forecast 2025-2030

Chart on Spain - Market size and forecast 2025-2030 ($ million)
Data Table on Spain - Market size and forecast 2025-2030 ($ million)
Chart on Spain - Year-over-year growth 2025-2030 (%)
Data Table on Spain - Year-over-year growth 2025-2030 (%)

12.7.6 The Netherlands - Market size and forecast 2025-2030

Chart on The Netherlands - Market size and forecast 2025-2030 ($ million)
Data Table on The Netherlands - Market size and forecast 2025-2030 ($ million)
Chart on The Netherlands - Year-over-year growth 2025-2030 (%)
Data Table on The Netherlands - Year-over-year growth 2025-2030 (%)

12.8 Market opportunity by geography

Market opportunity by geography ($ million)
Data Tables on Market opportunity by geography ($ million)

13. Drivers, Challenges, and Opportunity

13.1 Market drivers

Escalating demand for high-security features and counterfeit deterrence
Robust cash utilization in developing economies and financial inclusion initiatives
Strategic modernization of currency management systems and infrastructure

13.2 Market challenges

Accelerated digital transformation and rise of CBDCs
Sustainability mandates and environmental impact of substrate production
Sophistication of counterfeiting technologies and requirement for constant innovation

13.3 Impact of drivers and challenges

Impact of drivers and challenges in 2025 and 2030

13.4 Market opportunities

Advanced holographic integration and micro-optic security
Strategic transition to sustainable and green banknote lifecycles
Cultural inclusivity and modern aesthetic redesign

14. Competitive Landscape

14.1 Overview

14.2

Overview on criticality of inputs and factors of differentiation

14.3 Landscape disruption

Overview on factors of disruption

14.4 Industry risks

Impact of key risks on business

15. Competitive Analysis

15.1 Companies profiled

Companies covered

15.2 Company ranking index

15.3 Market positioning of companies

Matrix on companies position and classification

15.4 Banco de Portugal

Banco de Portugal - Overview
Banco de Portugal - Product / Service
Banco de Portugal - Key offerings
SWOT

15.5 BEP

BEP - Overview
BEP - Product / Service
BEP - Key offerings
SWOT

15.6 Central Engraving and Printing

Central Engraving and Printing - Overview
Central Engraving and Printing - Product / Service
Central Engraving and Printing - Key offerings
SWOT

15.7 China Banknote Group Co. Ltd.

China Banknote Group Co. Ltd. - Overview
China Banknote Group Co. Ltd. - Product / Service
China Banknote Group Co. Ltd. - Key offerings
SWOT

15.8 Crane and Co. Inc.

Crane and Co. Inc. - Overview
Crane and Co. Inc. - Product / Service
Crane and Co. Inc. - Key offerings
SWOT

15.9 De La Rue PLC

De La Rue PLC - Overview
De La Rue PLC - Business segments
De La Rue PLC - Key offerings
De La Rue PLC - Segment focus
SWOT

15.10 FNMT RCM

FNMT RCM - Overview
FNMT RCM - Product / Service
FNMT RCM - Key offerings
SWOT

15.11 Giesecke Devrient GmbH

Giesecke Devrient GmbH - Overview
Giesecke Devrient GmbH - Product / Service
Giesecke Devrient GmbH - Key news
Giesecke Devrient GmbH - Key offerings
SWOT

15.12 Goznak

Goznak - Overview
Goznak - Product / Service
Goznak - Key offerings
SWOT

15.13 Hong Kong Note Printing Ltd.

Hong Kong Note Printing Ltd. - Overview
Hong Kong Note Printing Ltd. - Product / Service
Hong Kong Note Printing Ltd. - Key offerings
SWOT

15.14 National Printing Bureau

National Printing Bureau - Overview
National Printing Bureau - Product / Service
National Printing Bureau - Key offerings
SWOT

15.15 Note Printing Australia Ltd.

Note Printing Australia Ltd. - Overview
Note Printing Australia Ltd. - Product / Service
Note Printing Australia Ltd. - Key offerings
SWOT

15.16 Orell Fussli AG

Orell Fussli AG - Overview
Orell Fussli AG - Business segments
Orell Fussli AG - Key offerings
Orell Fussli AG - Segment focus
SWOT

15.17 Reserve Bank of India

Reserve Bank of India - Overview
Reserve Bank of India - Product / Service
Reserve Bank of India - Key offerings
SWOT

15.18 Security Printing and Minting

Security Printing and Minting - Overview
Security Printing and Minting - Product / Service
Security Printing and Minting - Key offerings
SWOT

16. Appendix

16.1 Scope of the report

Market definition
Objectives
Notes and caveats

16.2 Inclusions and exclusions checklist

Inclusions checklist
Exclusions checklist

16.3 Currency conversion rates for US$

16.4 Research methodology

16.5 Data procurement

Information sources

16.6 Data validation

16.7 Validation techniques employed for market sizing

16.8 Data synthesis

16.9 360 degree market analysis

16.10 List of abbreviations

Research Methodology

Technavio presents a detailed picture of the market by way of study, synthesis, and summation of data from multiple sources. The analysts have presented the various facets of the market with a particular focus on identifying the key industry influencers. The data thus presented is comprehensive, reliable, and the result of extensive research, both primary and secondary.

INFORMATION SOURCES

Primary sources

  • Manufacturers and suppliers
  • Channel partners
  • Industry experts
  • Strategic decision makers

Secondary sources

  • Industry journals and periodicals
  • Government data
  • Financial reports of key industry players
  • Historical data
  • Press releases

DATA ANALYSIS

Data Synthesis

  • Collation of data
  • Estimation of key figures
  • Analysis of derived insights

Data Validation

  • Triangulation with data models
  • Reference against proprietary databases
  • Corroboration with industry experts

REPORT WRITING

Qualitative

  • Market drivers
  • Market challenges
  • Market trends
  • Five forces analysis

Quantitative

  • Market size and forecast
  • Market segmentation
  • Geographical insights
  • Competitive landscape

Interested in this report?

Get your sample now to see our research methodology and insights!

Download Now

Frequently Asked Questions

Banknote market growth will increase by USD 2187.0 million during 2026-2030.

The Banknote market is expected to grow at a CAGR of 4.7% during 2026-2030.

Banknote market is segmented by Type (State-owned, Commercial) Application (Intaglio printing, Offset printing, Letterpress printing) Material (Paper, Polymer, Hybrid)

Banco de Portugal, BEP, BNB Printing House AD, CCL Secure Ltd., Central Engraving and Printing, China Banknote Group Co. Ltd., Crane and Co. Inc., De La Rue PLC, FNMT RCM, Giesecke Devrient GmbH, Goznak, Hong Kong Note Printing Ltd., National Printing Bureau, Note Printing Australia Ltd., Orell Fussli AG, Reserve Bank of India, Security Papers Ltd., Security Printing and Minting, SPS TechnoScreen GmbH, The Security Printing Corp. are a few of the key vendors in the Banknote market.

APAC will register the highest growth rate of 68.1% among the other regions. Therefore, the Banknote market in APAC is expected to garner significant business opportunities for the vendors during the forecast period.

China, India, Japan, South Korea, Australia, Indonesia, South Africa, Saudi Arabia, Egypt, UAE, Nigeria, Brazil, Argentina, Colombia, US, Canada, Mexico, Germany, UK, France, Italy, Spain, The Netherlands

  • Escalating demand for high-security features and counterfeit deterrence is the driving factor this market.

The Banknote market vendors should focus on grabbing business opportunities from the Type segment as it accounted for the largest market share in the base year.