Autotransfusion Systems Market Analysis, Size, and Forecast 2026-2030: North America (US, Canada, and Mexico), Europe (Germany, France, and UK), APAC (China, Japan, and India), South America (Brazil, Argentina, and Colombia), Middle East and Africa (Saudi Arabia, UAE, and Turkey), Asia, Rest of World (ROW)

Autotransfusion Systems Market Analysis, Size, and Forecast 2026-2030:
North America (US, Canada, and Mexico), Europe (Germany, France, and UK), APAC (China, Japan, and India), South America (Brazil, Argentina, and Colombia), Middle East and Africa (Saudi Arabia, UAE, and Turkey), Asia, Rest of World (ROW)

Published: Jan 2026 284 Pages SKU: IRTNTR72604

Market Overview at a Glance

$317.1 Mn
Market Opportunity
4.7%
CAGR 2025 - 2030
42.5%
North America Growth
$1.01 B
Autotransfusion products segment 2024

Autotransfusion Systems Market Size 2026-2030

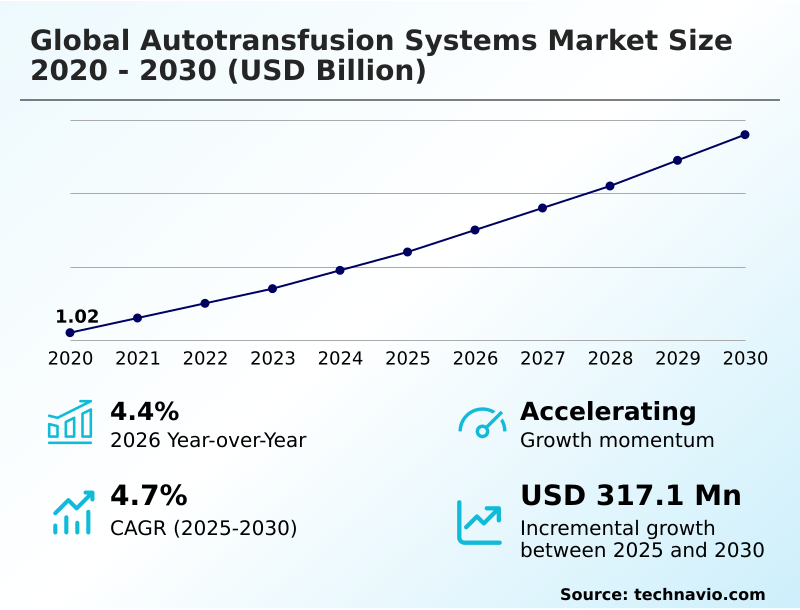
The autotransfusion systems market size is valued to increase by USD 317.1 million, at a CAGR of 4.7% from 2025 to 2030. Increasing volume of surgical procedures and growing geriatric population will drive the autotransfusion systems market.

Major Market Trends & Insights

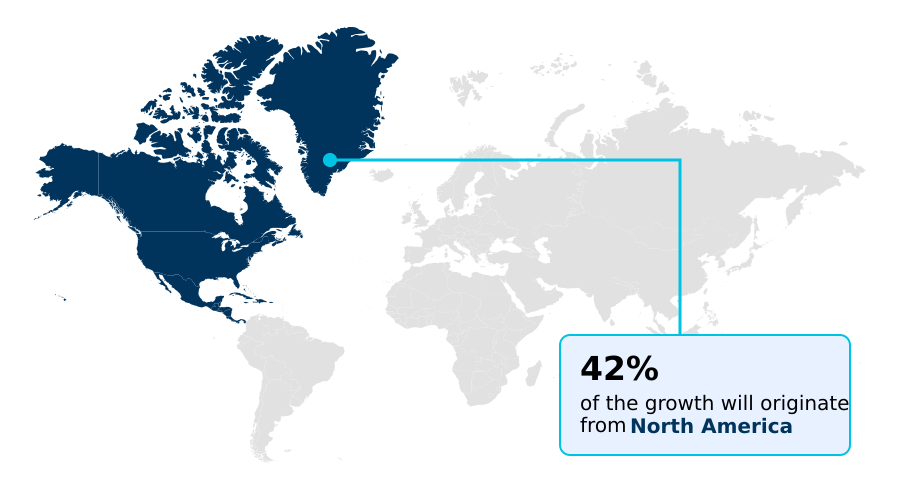
  • North America dominated the market and accounted for a 42.5% growth during the forecast period.
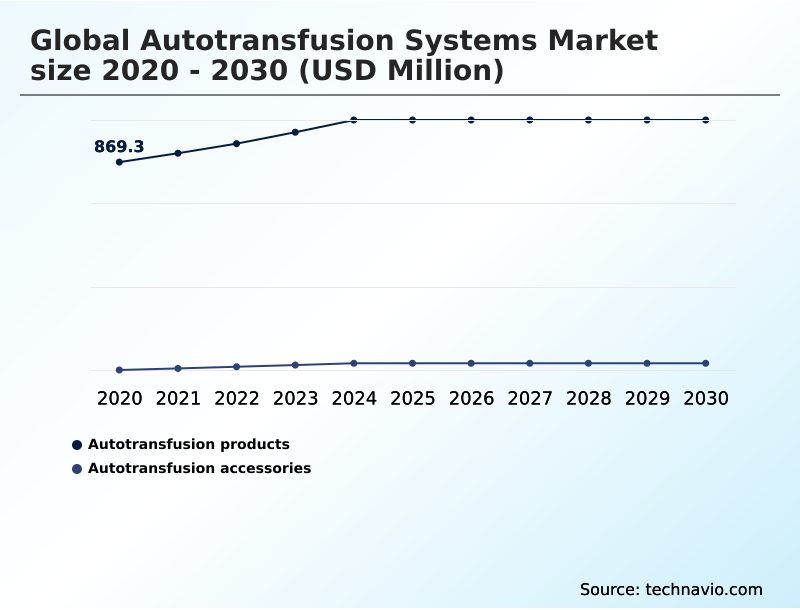
  • By Type - Autotransfusion products segment was valued at USD 1.01 billion in 2024
  • By End-user - Hospitals segment accounted for the largest market revenue share in 2024

Market Size & Forecast

  • Market Opportunities: USD 537.1 million
  • Market Future Opportunities: USD 317.1 million
  • CAGR from 2025 to 2030 : 4.7%

Market Summary

  • The autotransfusion systems market is defined by a strong clinical imperative to enhance patient safety and manage healthcare resources effectively. Growth is propelled by the rising volume of complex surgeries and the widespread adoption of patient blood management programs aimed at minimizing reliance on allogeneic blood transfusions.
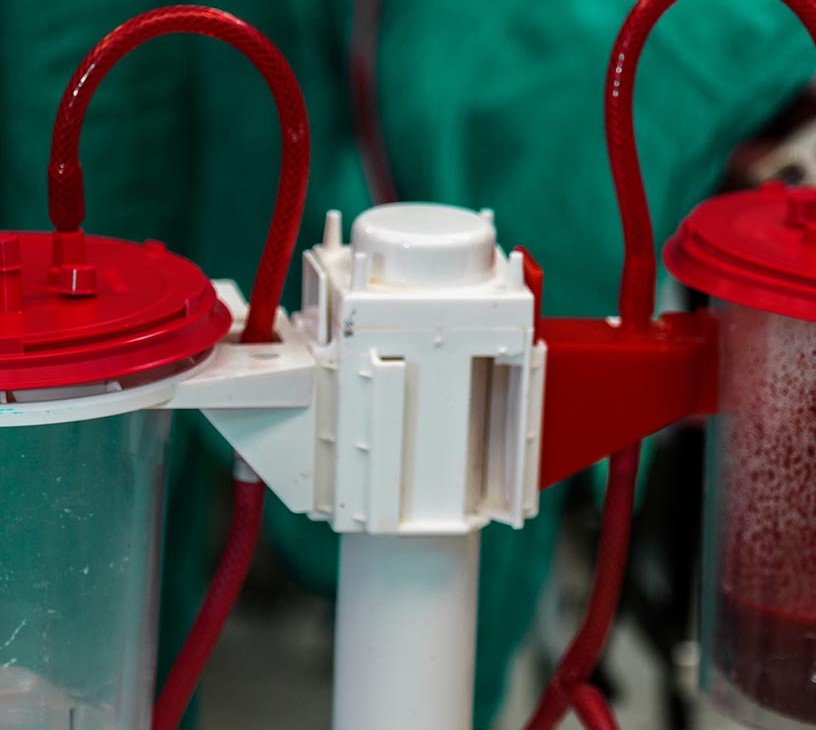
  • These systems, which facilitate intraoperative cell salvage, are critical in specialties like cardiac, orthopedic, and trauma surgery. Technological innovation is a key competitive differentiator, with manufacturers focusing on improving centrifugation efficiency, biocompatibility of disposables, and automation to simplify surgical workflow integration.
  • For instance, a hospital system evaluating this technology might analyze how integrating a system with superior leukocyte depletion can reduce transfusion-related complications, leading to shorter hospital stays and lower overall care costs. This ROI calculation is balanced against the challenge of high capital investment and the recurring cost of single-use disposables.
  • The market is also seeing an expansion into new clinical areas, such as low-blood-loss procedures and obstetrics, further broadening its application and driving deeper penetration into daily surgical practice worldwide, reinforcing the importance of robust blood conservation techniques.

What will be the Size of the Autotransfusion Systems Market during the forecast period?

Get Key Insights on Market Forecast (PDF) Request Free Sample

How is the Autotransfusion Systems Market Segmented?

The autotransfusion systems industry research report provides comprehensive data (region-wise segment analysis), with forecasts and estimates in "USD million" for the period 2026-2030, as well as historical data from 2020-2024 for the following segments.

  • Type
    • Autotransfusion products
    • Autotransfusion accessories
  • End-user
    • Hospitals
    • Clinics
  • Product type
    • Consumables
    • Devices
  • Geography
    • North America
      • US
      • Canada
      • Mexico
    • Europe
      • Germany
      • France
      • UK
    • Asia
    • Rest of World (ROW)

By Type Insights

The autotransfusion products segment is estimated to witness significant growth during the forecast period.

The market is segmented by offerings, including core autotransfusion products and essential accessories. The products segment, comprising cell saver systems, represents the capital investment portion of the market.

Growth is driven by the increasing frequency of complex surgeries and a heightened focus on patient blood management principles. These systems are pivotal in procedures with significant blood loss, such as cardiovascular and orthopedic operations.

Innovation is centered on improving erythrocyte recovery and the efficiency of cell washing. For example, advancements in automated cell processing have demonstrated a 15% improvement in red cell viability.

This focus on technological enhancement, like better contaminant removal and leukocyte depletion, solidifies the segment's role in advancing perioperative care standards and supporting blood conservation techniques.

Request Free Sample

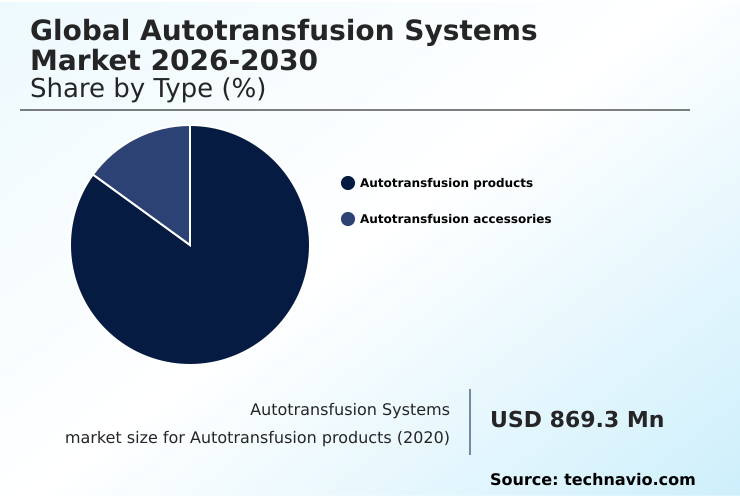
The Autotransfusion products segment was valued at USD 1.01 billion in 2024 and showed a gradual increase during the forecast period.

Request Free Sample

Regional Analysis

North America is estimated to contribute 42.5% to the growth of the global market during the forecast period.Technavio’s analysts have elaborately explained the regional trends and drivers that shape the market during the forecast period.

See How Autotransfusion Systems Market Demand is Rising in North America Request Free Sample

The geographic landscape of the autotransfusion systems market is led by North America, which holds a dominant share of over 42% due to its high volume of complex surgeries and advanced healthcare infrastructure.

This region's maturity is supported by strong patient blood management programs and favorable reimbursement, fostering deep market penetration and continuous innovation in cell salvage technology. Europe follows, with robust adoption in countries like Germany and the UK.

The Asia Pacific region, however, presents the most significant growth opportunity, driven by expanding healthcare access and increasing surgical volumes.

While facing challenges related to cost and awareness, the focus on reducing transfusion-related infections and improving perioperative care standards is accelerating the adoption of blood product alternatives.

This is leading to a greater use of surgical blood reinfusion techniques and hemofiltration.

Market Dynamics

Our researchers analyzed the data with 2025 as the base year, along with the key drivers, trends, and challenges. A holistic analysis of drivers will help companies refine their marketing strategies to gain a competitive advantage.

  • Healthcare institutions undertaking a strategic review of their surgical services are increasingly focused on patient blood management protocols. A key consideration is the economic impact of autotransfusion programs, balancing the initial investment against long-term savings. The cost of autotransfusion disposable kits is a significant factor in this analysis, especially when evaluating its use in both high-risk and low-blood-loss procedures.
  • For example, in spinal fusion surgery, the benefits of intraoperative cell salvage are well-established. When comparing autotransfusion versus allogeneic transfusion, the discussion often centers on the pronounced risks of allogeneic blood transfusion, which can lead to complications that are over 50% more costly to manage than the price of a single disposable kit.
  • This makes the use of autotransfusion systems for trauma surgery a clear clinical and financial decision. The quality control in autotransfusion is paramount, with a focus on leukocyte depletion filter efficiency to mitigate inflammatory responses. As applications expand, even the role of autotransfusion use in oncology and transplant surgery is being re-evaluated.
  • Proper training for autotransfusion system operators ensures adherence to protocols and addresses any contraindications for autotransfusion use, maximizing the benefits of this technology in diverse settings like orthopedic surgery and pediatric autotransfusion system design.

What are the key market drivers leading to the rise in the adoption of Autotransfusion Systems Industry?

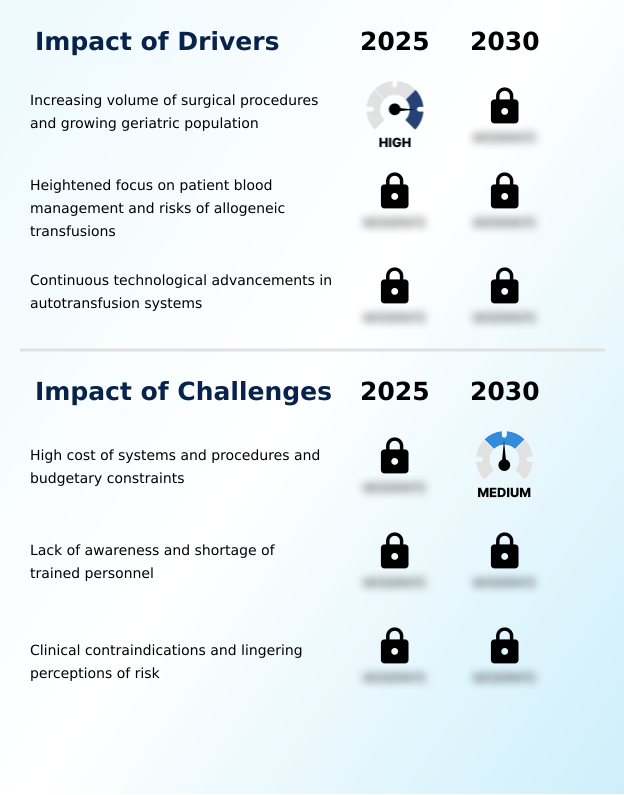
  • The increasing volume of surgical procedures worldwide, coupled with a growing geriatric population requiring more interventions, serves as a primary driver for the market.

  • The market is fundamentally driven by the rising volume of surgical procedures, particularly high-blood-loss surgeries in an aging population.
  • With cardiovascular surgery applications and major orthopedic procedures increasing by over 5% annually in many developed nations, the demand for effective blood conservation is intensifying.
  • For the geriatric demographic, which now accounts for over 40% of complex surgical cases, minimizing the risks tied to allogeneic transfusions is a clinical imperative.
  • Autotransfusion provides a critical solution, offering a safer alternative that supports better outcomes in trauma patient management and oncological resection support.
  • This demographic and procedural growth creates a sustained demand for systems that facilitate reliable postoperative blood salvage and surgical blood reinfusion, making it a cornerstone of modern surgical practice and transplant surgery blood conservation.

What are the market trends shaping the Autotransfusion Systems Industry?

  • A key market trend involves the expansion of clinical applications for autotransfusion systems beyond high-blood-loss procedures. This includes their strategic adoption in surgeries with low to moderate anticipated blood loss.

  • A significant trend shaping the market is the expansion of autotransfusion into surgeries with lower anticipated blood loss, driven by a proactive approach to blood conservation. Historically reserved for high-risk cases, cell salvage device use is now growing in routine procedures.
  • This shift is enabled by systems designed for smaller volumes, where advanced centrifugation can efficiently process salvaged blood, increasing yield by up to 20% compared to older models. This makes autologous transfusion viable for outpatient orthopedic surgeries, where avoiding even a single unit of donor blood can prevent costly transfusion-associated complications.
  • This trend, promoting bloodless surgery techniques, aligns with the goals of pediatric cell salvage and obstetrics hemorrhage management, significantly broadening the technology's application and market potential with better perioperative anemia correction.

What challenges does the Autotransfusion Systems Industry face during its growth?

  • The high capital cost of autotransfusion systems and associated procedural expenses, combined with hospital budgetary constraints, presents a significant challenge to market growth.

  • A primary market challenge is the significant financial barrier posed by the high cost of equipment and single-use disposables. For many hospitals, the capital outlay for a new autotransfusion system can consume up to 10% of the annual equipment budget, while recurring costs for disposable collection reservoirs and sterile processing kits impact operational spending.
  • This economic pressure is compounded by inconsistent reimbursement models, which may only cover 70% of the total procedural cost, creating a financial disincentive for broader adoption.
  • This reality often limits the use of shed blood processing and cardiotomy suction to only the most critical cases, hindering the technology's potential to become a universal standard of care and complicating surgical team training and cost-benefit analysis.

Exclusive Technavio Analysis on Customer Landscape

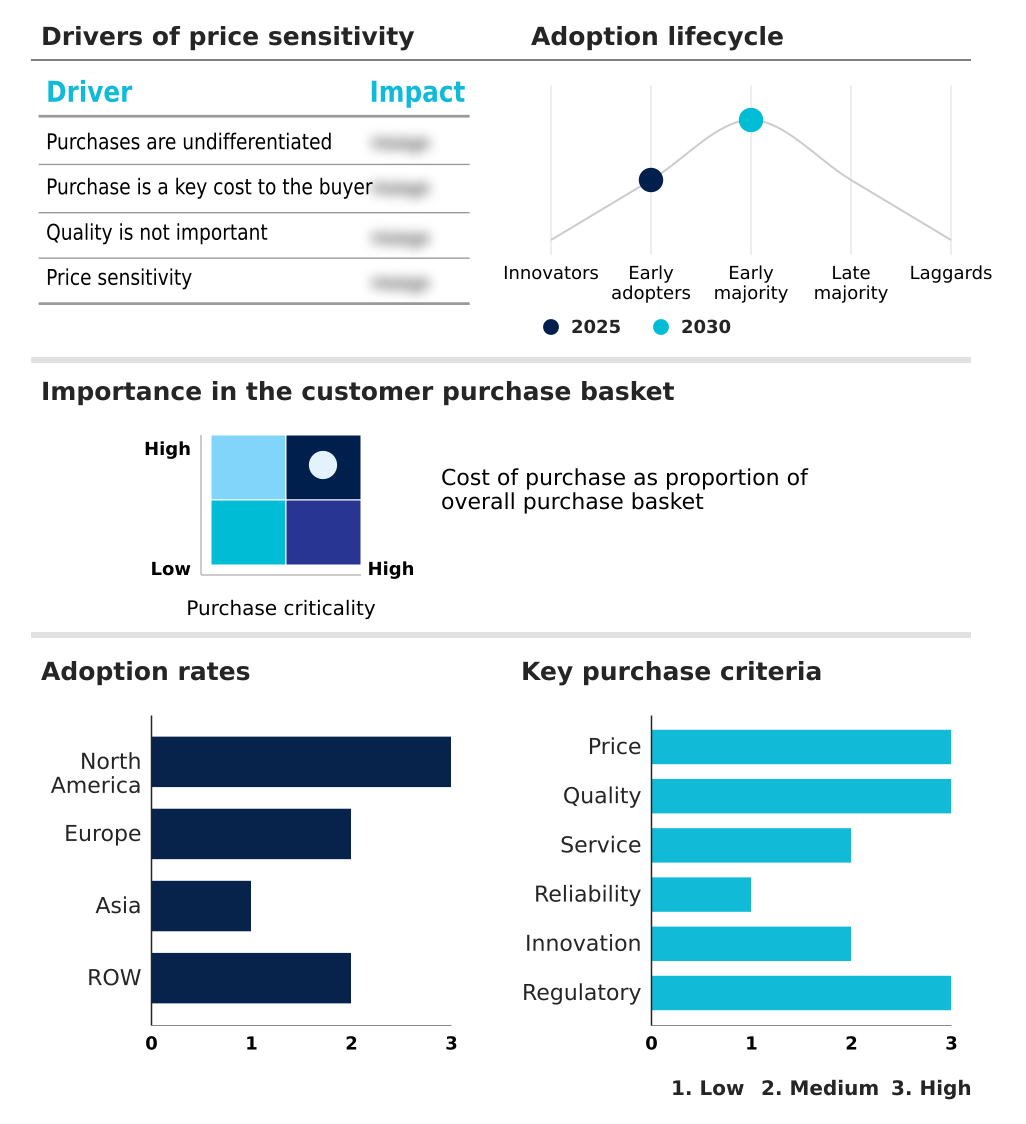
The autotransfusion systems market forecasting report includes the adoption lifecycle of the market, covering from the innovator’s stage to the laggard’s stage. It focuses on adoption rates in different regions based on penetration. Furthermore, the autotransfusion systems market report also includes key purchase criteria and drivers of price sensitivity to help companies evaluate and develop their market growth analysis strategies.

Customer Landscape of Autotransfusion Systems Industry

Competitive Landscape

Companies are implementing various strategies, such as strategic alliances, autotransfusion systems market forecast, partnerships, mergers and acquisitions, geographical expansion, and product/service launches, to enhance their presence in the industry.

Becton Dickinson and Co. - Analyzes continuous-flow devices designed for intraoperative and postoperative red blood cell separation, washing, and packing, enhancing autologous blood recovery and patient safety.

The industry research and growth report includes detailed analyses of the competitive landscape of the market and information about key companies, including:

  • Becton Dickinson and Co.
  • Beijing ZKSK Technology
  • Braile Biomedica
  • Fresenius Kabi AG
  • Gen World Medical Devices
  • Haemonetics Corp.
  • i‑SEP
  • LivaNova PLC
  • Macopharma SA
  • Medtronic Plc
  • Nipro Corp.
  • Redax S.p.A.
  • SARSTEDT AG and Co. KG
  • Stryker Corp.
  • Teleflex Inc.
  • Terumo Corp.
  • Zimmer Biomet Holdings Inc.

Qualitative and quantitative analysis of companies has been conducted to help clients understand the wider business environment as well as the strengths and weaknesses of key industry players. Data is qualitatively analyzed to categorize companies as pure play, category-focused, industry-focused, and diversified; it is quantitatively analyzed to categorize companies as dominant, leading, strong, tentative, and weak.

Recent Development and News in Autotransfusion systems market

  • In November 2024, Fresenius Kabi AG announced a strategic partnership with a leading GPO to supply its CATSmart autotransfusion systems, aiming to expand access in mid-sized hospitals and ambulatory surgery centers.
  • In January 2025, LivaNova PLC received CE Mark approval for its next-generation Xtra+ Autotransfusion System, featuring enhanced platelet recovery protocols and advanced data management for complex cardiac surgeries.
  • In March 2025, UnitedHealth Group and Anthem jointly announced a new value-based care initiative rewarding ambulatory surgical centers that use intraoperative cell salvage for orthopedic surgeries, aiming to reduce post-surgical complications.
  • In April 2025, Medtronic plc launched its new Auto-Intel series of autotransfusion systems, which integrate advanced sensor technology to provide real-time feedback on blood processing, maximizing red blood cell recovery.

Dive into Technavio’s robust research methodology, blending expert interviews, extensive data synthesis, and validated models for unparalleled Autotransfusion Systems Market insights. See full methodology.

Market Scope
Page number 284
Base year 2025
Historic period 2020-2024
Forecast period 2026-2030
Growth momentum & CAGR Accelerate at a CAGR of 4.7%
Market growth 2026-2030 USD 317.1 million
Market structure Fragmented
YoY growth 2025-2026(%) 4.4%
Key countries US, Canada, Mexico, Germany, France, UK, Italy, Spain, The Netherlands, China, Japan, India, South Korea, Indonesia, Thailand, Brazil, Saudi Arabia, UAE, Turkey, South Africa, Argentina, Colombia and Israel
Competitive landscape Leading Companies, Market Positioning of Companies, Competitive Strategies, and Industry Risks

Request Free Sample

Research Analyst Overview

  • The autotransfusion systems market is evolving beyond being a niche technology for high-blood-loss surgeries into a cornerstone of modern perioperative blood management. Boardroom decisions are increasingly influenced by the dual benefits of improved patient outcomes and resource optimization.
  • The adoption of systems featuring advanced cell salvage technology, such as tangential flow filtration and automated cell processing for erythrocyte recovery, is now a strategic priority. This shift is driven by a focus on mitigating the clinical and financial risks associated with allogeneic blood transfusion.
  • For example, facilities using systems with superior hemolysis control and biocompatibility in their sterile disposable kits report a notable reduction in post-operative recovery times. Effective anticoagulation and plasma sequestration protocols are integral to maximizing the quality of red cell concentrate.
  • The technology's value is further proven in its ability to manage blood conservation during complex procedures, from cardiotomy suction in cardiac cases to surgical site aspiration in orthopedics. Innovations in microaggregate filtration and reinfusion line filters are enhancing the safety profile, making autologous blood recovery a more reliable standard of care for packed red blood cells.

What are the Key Data Covered in this Autotransfusion Systems Market Research and Growth Report?

  • What is the expected growth of the Autotransfusion Systems Market between 2026 and 2030?

    • USD 317.1 million, at a CAGR of 4.7%

  • What segmentation does the market report cover?

    • The report is segmented by Type (Autotransfusion products, and Autotransfusion accessories), End-user (Hospitals, and Clinics), Product Type (Consumables, and Devices) and Geography (North America, Europe, Asia, Rest of World (ROW))

  • Which regions are analyzed in the report?

    • North America, Europe, Asia and Rest of World (ROW)

  • What are the key growth drivers and market challenges?

    • Increasing volume of surgical procedures and growing geriatric population, High cost of systems and procedures and budgetary constraints

  • Who are the major players in the Autotransfusion Systems Market?

    • Becton Dickinson and Co., Beijing ZKSK Technology, Braile Biomedica, Fresenius Kabi AG, Gen World Medical Devices, Haemonetics Corp., i‑SEP, LivaNova PLC, Macopharma SA, Medtronic Plc, Nipro Corp., Redax S.p.A., SARSTEDT AG and Co. KG, Stryker Corp., Teleflex Inc., Terumo Corp. and Zimmer Biomet Holdings Inc.

Market Research Insights

  • The market's dynamics are shaped by a strong focus on clinical outcomes and operational efficiency through advanced perioperative blood management. The shift toward value-based care initiatives is a significant factor, with some hospital networks reporting a 25% reduction in allogeneic transfusions after implementing comprehensive blood management programs.
  • The adoption of cell salvage technology is central to this trend, as it directly mitigates the risks of transfusion-associated complications. Advanced systems featuring continuous autotransfusion capabilities offer up to a 15% improvement in processing speed, enhancing surgical workflow integration and operating room throughput.
  • This efficiency, combined with the clear benefits of autologous transfusion, strengthens the cost-benefit analysis for healthcare providers, driving broader adoption despite initial capital costs and ongoing expenses for single-use disposables.

We can help! Our analysts can customize this autotransfusion systems market research report to meet your requirements.

Get in touch

1. Executive Summary

1.1 Market overview

Executive Summary - Chart on Market Overview
Executive Summary - Data Table on Market Overview
Executive Summary - Chart on Global Market Characteristics
Executive Summary - Chart on Market by Geography
Executive Summary - Chart on Market Segmentation by Type
Executive Summary - Chart on Market Segmentation by End-user
Executive Summary - Chart on Market Segmentation by Product Type
Executive Summary - Chart on Incremental Growth
Executive Summary - Data Table on Incremental Growth
Executive Summary - Chart on Company Market Positioning

2. Technavio Analysis

2.1 Analysis of price sensitivity, lifecycle, customer purchase basket, adoption rates, and purchase criteria

2.2 Criticality of inputs and Factors of differentiation

Chart on Overview on criticality of inputs and factors of differentiation

2.3 Factors of disruption

Chart on Overview on factors of disruption

2.4 Impact of drivers and challenges

Chart on Impact of drivers and challenges in 2025 and 2030

3. Market Landscape

3.1 Market ecosystem

Chart on Parent Market
Data Table on - Parent Market

3.2 Market characteristics

Chart on Market characteristics analysis

3.3 Value chain analysis

Chart on Value chain analysis

4. Market Sizing

4.1 Market definition

Data Table on Offerings of companies included in the market definition

4.2 Market segment analysis

Market segments

4.3 Market size 2025

4.4 Market outlook: Forecast for 2025-2030

Chart on Global - Market size and forecast 2025-2030 ($ million)
Data Table on Global - Market size and forecast 2025-2030 ($ million)
Chart on Global Market: Year-over-year growth 2025-2030 (%)
Data Table on Global Market: Year-over-year growth 2025-2030 (%)

5. Historic Market Size

5.1 Global Autotransfusion Systems Market 2020 - 2024

Historic Market Size - Data Table on Global Autotransfusion Systems Market 2020 - 2024 ($ million)

5.2 Type segment analysis 2020 - 2024

Historic Market Size - Type Segment 2020 - 2024 ($ million)

5.3 End-user segment analysis 2020 - 2024

Historic Market Size - End-user Segment 2020 - 2024 ($ million)

5.4 Product Type segment analysis 2020 - 2024

Historic Market Size - Product Type Segment 2020 - 2024 ($ million)

5.5 Geography segment analysis 2020 - 2024

Historic Market Size - Geography Segment 2020 - 2024 ($ million)

5.6 Country segment analysis 2020 - 2024

Historic Market Size - Country Segment 2020 - 2024 ($ million)

6. Qualitative Analysis

6.1 The AI impact on global autotransfusion systems market

7. Five Forces Analysis

7.1 Five forces summary

Five forces analysis - Comparison between 2025 and 2030

7.2 Bargaining power of buyers

Bargaining power of buyers - Impact of key factors 2025 and 2030

7.3 Bargaining power of suppliers

Bargaining power of suppliers - Impact of key factors in 2025 and 2030

7.4 Threat of new entrants

Threat of new entrants - Impact of key factors in 2025 and 2030

7.5 Threat of substitutes

Threat of substitutes - Impact of key factors in 2025 and 2030

7.6 Threat of rivalry

Threat of rivalry - Impact of key factors in 2025 and 2030

7.7 Market condition

Chart on Market condition - Five forces 2025 and 2030

8. Market Segmentation by Type

8.1 Market segments

Chart on Type - Market share 2025-2030 (%)
Data Table on Type - Market share 2025-2030 (%)

8.2 Comparison by Type

Chart on Comparison by Type
Data Table on Comparison by Type

8.3 Autotransfusion products - Market size and forecast 2025-2030

Chart on Autotransfusion products - Market size and forecast 2025-2030 ($ million)
Data Table on Autotransfusion products - Market size and forecast 2025-2030 ($ million)
Chart on Autotransfusion products - Year-over-year growth 2025-2030 (%)
Data Table on Autotransfusion products - Year-over-year growth 2025-2030 (%)

8.4 Autotransfusion accessories - Market size and forecast 2025-2030

Chart on Autotransfusion accessories - Market size and forecast 2025-2030 ($ million)
Data Table on Autotransfusion accessories - Market size and forecast 2025-2030 ($ million)
Chart on Autotransfusion accessories - Year-over-year growth 2025-2030 (%)
Data Table on Autotransfusion accessories - Year-over-year growth 2025-2030 (%)

8.5 Market opportunity by Type

Market opportunity by Type ($ million)
Data Table on Market opportunity by Type ($ million)

9. Market Segmentation by End-user

9.1 Market segments

Chart on End-user - Market share 2025-2030 (%)
Data Table on End-user - Market share 2025-2030 (%)

9.2 Comparison by End-user

Chart on Comparison by End-user
Data Table on Comparison by End-user

9.3 Hospitals - Market size and forecast 2025-2030

Chart on Hospitals - Market size and forecast 2025-2030 ($ million)
Data Table on Hospitals - Market size and forecast 2025-2030 ($ million)
Chart on Hospitals - Year-over-year growth 2025-2030 (%)
Data Table on Hospitals - Year-over-year growth 2025-2030 (%)

9.4 Clinics - Market size and forecast 2025-2030

Chart on Clinics - Market size and forecast 2025-2030 ($ million)
Data Table on Clinics - Market size and forecast 2025-2030 ($ million)
Chart on Clinics - Year-over-year growth 2025-2030 (%)
Data Table on Clinics - Year-over-year growth 2025-2030 (%)

9.5 Market opportunity by End-user

Market opportunity by End-user ($ million)
Data Table on Market opportunity by End-user ($ million)

10. Market Segmentation by Product Type

10.1 Market segments

Chart on Product Type - Market share 2025-2030 (%)
Data Table on Product Type - Market share 2025-2030 (%)

10.2 Comparison by Product Type

Chart on Comparison by Product Type
Data Table on Comparison by Product Type

10.3 Consumables - Market size and forecast 2025-2030

Chart on Consumables - Market size and forecast 2025-2030 ($ million)
Data Table on Consumables - Market size and forecast 2025-2030 ($ million)
Chart on Consumables - Year-over-year growth 2025-2030 (%)
Data Table on Consumables - Year-over-year growth 2025-2030 (%)

10.4 Devices - Market size and forecast 2025-2030

Chart on Devices - Market size and forecast 2025-2030 ($ million)
Data Table on Devices - Market size and forecast 2025-2030 ($ million)
Chart on Devices - Year-over-year growth 2025-2030 (%)
Data Table on Devices - Year-over-year growth 2025-2030 (%)

10.5 Market opportunity by Product Type

Market opportunity by Product Type ($ million)
Data Table on Market opportunity by Product Type ($ million)

11. Customer Landscape

11.1 Customer landscape overview

Analysis of price sensitivity, lifecycle, customer purchase basket, adoption rates, and purchase criteria

12. Geographic Landscape

12.1 Geographic segmentation

Chart on Market share by geography 2025-2030 (%)
Data Table on Market share by geography 2025-2030 (%)

12.2 Geographic comparison

Chart on Geographic comparison
Data Table on Geographic comparison

12.3 North America - Market size and forecast 2025-2030

Chart on North America - Market size and forecast 2025-2030 ($ million)
Data Table on North America - Market size and forecast 2025-2030 ($ million)
Chart on North America - Year-over-year growth 2025-2030 (%)
Data Table on North America - Year-over-year growth 2025-2030 (%)
Chart on Regional Comparison - North America
Data Table on Regional Comparison - North America

12.3.1 US - Market size and forecast 2025-2030

Chart on US - Market size and forecast 2025-2030 ($ million)
Data Table on US - Market size and forecast 2025-2030 ($ million)
Chart on US - Year-over-year growth 2025-2030 (%)
Data Table on US - Year-over-year growth 2025-2030 (%)

12.3.2 Canada - Market size and forecast 2025-2030

Chart on Canada - Market size and forecast 2025-2030 ($ million)
Data Table on Canada - Market size and forecast 2025-2030 ($ million)
Chart on Canada - Year-over-year growth 2025-2030 (%)
Data Table on Canada - Year-over-year growth 2025-2030 (%)

12.3.3 Mexico - Market size and forecast 2025-2030

Chart on Mexico - Market size and forecast 2025-2030 ($ million)
Data Table on Mexico - Market size and forecast 2025-2030 ($ million)
Chart on Mexico - Year-over-year growth 2025-2030 (%)
Data Table on Mexico - Year-over-year growth 2025-2030 (%)

12.4 Europe - Market size and forecast 2025-2030

Chart on Europe - Market size and forecast 2025-2030 ($ million)
Data Table on Europe - Market size and forecast 2025-2030 ($ million)
Chart on Europe - Year-over-year growth 2025-2030 (%)
Data Table on Europe - Year-over-year growth 2025-2030 (%)
Chart on Regional Comparison - Europe
Data Table on Regional Comparison - Europe

12.4.1 Germany - Market size and forecast 2025-2030

Chart on Germany - Market size and forecast 2025-2030 ($ million)
Data Table on Germany - Market size and forecast 2025-2030 ($ million)
Chart on Germany - Year-over-year growth 2025-2030 (%)
Data Table on Germany - Year-over-year growth 2025-2030 (%)

12.4.2 France - Market size and forecast 2025-2030

Chart on France - Market size and forecast 2025-2030 ($ million)
Data Table on France - Market size and forecast 2025-2030 ($ million)
Chart on France - Year-over-year growth 2025-2030 (%)
Data Table on France - Year-over-year growth 2025-2030 (%)

12.4.3 UK - Market size and forecast 2025-2030

Chart on UK - Market size and forecast 2025-2030 ($ million)
Data Table on UK - Market size and forecast 2025-2030 ($ million)
Chart on UK - Year-over-year growth 2025-2030 (%)
Data Table on UK - Year-over-year growth 2025-2030 (%)

12.4.4 Italy - Market size and forecast 2025-2030

Chart on Italy - Market size and forecast 2025-2030 ($ million)
Data Table on Italy - Market size and forecast 2025-2030 ($ million)
Chart on Italy - Year-over-year growth 2025-2030 (%)
Data Table on Italy - Year-over-year growth 2025-2030 (%)

12.4.5 Spain - Market size and forecast 2025-2030

Chart on Spain - Market size and forecast 2025-2030 ($ million)
Data Table on Spain - Market size and forecast 2025-2030 ($ million)
Chart on Spain - Year-over-year growth 2025-2030 (%)
Data Table on Spain - Year-over-year growth 2025-2030 (%)

12.4.6 The Netherlands - Market size and forecast 2025-2030

Chart on The Netherlands - Market size and forecast 2025-2030 ($ million)
Data Table on The Netherlands - Market size and forecast 2025-2030 ($ million)
Chart on The Netherlands - Year-over-year growth 2025-2030 (%)
Data Table on The Netherlands - Year-over-year growth 2025-2030 (%)

12.5 Asia - Market size and forecast 2025-2030

Chart on Asia - Market size and forecast 2025-2030 ($ million)
Data Table on Asia - Market size and forecast 2025-2030 ($ million)
Chart on Asia - Year-over-year growth 2025-2030 (%)
Data Table on Asia - Year-over-year growth 2025-2030 (%)
Chart on Regional Comparison - Asia
Data Table on Regional Comparison - Asia

12.5.1 China - Market size and forecast 2025-2030

Chart on China - Market size and forecast 2025-2030 ($ million)
Data Table on China - Market size and forecast 2025-2030 ($ million)
Chart on China - Year-over-year growth 2025-2030 (%)
Data Table on China - Year-over-year growth 2025-2030 (%)

12.5.2 Japan - Market size and forecast 2025-2030

Chart on Japan - Market size and forecast 2025-2030 ($ million)
Data Table on Japan - Market size and forecast 2025-2030 ($ million)
Chart on Japan - Year-over-year growth 2025-2030 (%)
Data Table on Japan - Year-over-year growth 2025-2030 (%)

12.5.3 India - Market size and forecast 2025-2030

Chart on India - Market size and forecast 2025-2030 ($ million)
Data Table on India - Market size and forecast 2025-2030 ($ million)
Chart on India - Year-over-year growth 2025-2030 (%)
Data Table on India - Year-over-year growth 2025-2030 (%)

12.5.4 South Korea - Market size and forecast 2025-2030

Chart on South Korea - Market size and forecast 2025-2030 ($ million)
Data Table on South Korea - Market size and forecast 2025-2030 ($ million)
Chart on South Korea - Year-over-year growth 2025-2030 (%)
Data Table on South Korea - Year-over-year growth 2025-2030 (%)

12.5.5 Indonesia - Market size and forecast 2025-2030

Chart on Indonesia - Market size and forecast 2025-2030 ($ million)
Data Table on Indonesia - Market size and forecast 2025-2030 ($ million)
Chart on Indonesia - Year-over-year growth 2025-2030 (%)
Data Table on Indonesia - Year-over-year growth 2025-2030 (%)

12.5.6 Thailand - Market size and forecast 2025-2030

Chart on Thailand - Market size and forecast 2025-2030 ($ million)
Data Table on Thailand - Market size and forecast 2025-2030 ($ million)
Chart on Thailand - Year-over-year growth 2025-2030 (%)
Data Table on Thailand - Year-over-year growth 2025-2030 (%)

12.6 Rest of World (ROW) - Market size and forecast 2025-2030

Chart on Rest of World (ROW) - Market size and forecast 2025-2030 ($ million)
Data Table on Rest of World (ROW) - Market size and forecast 2025-2030 ($ million)
Chart on Rest of World (ROW) - Year-over-year growth 2025-2030 (%)
Data Table on Rest of World (ROW) - Year-over-year growth 2025-2030 (%)
Chart on Regional Comparison - Rest of World (ROW)
Data Table on Regional Comparison - Rest of World (ROW)

12.6.1 Brazil - Market size and forecast 2025-2030

Chart on Brazil - Market size and forecast 2025-2030 ($ million)
Data Table on Brazil - Market size and forecast 2025-2030 ($ million)
Chart on Brazil - Year-over-year growth 2025-2030 (%)
Data Table on Brazil - Year-over-year growth 2025-2030 (%)

12.6.2 Saudi Arabia - Market size and forecast 2025-2030

Chart on Saudi Arabia - Market size and forecast 2025-2030 ($ million)
Data Table on Saudi Arabia - Market size and forecast 2025-2030 ($ million)
Chart on Saudi Arabia - Year-over-year growth 2025-2030 (%)
Data Table on Saudi Arabia - Year-over-year growth 2025-2030 (%)

12.6.3 UAE - Market size and forecast 2025-2030

Chart on UAE - Market size and forecast 2025-2030 ($ million)
Data Table on UAE - Market size and forecast 2025-2030 ($ million)
Chart on UAE - Year-over-year growth 2025-2030 (%)
Data Table on UAE - Year-over-year growth 2025-2030 (%)

12.6.4 Turkey - Market size and forecast 2025-2030

Chart on Turkey - Market size and forecast 2025-2030 ($ million)
Data Table on Turkey - Market size and forecast 2025-2030 ($ million)
Chart on Turkey - Year-over-year growth 2025-2030 (%)
Data Table on Turkey - Year-over-year growth 2025-2030 (%)

12.6.5 South Africa - Market size and forecast 2025-2030

Chart on South Africa - Market size and forecast 2025-2030 ($ million)
Data Table on South Africa - Market size and forecast 2025-2030 ($ million)
Chart on South Africa - Year-over-year growth 2025-2030 (%)
Data Table on South Africa - Year-over-year growth 2025-2030 (%)

12.6.6 Argentina - Market size and forecast 2025-2030

Chart on Argentina - Market size and forecast 2025-2030 ($ million)
Data Table on Argentina - Market size and forecast 2025-2030 ($ million)
Chart on Argentina - Year-over-year growth 2025-2030 (%)
Data Table on Argentina - Year-over-year growth 2025-2030 (%)

12.6.7 Colombia - Market size and forecast 2025-2030

Chart on Colombia - Market size and forecast 2025-2030 ($ million)
Data Table on Colombia - Market size and forecast 2025-2030 ($ million)
Chart on Colombia - Year-over-year growth 2025-2030 (%)
Data Table on Colombia - Year-over-year growth 2025-2030 (%)

12.6.8 Israel - Market size and forecast 2025-2030

Chart on Israel - Market size and forecast 2025-2030 ($ million)
Data Table on Israel - Market size and forecast 2025-2030 ($ million)
Chart on Israel - Year-over-year growth 2025-2030 (%)
Data Table on Israel - Year-over-year growth 2025-2030 (%)

12.7 Market opportunity by geography

Market opportunity by geography ($ million)
Data Tables on Market opportunity by geography ($ million)

13. Drivers, Challenges, and Opportunity

13.1 Market drivers

Increasing volume of surgical procedures and growing geriatric population
Heightened focus on patient blood management and risks of allogeneic transfusions
Continuous technological advancements in autotransfusion systems

13.2 Market challenges

High cost of systems and procedures and budgetary constraints
Lack of awareness and shortage of trained personnel
Clinical contraindications and lingering perceptions of risk

13.3 Impact of drivers and challenges

Impact of drivers and challenges in 2025 and 2030

13.4 Market opportunities

Expansion of clinical applications into low-blood-loss surgeries
Emphasis on compact, portable, and ergonomic system designs
Expansion into postoperative blood salvage

14. Competitive Landscape

14.1 Overview

14.2

Overview on criticality of inputs and factors of differentiation

14.3 Landscape disruption

Overview on factors of disruption

14.4 Industry risks

Impact of key risks on business

15. Competitive Analysis

15.1 Companies profiled

Companies covered

15.2 Company ranking index

15.3 Market positioning of companies

Matrix on companies position and classification

15.4 Becton Dickinson and Co.

Becton Dickinson and Co. - Overview
Becton Dickinson and Co. - Business segments
Becton Dickinson and Co. - Key news
Becton Dickinson and Co. - Key offerings
Becton Dickinson and Co. - Segment focus
SWOT

15.5 Beijing ZKSK Technology

Beijing ZKSK Technology - Overview
Beijing ZKSK Technology - Product / Service
Beijing ZKSK Technology - Key offerings
SWOT

15.6 Braile Biomedica

Braile Biomedica - Overview
Braile Biomedica - Product / Service
Braile Biomedica - Key offerings
SWOT

15.7 Fresenius Kabi AG

Fresenius Kabi AG - Overview
Fresenius Kabi AG - Product / Service
Fresenius Kabi AG - Key offerings
SWOT

15.8 Haemonetics Corp.

Haemonetics Corp. - Overview
Haemonetics Corp. - Business segments
Haemonetics Corp. - Key offerings
Haemonetics Corp. - Segment focus
SWOT

15.9 i‑SEP

i‑SEP - Overview
i‑SEP - Product / Service
i‑SEP - Key offerings
SWOT

15.10 LivaNova PLC

LivaNova PLC - Overview
LivaNova PLC - Business segments
LivaNova PLC - Key news
LivaNova PLC - Key offerings
LivaNova PLC - Segment focus
SWOT

15.11 Macopharma SA

Macopharma SA - Overview
Macopharma SA - Product / Service
Macopharma SA - Key offerings
SWOT

15.12 Medtronic Plc

Medtronic Plc - Overview
Medtronic Plc - Business segments
Medtronic Plc - Key news
Medtronic Plc - Key offerings
Medtronic Plc - Segment focus
SWOT

15.13 Nipro Corp.

Nipro Corp. - Overview
Nipro Corp. - Business segments
Nipro Corp. - Key offerings
Nipro Corp. - Segment focus
SWOT

15.14 SARSTEDT AG and Co. KG

SARSTEDT AG and Co. KG - Overview
SARSTEDT AG and Co. KG - Product / Service
SARSTEDT AG and Co. KG - Key offerings
SWOT

15.15 Stryker Corp.

Stryker Corp. - Overview
Stryker Corp. - Business segments
Stryker Corp. - Key news
Stryker Corp. - Key offerings
Stryker Corp. - Segment focus
SWOT

15.16 Teleflex Inc.

Teleflex Inc. - Overview
Teleflex Inc. - Business segments
Teleflex Inc. - Key news
Teleflex Inc. - Key offerings
Teleflex Inc. - Segment focus
SWOT

15.17 Terumo Corp.

Terumo Corp. - Overview
Terumo Corp. - Business segments
Terumo Corp. - Key news
Terumo Corp. - Key offerings
Terumo Corp. - Segment focus
SWOT

15.18 Zimmer Biomet Holdings Inc.

Zimmer Biomet Holdings Inc. - Overview
Zimmer Biomet Holdings Inc. - Business segments
Zimmer Biomet Holdings Inc. - Key news
Zimmer Biomet Holdings Inc. - Key offerings
Zimmer Biomet Holdings Inc. - Segment focus
SWOT

16. Appendix

16.1 Scope of the report

Market definition
Objectives
Notes and caveats

16.2 Inclusions and exclusions checklist

Inclusions checklist
Exclusions checklist

16.3 Currency conversion rates for US$

16.4 Research methodology

16.5 Data procurement

Information sources

16.6 Data validation

16.7 Validation techniques employed for market sizing

16.8 Data synthesis

16.9 360 degree market analysis

16.10 List of abbreviations

Research Methodology

Technavio presents a detailed picture of the market by way of study, synthesis, and summation of data from multiple sources. The analysts have presented the various facets of the market with a particular focus on identifying the key industry influencers. The data thus presented is comprehensive, reliable, and the result of extensive research, both primary and secondary.

INFORMATION SOURCES

Primary sources

  • Manufacturers and suppliers
  • Channel partners
  • Industry experts
  • Strategic decision makers

Secondary sources

  • Industry journals and periodicals
  • Government data
  • Financial reports of key industry players
  • Historical data
  • Press releases

DATA ANALYSIS

Data Synthesis

  • Collation of data
  • Estimation of key figures
  • Analysis of derived insights

Data Validation

  • Triangulation with data models
  • Reference against proprietary databases
  • Corroboration with industry experts

REPORT WRITING

Qualitative

  • Market drivers
  • Market challenges
  • Market trends
  • Five forces analysis

Quantitative

  • Market size and forecast
  • Market segmentation
  • Geographical insights
  • Competitive landscape

Interested in this report?

Get your sample now to see our research methodology and insights!

Download Now

Frequently Asked Questions

Autotransfusion Systems market growth will increase by USD 317.1 million during 2026-2030.

The Autotransfusion Systems market is expected to grow at a CAGR of 4.7% during 2026-2030.

Autotransfusion Systems market is segmented by Type (Autotransfusion products, Autotransfusion accessories) End-user (Hospitals, Clinics) Product type (Consumables, Devices)

Becton Dickinson and Co., Beijing ZKSK Technology, Braile Biomedica, Fresenius Kabi AG, Gen World Medical Devices, Haemonetics Corp., i‑SEP, LivaNova PLC, Macopharma SA, Medtronic Plc, Nipro Corp., Redax S.p.A., SARSTEDT AG and Co. KG, Stryker Corp., Teleflex Inc., Terumo Corp., Zimmer Biomet Holdings Inc. are a few of the key vendors in the Autotransfusion Systems market.

North America will register the highest growth rate of 42.5% among the other regions. Therefore, the Autotransfusion Systems market in North America is expected to garner significant business opportunities for the vendors during the forecast period.

US, Canada, Mexico, Germany, France, UK, Italy, Spain, The Netherlands, China, Japan, India, South Korea, Indonesia, Thailand, Brazil, Saudi Arabia, UAE, Turkey, South Africa, Argentina, Colombia, Israel

  • Increasing volume of surgical procedures and growing geriatric population is the driving factor this market.

The Autotransfusion Systems market vendors should focus on grabbing business opportunities from the Type segment as it accounted for the largest market share in the base year.