Automotive Reconfigurable Instrument Cluster Market Analysis North America, APAC, Europe, South America, Middle East and Africa - US, China, Japan, Germany, UK - Size and Forecast 2024-2028

Automotive Reconfigurable Instrument Cluster Market Analysis North America, APAC, Europe, South America, Middle East and Africa - US, China, Japan, Germany, UK - Size and Forecast 2024-2028

Published: Feb 2024 175 Pages SKU: IRTNTR46502

Market Overview at a Glance

$2.5 B
Market Opportunity
15.19%
CAGR
14.72
YoY growth 2023-2024(%)

Automotive Reconfigurable Instrument Cluster Market Size 2024-2028

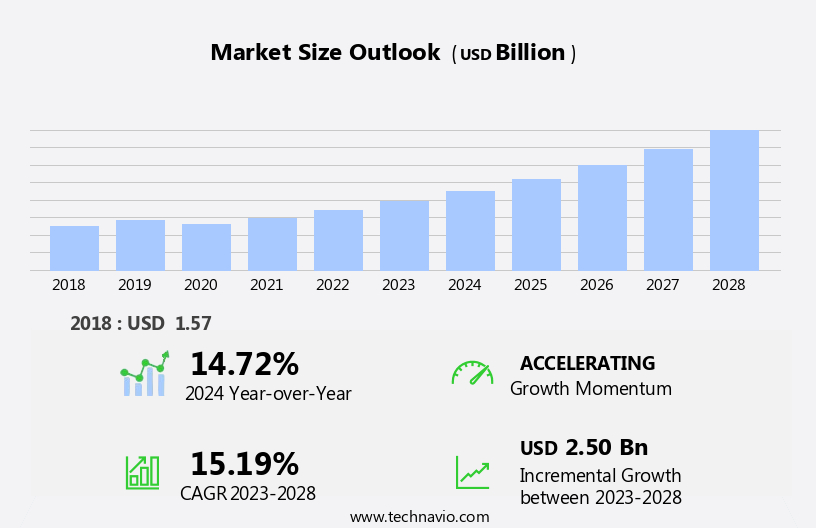
The automotive reconfigurable instrument cluster market size is forecast to increase by USD 2.50 billion at a CAGR of 15.19% between 2023 and 2028.

  • The reconfigurable instrument cluster market is experiencing significant growth due to the increasing demand for enhanced vehicle interiors and immersive driving experiences. This trend is driven by consumers' preference for personalized and customizable in-car displays. Moreover, the development of superior graphic displays is enabling automakers to offer more advanced features, such as real-time vehicle information and customizable layouts. However, cost pressure on automotive original equipment manufacturers (OEMs) is limiting the penetration of reconfigurable instrument clusters. Despite this challenge, the market is expected to witness steady growth In the coming years. The integration of advanced technologies, such as augmented reality and artificial intelligence, is expected to further enhance the functionality and appeal of reconfigurable instrument clusters.Overall, the market offers significant opportunities for growth, particularly In the North American region, where consumers are increasingly demanding advanced in-car technologies.

What will be the Size of the Automotive Reconfigurable Instrument Cluster Market During the Forecast Period?

Automotive Reconfigurable Instrument Cluster Market Size

 Request Free Sample

  • The market is experiencing significant growth due to the increasing demand for advanced driver-assistance systems (ADAS), connected car technology, and personalized driving experiences. Head-up displays (HUDs), interactive instrument clusters, and smart dashboards are becoming increasingly popular, offering drivers real-time information and enhanced user interface design. Data analytics and digital cockpits enable customized, sustainable transportation solutions, while cybersecurity measures ensure the protection of connected cars. Display technology advancements, such as LCD displays, are driving the future of interiors, with a focus on attractive and accessible instrument clusters. The integration of autonomous driving technology, infotainment systems, electrification, telematics, and connectivity continues to shape the market.
  • Cluster customization, cluster hardware, and instrument cluster software are key areas of innovation, providing drivers with a more personalized and safer driving experience. Regulations regarding instrument panel design and cluster accessibility are also influencing market trends. Overall, the market is evolving to meet the demands of future mobility and the changing needs of consumers.

How is this Automotive Reconfigurable Instrument Cluster Industry segmented and which is the largest segment?

The automotive reconfigurable instrument cluster industry research report provides comprehensive data (region-wise segment analysis), with forecasts and estimates in "USD billion" for the period 2024-2028, as well as historical data from 2018-2022 for the following segments.

  • Product
    • Partially reconfigurable instrument cluster
    • Fully reconfigurable instrument cluster
  • Application
    • Passenger cars
    • Commercial vehicles
  • Geography
    • North America
      • US
    • APAC
      • China
      • Japan
    • Europe
      • Germany
      • UK
    • South America
    • Middle East and Africa

By Product Insights

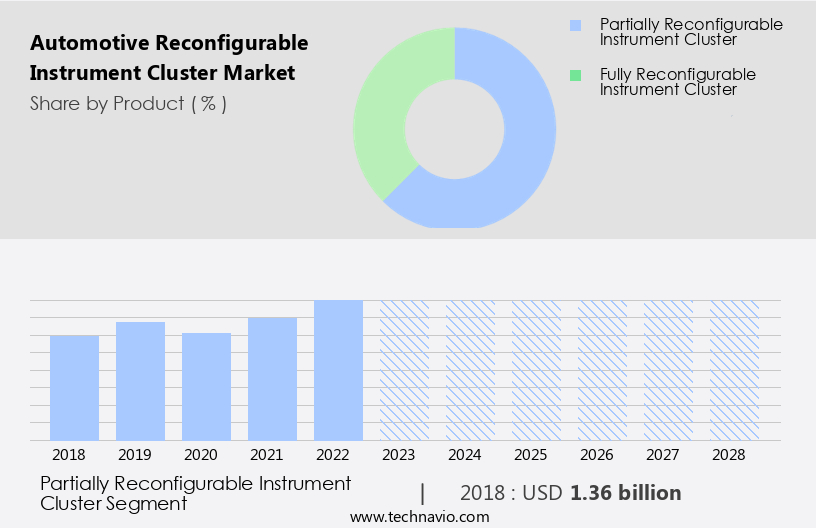
  • The partially reconfigurable instrument cluster segment is estimated to witness significant growth during the forecast period.

The market is witnessing significant growth due to the increasing adoption of digital instrument clusters in passenger cars. These digital clusters offer customizable features, enabling vehicle original equipment manufacturers (OEMs) to differentiate their offerings in various car models. Moreover, the integration of advanced display technologies such as OLED and LCD, voice recognition, and touch-sensitive controls enhances the user experience and driving experience. Additionally, the market is driven by the need for environmental sustainability and adherence to emission standards, leading to the development of fuel-efficient driving and eco-driving indicators. The market is expected to grow significantly in developed regions like North America and Europe, where there is a high demand for advanced technological features in vehicles.

The use of microprocessors, integrated circuits, and warning indicators In these clusters ensures safety and regulatory compliance. The market also includes hybrid instrument clusters, which offer a combination of analog and digital displays, catering to both entry-level and luxury cars. The integration of smartphone connectivity, maintenance cost reduction, and safety regulations further boosts the market growth.

Automotive Reconfigurable Instrument Cluster Market Size

Get a glance at the  Automotive Reconfigurable Instrument Cluster Industry report of share of various segments Request Free Sample

The Partially reconfigurable instrument cluster segment was valued at USD 1.36 billion in 2018 and showed a gradual increase during the forecast period.

Regional Analysis

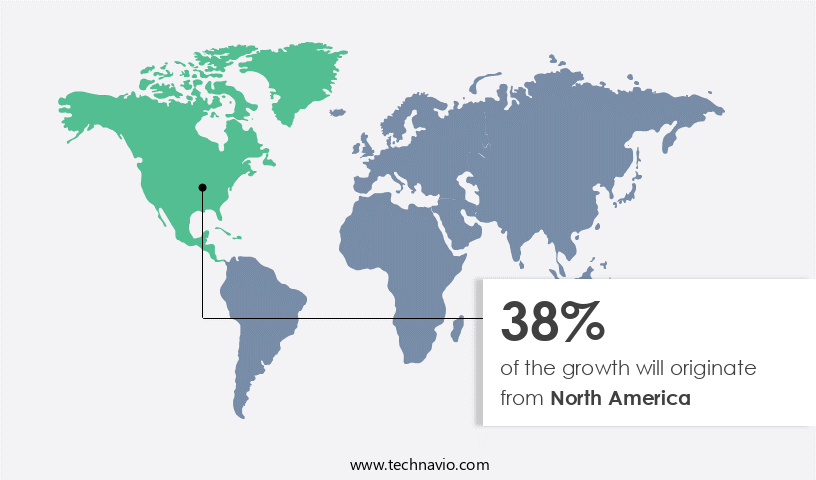
  • North America is estimated to contribute 38% to the growth of the global market during the forecast period.

Technavio's analysts have elaborately explained the regional trends and drivers that shape the market during the forecast period.

Automotive Reconfigurable Instrument Cluster Market Share by Geography

For more insights on the market share of various regions, Request Free Sample

The North American market for automotive reconfigurable instrument clusters is poised for growth due to the region's early adoption of advanced technologies and increasing penetration of hybrid instrument clusters in passenger vehicles. The US, in particular, is a significant contributor to this market, driven by its focus on autonomous vehicles and the testing of automated vehicles in select states. The adoption of digital and OLED displays, touch-sensitive controls, voice recognition, and eco-driving indicators In these clusters enhances the user experience and driving experience. Additionally, the integration of smartphone connectivity, warning indicators, and safety regulations further boosts the market. Innovations such as haptic feedback, microprocessors, and integrated circuits are expected to drive technological advancements in this sector.

The market for automotive reconfigurable instrument clusters includes various types, such as hybrid, digital, and analog clusters, catering to different segments, including passenger cars, light commercial vehicles, and heavy commercial vehicles. The market is expected to benefit from urbanization, fuel-efficient driving, and the increasing demand for environmental sustainability.

Market Dynamics

Our  researchers analyzed the data with 2023 as the base year, along with the key drivers, trends, and challenges. A holistic analysis of drivers will help companies refine their marketing strategies to gain a competitive advantage.

What are the key market drivers leading to the rise In the adoption of Automotive Reconfigurable Instrument Cluster Industry?

Growing demand for enhanced vehicle interiors and immersive driving experience is the key driver of the market.

  • In the automotive sector, there is a growing trend towards advanced instrument clusters that cater to modern consumer preferences. Reconfigurable instrument clusters, which replace traditional analog dials with digital displays, are at the forefront of this innovation. These clusters offer customizable, dynamic displays that can show real-time information on various parameters such as fuel efficiency, speed, temperature, navigation, and safety alerts. Hybrid instrument clusters, which combine both analog and digital elements, are gaining popularity in passenger cars, electric three-wheelers, and light commercial vehicles. These clusters often feature touch-sensitive controls, voice recognition, and smartphone integration, enhancing the user experience and driving experience.
  • Technological advancements, such as OLED and LCD displays, microprocessors, and integrated circuits, enable the production of sleek, high-resolution screens. These displays offer vivid graphics, intuitive icons, and augmented reality overlays, contributing to a more immersive and eco-friendly driving experience. Moreover, reconfigurable instrument clusters help improve fuel-efficient driving by providing eco-driving indicators and haptic feedback. They also offer warning indicators for safety regulations, making the driving experience safer and more environmentally sustainable. In the instrument cluster market, there is a shift towards digitization, with digital clusters becoming increasingly common in luxury cars and entry-level vehicles alike. This trend is driven by the desire for a more personalized and visually engaging driving experience, as well as the need to comply with emission standards and safety regulations.
  • In conclusion, reconfigurable instrument clusters represent a significant advancement In the automotive industry, offering a more personalized, visually engaging, and eco-friendly driving experience. These clusters are becoming an essential component of modern vehicles, as consumers demand more sophisticated interfaces and automakers seek to comply with safety and emission regulations.

What are the market trends shaping the Automotive Reconfigurable Instrument Cluster Industry?

Development of superior graphic displays is the upcoming market trend.

  • The reconfigurable instrument cluster market In the automotive sector is experiencing significant growth due to the integration of advanced technologies. These clusters enable customization of the information displayed, making them increasingly popular. Hybrid instrument clusters, which combine physical gauges with digital displays, are gaining traction in passenger cars, electric three-wheelers, and light commercial vehicles. Innovative features such as voice recognition, emission standards compliance, and user experience enhancements are driving the demand for these clusters. Display technologies like OLED, LCD, and LED are being used to create sleek and efficient instrument clusters. Touch-sensitive controls, microprocessors, and warning indicators are other essential components.
  • Safety regulations are also influencing the design and production of instrument clusters, with parameters like speedometer, tachometer, and temperature gauge being critical. Technological advancements, such as digital devices and graphic displays, are revolutionizing the instrument cluster market. Fuel-efficient driving and eco-driving indicators are becoming essential features for fuel-conscious consumers. Haptic feedback and smartphone integration are additional enhancements that are improving the driving experience. The reconfigurable instrument cluster market is witnessing significant innovation, with companies focusing on creating customizable and eco-friendly solutions. Safety, display, and hybrid clusters are the main sectors, catering to entry-level, luxury, and heavy commercial vehicles.
  • The integration of microprocessors, integrated circuits, and other digital devices is enabling the development of more sophisticated and cost-effective clusters. Environmental sustainability is a key consideration In the design and production of instrument clusters. As urbanization continues to grow, the demand for fuel-efficient and eco-friendly vehicles is increasing. The instrument cluster market is responding to this trend by offering digital and hybrid solutions that provide real-time information on fuel consumption and emissions. In conclusion, the reconfigurable instrument cluster market is a dynamic and evolving sector In the automotive electronics industry. The integration of advanced technologies, focus on user experience, and emphasis on environmental sustainability are driving the growth of this market.
  • companies are responding to these trends by developing innovative and customizable solutions that cater to the diverse needs of consumers.

What challenges does the Automotive Reconfigurable Instrument Cluster Industry face during its growth?

Cost pressure on automotive OEMs leading to low penetration of reconfigurable instrument clusters is a key challenge affecting the industry growth.

  • In the automotive sector, the instrument cluster market is witnessing significant innovation with the integration of advanced technologies. Traditional analog instrument clusters are being replaced by digital and hybrid clusters, featuring touch-sensitive controls, voice recognition, and eco-driving indicators. Hybrid instrument clusters, which combine physical gauges with digital displays, are gaining popularity in passenger cars, electric three-wheelers, and light commercial vehicles. Display technologies such as OLED and LCD are increasingly being used to enhance the user experience and driving experience. Safety regulations mandate the inclusion of warning indicators, fuel gauge, and speedometer, among other parameters, in instrument clusters. Microprocessors and integrated circuits are essential components of these advanced clusters.
  • Technological advancements, including smartphone integration and haptic feedback, are further enhancing the functionality and convenience of digital instrument clusters. Fuel-efficient driving and environmental sustainability are key priorities for consumers, leading to the adoption of eco-driving indicators and digitization of fuel gauges. The instrument cluster market is subject to safety regulations and production costs, which can impact the price and demand for these advanced clusters. In the value chain, automotive OEMs face cost pressures due to regulatory requirements and consumer demands for advanced features. The market for instrument clusters is expected to grow as urbanization increases the demand for fuel-efficient and technologically advanced vehicles.

Exclusive Customer Landscape

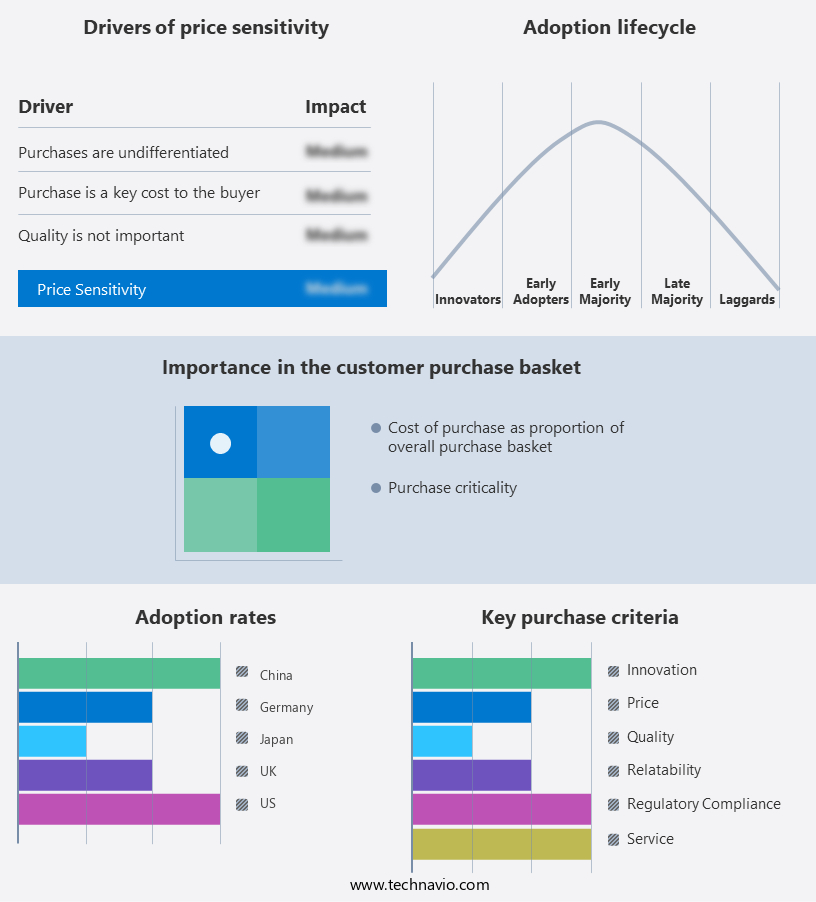
The automotive reconfigurable instrument cluster market forecasting report includes the adoption lifecycle of the market, covering from the innovator's stage to the laggard's stage. It focuses on adoption rates in different regions based on penetration. Furthermore, the automotive reconfigurable instrument cluster market report also includes key purchase criteria and drivers of price sensitivity to help companies evaluate and develop their market growth analysis strategies.

Automotive Reconfigurable Instrument Cluster Market Share by Geography

 Customer Landscape

Key Companies & Market Insights

Companies are implementing various strategies, such as strategic alliances, automotive reconfigurable instrument cluster market forecast, partnerships, mergers and acquisitions, geographical expansion, and product/service launches, to enhance their presence In the industry.

BlackBerry Ltd. - The reconfigurable instrument cluster market demands robust operating systems for mission-critical automotive applications. Our company provides solutions featuring QNX Neutrino real-time operating system, ensuring optimal performance, security, and reliability. This operating system caters to the evolving requirements of automotive systems, enabling customizable displays and advanced functionalities. By integrating QNX Neutrino, automakers can deliver enhanced user experiences while maintaining the highest safety standards.

The industry research and growth report includes detailed analyses of the competitive landscape of the market and information about key companies, including:

  • BlackBerry Ltd.
  • Caerbont Automotive Instruments Ltd.
  • Continental AG
  • DENSO Corp.
  • Hyundai Motor Co.
  • ID4Motion
  • International Automotive Components Group SA
  • Marelli Holdings Co. Ltd.
  • Nippon Seiki Co. Ltd.
  • NVIDIA Corp.
  • NXP Semiconductors NV
  • Panasonic Holdings Corp.
  • Pricol Ltd.
  • Renesas Electronics Corp.
  • Robert Bosch GmbH
  • Stoneridge Inc.
  • Texas Instruments Inc.
  • Toshiba Corp.
  • Visteon Corp.
  • Yazaki Corp.

Qualitative and quantitative analysis of companies has been conducted to help clients understand the wider business environment as well as the strengths and weaknesses of key industry players. Data is qualitatively analyzed to categorize companies as pure play, category-focused, industry-focused, and diversified; it is quantitatively analyzed to categorize companies as dominant, leading, strong, tentative, and weak.

Research Analyst Overview

The instrument cluster market encompasses a diverse range of technologies and applications withIn the automotive industry. Traditional instrument clusters, also known as analog clusters, have long been a staple in passenger cars, featuring physical gauges for parameters such as speed, fuel level, and engine temperature. However, the sector is undergoing significant transformation as technological advancements drive the shift towards digital instrument clusters. Digital instrument clusters, which utilize LCD or OLED displays, offer numerous advantages over their analog counterparts. These advantages include the ability to provide real-time information, customizable layouts, and integration with digital devices such as smartphones. Additionally, digital clusters can offer eco-driving indicators, fuel-efficient driving information, and warning indicators, enhancing the driving experience for consumers.

Moreover, the integration of touch-sensitive controls and voice recognition technology further enhances the user experience, allowing drivers to access important information and adjust settings with ease. Safety regulations also play a crucial role In the instrument cluster market, with safety indicators and warnings becoming increasingly important features. The production of instrument clusters involves the use of microprocessors and integrated circuits, allowing for advanced functionality and connectivity. The market for instrument clusters is not limited to passenger cars, with applications in light commercial and heavy commercial vehicles as well. The trend towards digitization and innovation In the automotive industry is driving the growth of the instrument cluster market.

Fuel efficiency and environmental sustainability are key priorities for consumers, and digital instrument clusters offer features that can help improve fuel efficiency and reduce emissions. Furthermore, the increasing popularity of autonomous vehicles is expected to create new opportunities for instrument cluster technology. The instrument cluster market is a dynamic and competitive sector, with various players offering innovative solutions to meet the evolving needs of consumers. Technological advancements, safety regulations, and consumer preferences are key drivers of market growth and innovation. The market is expected to continue to evolve as the automotive industry embraces digital technologies and strives to enhance the driving experience for consumers.

In conclusion, the instrument cluster market is an essential component of the automotive industry, undergoing significant transformation as technological advancements drive the shift towards digital instrument clusters. Digital instrument clusters offer numerous advantages over traditional analog clusters, including real-time information, customizable layouts, and integration with digital devices. Safety regulations, fuel efficiency, and environmental sustainability are key priorities for consumers, and digital instrument clusters offer features that can help address these concerns. The market for instrument clusters is dynamic and competitive, with various players offering innovative solutions to meet the evolving needs of consumers.

Market Scope

Report Coverage

Details

Page number

175

Base year

2023

Historic period

2018-2022

Forecast period

2024-2028

Growth momentum & CAGR

Accelerate at a CAGR of 15.19%

Market growth 2024-2028

USD 2.50 billion

Market structure

Fragmented

YoY growth 2023-2024(%)

14.72

Key countries

US, China, Japan, Germany, and UK

Competitive landscape

Leading Companies, Market Positioning of Companies, Competitive Strategies, and Industry Risks

Request Free Sample

What are the Key Data Covered in this Automotive Reconfigurable Instrument Cluster Market Research and Growth Report?

  • CAGR of the Automotive Reconfigurable Instrument Cluster industry during the forecast period
  • Detailed information on factors that will drive the growth and forecasting between 2024 and 2028
  • Precise estimation of the size of the market and its contribution of the industry in focus to the parent market
  • Accurate predictions about upcoming growth and trends and changes in consumer behaviour
  • Growth of the market across North America, APAC, Europe, South America, and Middle East and Africa
  • Thorough analysis of the market's competitive landscape and detailed information about companies
  • Comprehensive analysis of factors that will challenge the automotive reconfigurable instrument cluster market growth of industry companies

We can help! Our analysts can customize this automotive reconfigurable instrument cluster market research report to meet your requirements.

Get in touch

1 Executive Summary

  • 1.1 Market overview
    • Exhibit 01: Executive Summary – Chart on Market Overview
    • Exhibit 02: Executive Summary – Data Table on Market Overview
    • Exhibit 03: Executive Summary – Chart on Global Market Characteristics
    • Exhibit 04: Executive Summary – Chart on Market by Geography
    • Exhibit 05: Executive Summary – Chart on Market Segmentation by Product
    • Exhibit 06: Executive Summary – Chart on Market Segmentation by Application
    • Exhibit 07: Executive Summary – Chart on Incremental Growth
    • Exhibit 08: Executive Summary – Data Table on Incremental Growth
    • Exhibit 09: Executive Summary – Chart on Vendor Market Positioning

2 Market Landscape

  • 2.1 Market ecosystem
    • Exhibit 10: Parent market
    • Exhibit 11: Market Characteristics

3 Market Sizing

  • 3.1 Market definition
    • Exhibit 12: Offerings of vendors included in the market definition
  • 3.2 Market segment analysis
    • Exhibit 13: Market segments
  • 3.3 Market size 2023
    • 3.4 Market outlook: Forecast for 2023-2028
      • Exhibit 14: Chart on Global - Market size and forecast 2023-2028 ($ billion)
      • Exhibit 15: Data Table on Global - Market size and forecast 2023-2028 ($ billion)
      • Exhibit 16: Chart on Global Market: Year-over-year growth 2023-2028 (%)
      • Exhibit 17: Data Table on Global Market: Year-over-year growth 2023-2028 (%)

    4 Historic Market Size

    • 4.1 Global automotive reconfigurable instrument cluster market 2018 - 2022
      • Exhibit 18: Historic Market Size – Data Table on global automotive reconfigurable instrument cluster market 2018 - 2022 ($ billion)
    • 4.2 Product Segment Analysis 2018 - 2022
      • Exhibit 19: Historic Market Size – Product Segment 2018 - 2022 ($ billion)
    • 4.3 Application Segment Analysis 2018 - 2022
      • Exhibit 20: Historic Market Size – Application Segment 2018 - 2022 ($ billion)
    • 4.4 Geography Segment Analysis 2018 - 2022
      • Exhibit 21: Historic Market Size – Geography Segment 2018 - 2022 ($ billion)
    • 4.5 Country Segment Analysis 2018 - 2022
      • Exhibit 22: Historic Market Size – Country Segment 2018 - 2022 ($ billion)

    5 Five Forces Analysis

    • 5.1 Five forces summary
      • Exhibit 23: Five forces analysis - Comparison between 2023 and 2028
    • 5.2 Bargaining power of buyers
      • Exhibit 24: Chart on Bargaining power of buyers – Impact of key factors 2023 and 2028
    • 5.3 Bargaining power of suppliers
      • Exhibit 25: Bargaining power of suppliers – Impact of key factors in 2023 and 2028
    • 5.4 Threat of new entrants
      • Exhibit 26: Threat of new entrants – Impact of key factors in 2023 and 2028
    • 5.5 Threat of substitutes
      • Exhibit 27: Threat of substitutes – Impact of key factors in 2023 and 2028
    • 5.6 Threat of rivalry
      • Exhibit 28: Threat of rivalry – Impact of key factors in 2023 and 2028
    • 5.7 Market condition
      • Exhibit 29: Chart on Market condition - Five forces 2023 and 2028

    6 Market Segmentation by Product

    • 6.1 Market segments
      • Exhibit 30: Chart on Product - Market share 2023-2028 (%)
      • Exhibit 31: Data Table on Product - Market share 2023-2028 (%)
    • 6.2 Comparison by Product
      • Exhibit 32: Chart on Comparison by Product
      • Exhibit 33: Data Table on Comparison by Product
    • 6.3 Partially reconfigurable instrument cluster - Market size and forecast 2023-2028
      • Exhibit 34: Chart on Partially reconfigurable instrument cluster - Market size and forecast 2023-2028 ($ billion)
      • Exhibit 35: Data Table on Partially reconfigurable instrument cluster - Market size and forecast 2023-2028 ($ billion)
      • Exhibit 36: Chart on Partially reconfigurable instrument cluster - Year-over-year growth 2023-2028 (%)
      • Exhibit 37: Data Table on Partially reconfigurable instrument cluster - Year-over-year growth 2023-2028 (%)
    • 6.4 Fully reconfigurable instrument cluster - Market size and forecast 2023-2028
      • Exhibit 38: Chart on Fully reconfigurable instrument cluster - Market size and forecast 2023-2028 ($ billion)
      • Exhibit 39: Data Table on Fully reconfigurable instrument cluster - Market size and forecast 2023-2028 ($ billion)
      • Exhibit 40: Chart on Fully reconfigurable instrument cluster - Year-over-year growth 2023-2028 (%)
      • Exhibit 41: Data Table on Fully reconfigurable instrument cluster - Year-over-year growth 2023-2028 (%)
    • 6.5 Market opportunity by Product
      • Exhibit 42: Market opportunity by Product ($ billion)
      • Exhibit 43: Data Table on Market opportunity by Product ($ billion)

    7 Market Segmentation by Application

    • 7.1 Market segments
      • Exhibit 44: Chart on Application - Market share 2023-2028 (%)
      • Exhibit 45: Data Table on Application - Market share 2023-2028 (%)
    • 7.2 Comparison by Application
      • Exhibit 46: Chart on Comparison by Application
      • Exhibit 47: Data Table on Comparison by Application
    • 7.3 Passenger cars - Market size and forecast 2023-2028
      • Exhibit 48: Chart on Passenger cars - Market size and forecast 2023-2028 ($ billion)
      • Exhibit 49: Data Table on Passenger cars - Market size and forecast 2023-2028 ($ billion)
      • Exhibit 50: Chart on Passenger cars - Year-over-year growth 2023-2028 (%)
      • Exhibit 51: Data Table on Passenger cars - Year-over-year growth 2023-2028 (%)
    • 7.4 Commercial vehicles - Market size and forecast 2023-2028
      • Exhibit 52: Chart on Commercial vehicles - Market size and forecast 2023-2028 ($ billion)
      • Exhibit 53: Data Table on Commercial vehicles - Market size and forecast 2023-2028 ($ billion)
      • Exhibit 54: Chart on Commercial vehicles - Year-over-year growth 2023-2028 (%)
      • Exhibit 55: Data Table on Commercial vehicles - Year-over-year growth 2023-2028 (%)
    • 7.5 Market opportunity by Application
      • Exhibit 56: Market opportunity by Application ($ billion)
      • Exhibit 57: Data Table on Market opportunity by Application ($ billion)

    8 Customer Landscape

    • 8.1 Customer landscape overview
      • Exhibit 58: Analysis of price sensitivity, lifecycle, customer purchase basket, adoption rates, and purchase criteria

    9 Geographic Landscape

    • 9.1 Geographic segmentation
      • Exhibit 59: Chart on Market share by geography 2023-2028 (%)
      • Exhibit 60: Data Table on Market share by geography 2023-2028 (%)
    • 9.2 Geographic comparison
      • Exhibit 61: Chart on Geographic comparison
      • Exhibit 62: Data Table on Geographic comparison
    • 9.3 North America - Market size and forecast 2023-2028
      • Exhibit 63: Chart on North America - Market size and forecast 2023-2028 ($ billion)
      • Exhibit 64: Data Table on North America - Market size and forecast 2023-2028 ($ billion)
      • Exhibit 65: Chart on North America - Year-over-year growth 2023-2028 (%)
      • Exhibit 66: Data Table on North America - Year-over-year growth 2023-2028 (%)
    • 9.4 Europe - Market size and forecast 2023-2028
      • Exhibit 67: Chart on Europe - Market size and forecast 2023-2028 ($ billion)
      • Exhibit 68: Data Table on Europe - Market size and forecast 2023-2028 ($ billion)
      • Exhibit 69: Chart on Europe - Year-over-year growth 2023-2028 (%)
      • Exhibit 70: Data Table on Europe - Year-over-year growth 2023-2028 (%)
    • 9.5 APAC - Market size and forecast 2023-2028
      • Exhibit 71: Chart on APAC - Market size and forecast 2023-2028 ($ billion)
      • Exhibit 72: Data Table on APAC - Market size and forecast 2023-2028 ($ billion)
      • Exhibit 73: Chart on APAC - Year-over-year growth 2023-2028 (%)
      • Exhibit 74: Data Table on APAC - Year-over-year growth 2023-2028 (%)
    • 9.6 South America - Market size and forecast 2023-2028
      • Exhibit 75: Chart on South America - Market size and forecast 2023-2028 ($ billion)
      • Exhibit 76: Data Table on South America - Market size and forecast 2023-2028 ($ billion)
      • Exhibit 77: Chart on South America - Year-over-year growth 2023-2028 (%)
      • Exhibit 78: Data Table on South America - Year-over-year growth 2023-2028 (%)
    • 9.7 Middle East and Africa - Market size and forecast 2023-2028
      • Exhibit 79: Chart on Middle East and Africa - Market size and forecast 2023-2028 ($ billion)
      • Exhibit 80: Data Table on Middle East and Africa - Market size and forecast 2023-2028 ($ billion)
      • Exhibit 81: Chart on Middle East and Africa - Year-over-year growth 2023-2028 (%)
      • Exhibit 82: Data Table on Middle East and Africa - Year-over-year growth 2023-2028 (%)
    • 9.8 US - Market size and forecast 2023-2028
      • Exhibit 83: Chart on US - Market size and forecast 2023-2028 ($ billion)
      • Exhibit 84: Data Table on US - Market size and forecast 2023-2028 ($ billion)
      • Exhibit 85: Chart on US - Year-over-year growth 2023-2028 (%)
      • Exhibit 86: Data Table on US - Year-over-year growth 2023-2028 (%)
    • 9.9 China - Market size and forecast 2023-2028
      • Exhibit 87: Chart on China - Market size and forecast 2023-2028 ($ billion)
      • Exhibit 88: Data Table on China - Market size and forecast 2023-2028 ($ billion)
      • Exhibit 89: Chart on China - Year-over-year growth 2023-2028 (%)
      • Exhibit 90: Data Table on China - Year-over-year growth 2023-2028 (%)
    • 9.10 Germany - Market size and forecast 2023-2028
      • Exhibit 91: Chart on Germany - Market size and forecast 2023-2028 ($ billion)
      • Exhibit 92: Data Table on Germany - Market size and forecast 2023-2028 ($ billion)
      • Exhibit 93: Chart on Germany - Year-over-year growth 2023-2028 (%)
      • Exhibit 94: Data Table on Germany - Year-over-year growth 2023-2028 (%)
    • 9.11 UK - Market size and forecast 2023-2028
      • Exhibit 95: Chart on UK - Market size and forecast 2023-2028 ($ billion)
      • Exhibit 96: Data Table on UK - Market size and forecast 2023-2028 ($ billion)
      • Exhibit 97: Chart on UK - Year-over-year growth 2023-2028 (%)
      • Exhibit 98: Data Table on UK - Year-over-year growth 2023-2028 (%)
    • 9.12 Japan - Market size and forecast 2023-2028
      • Exhibit 99: Chart on Japan - Market size and forecast 2023-2028 ($ billion)
      • Exhibit 100: Data Table on Japan - Market size and forecast 2023-2028 ($ billion)
      • Exhibit 101: Chart on Japan - Year-over-year growth 2023-2028 (%)
      • Exhibit 102: Data Table on Japan - Year-over-year growth 2023-2028 (%)
    • 9.13 Market opportunity by geography
      • Exhibit 103: Market opportunity by geography ($ billion)
      • Exhibit 104: Data Tables on Market opportunity by geography ($ billion)

    10 Drivers, Challenges, and Trends

    • 10.1 Market drivers
      • 10.2 Market challenges
        • 10.3 Impact of drivers and challenges
          • Exhibit 105: Impact of drivers and challenges in 2023 and 2028
        • 10.4 Market trends

          11 Vendor Landscape

          • 11.1 Overview
            • 11.2 Vendor landscape
              • Exhibit 106: Overview on Criticality of inputs and Factors of differentiation
            • 11.3 Landscape disruption
              • Exhibit 107: Overview on factors of disruption
            • 11.4 Industry risks
              • Exhibit 108: Impact of key risks on business

            12 Vendor Analysis

            • 12.1 Vendors covered
              • Exhibit 109: Vendors covered
            • 12.2 Market positioning of vendors
              • Exhibit 110: Matrix on vendor position and classification
            • 12.3 BlackBerry Ltd.
              • Exhibit 111: BlackBerry Ltd. - Overview
              • Exhibit 112: BlackBerry Ltd. - Business segments
              • Exhibit 113: BlackBerry Ltd. - Key news
              • Exhibit 114: BlackBerry Ltd. - Key offerings
              • Exhibit 115: BlackBerry Ltd. - Segment focus
            • 12.4 Caerbont Automotive Instruments Ltd.
              • Exhibit 116: Caerbont Automotive Instruments Ltd. - Overview
              • Exhibit 117: Caerbont Automotive Instruments Ltd. - Product / Service
              • Exhibit 118: Caerbont Automotive Instruments Ltd. - Key offerings
            • 12.5 Continental AG
              • Exhibit 119: Continental AG - Overview
              • Exhibit 120: Continental AG - Business segments
              • Exhibit 121: Continental AG - Key news
              • Exhibit 122: Continental AG - Key offerings
              • Exhibit 123: Continental AG - Segment focus
            • 12.6 DENSO Corp.
              • Exhibit 124: DENSO Corp. - Overview
              • Exhibit 125: DENSO Corp. - Business segments
              • Exhibit 126: DENSO Corp. - Key news
              • Exhibit 127: DENSO Corp. - Key offerings
              • Exhibit 128: DENSO Corp. - Segment focus
            • 12.7 Hyundai Motor Co.
              • Exhibit 129: Hyundai Motor Co. - Overview
              • Exhibit 130: Hyundai Motor Co. - Business segments
              • Exhibit 131: Hyundai Motor Co. - Key news
              • Exhibit 132: Hyundai Motor Co. - Key offerings
              • Exhibit 133: Hyundai Motor Co. - Segment focus
            • 12.8 ID4Motion
              • Exhibit 134: ID4Motion - Overview
              • Exhibit 135: ID4Motion - Product / Service
              • Exhibit 136: ID4Motion - Key offerings
            • 12.9 International Automotive Components Group SA
              • Exhibit 137: International Automotive Components Group SA - Overview
              • Exhibit 138: International Automotive Components Group SA - Product / Service
              • Exhibit 139: International Automotive Components Group SA - Key news
              • Exhibit 140: International Automotive Components Group SA - Key offerings
            • 12.10 Marelli Holdings Co. Ltd.
              • Exhibit 141: Marelli Holdings Co. Ltd. - Overview
              • Exhibit 142: Marelli Holdings Co. Ltd. - Product / Service
              • Exhibit 143: Marelli Holdings Co. Ltd. - Key news
              • Exhibit 144: Marelli Holdings Co. Ltd. - Key offerings
            • 12.11 Nippon Seiki Co. Ltd.
              • Exhibit 145: Nippon Seiki Co. Ltd. - Overview
              • Exhibit 146: Nippon Seiki Co. Ltd. - Business segments
              • Exhibit 147: Nippon Seiki Co. Ltd. - Key offerings
              • Exhibit 148: Nippon Seiki Co. Ltd. - Segment focus
            • 12.12 NVIDIA Corp.
              • Exhibit 149: NVIDIA Corp. - Overview
              • Exhibit 150: NVIDIA Corp. - Business segments
              • Exhibit 151: NVIDIA Corp. - Key news
              • Exhibit 152: NVIDIA Corp. - Key offerings
              • Exhibit 153: NVIDIA Corp. - Segment focus
            • 12.13 NXP Semiconductors NV
              • Exhibit 154: NXP Semiconductors NV - Overview
              • Exhibit 155: NXP Semiconductors NV - Product / Service
              • Exhibit 156: NXP Semiconductors NV - Key news
              • Exhibit 157: NXP Semiconductors NV - Key offerings
            • 12.14 Panasonic Holdings Corp.
              • Exhibit 158: Panasonic Holdings Corp. - Overview
              • Exhibit 159: Panasonic Holdings Corp. - Business segments
              • Exhibit 160: Panasonic Holdings Corp. - Key news
              • Exhibit 161: Panasonic Holdings Corp. - Key offerings
              • Exhibit 162: Panasonic Holdings Corp. - Segment focus
            • 12.15 Pricol Ltd.
              • Exhibit 163: Pricol Ltd. - Overview
              • Exhibit 164: Pricol Ltd. - Product / Service
              • Exhibit 165: Pricol Ltd. - Key offerings
            • 12.16 Renesas Electronics Corp.
              • Exhibit 166: Renesas Electronics Corp. - Overview
              • Exhibit 167: Renesas Electronics Corp. - Business segments
              • Exhibit 168: Renesas Electronics Corp. - Key news
              • Exhibit 169: Renesas Electronics Corp. - Key offerings
              • Exhibit 170: Renesas Electronics Corp. - Segment focus
            • 12.17 Robert Bosch GmbH
              • Exhibit 171: Robert Bosch GmbH - Overview
              • Exhibit 172: Robert Bosch GmbH - Business segments
              • Exhibit 173: Robert Bosch GmbH - Key news
              • Exhibit 174: Robert Bosch GmbH - Key offerings
              • Exhibit 175: Robert Bosch GmbH - Segment focus

            13 Appendix

            • 13.1 Scope of the report
              • 13.2 Inclusions and exclusions checklist
                • Exhibit 176: Inclusions checklist
                • Exhibit 177: Exclusions checklist
              • 13.3 Currency conversion rates for US$
                • Exhibit 178: Currency conversion rates for US$
              • 13.4 Research methodology
                • Exhibit 179: Research methodology
                • Exhibit 180: Validation techniques employed for market sizing
                • Exhibit 181: Information sources
              • 13.5 List of abbreviations
                • Exhibit 182: List of abbreviations

              Research Methodology

              Technavio presents a detailed picture of the market by way of study, synthesis, and summation of data from multiple sources. The analysts have presented the various facets of the market with a particular focus on identifying the key industry influencers. The data thus presented is comprehensive, reliable, and the result of extensive research, both primary and secondary.

              INFORMATION SOURCES

              Primary sources

              • Manufacturers and suppliers
              • Channel partners
              • Industry experts
              • Strategic decision makers

              Secondary sources

              • Industry journals and periodicals
              • Government data
              • Financial reports of key industry players
              • Historical data
              • Press releases

              DATA ANALYSIS

              Data Synthesis

              • Collation of data
              • Estimation of key figures
              • Analysis of derived insights

              Data Validation

              • Triangulation with data models
              • Reference against proprietary databases
              • Corroboration with industry experts

              REPORT WRITING

              Qualitative

              • Market drivers
              • Market challenges
              • Market trends
              • Five forces analysis

              Quantitative

              • Market size and forecast
              • Market segmentation
              • Geographical insights
              • Competitive landscape

              Interested in this report?

              Get your sample now to see our research methodology and insights!

              Download Now

              Frequently Asked Questions

              Automotive Reconfigurable Instrument Cluster market growth will increase by $ 2.50 bn during 2024-2028.

              The Automotive Reconfigurable Instrument Cluster market is expected to grow at a CAGR of 15.19% during 2024-2028.

              Automotive Reconfigurable Instrument Cluster market is segmented by Product( Partially reconfigurable instrument cluster, Fully reconfigurable instrument cluster) Application( Passenger cars, Commercial vehicles, APAC, South America, Middle East and Africa)

              BlackBerry Ltd., Caerbont Automotive Instruments Ltd., Continental AG, DENSO Corp., Hyundai Motor Co., ID4Motion, International Automotive Components Group SA, Marelli Holdings Co. Ltd., Nippon Seiki Co. Ltd., NVIDIA Corp., NXP Semiconductors NV, Panasonic Holdings Corp., Pricol Ltd., Renesas Electronics Corp., Robert Bosch GmbH, Stoneridge Inc., Texas Instruments Inc., Toshiba Corp., Visteon Corp., Yazaki Corp. are a few of the key vendors in the Automotive Reconfigurable Instrument Cluster market.

              North America will register the highest growth rate of 38% among the other regions. Therefore, the Automotive Reconfigurable Instrument Cluster market in North America is expected to garner significant business opportunities for the vendors during the forecast period.

              US, China, Japan, Germany, UK

              • Growing demand for enhanced vehicle interiors and immersive driving experienceModern consumers is the driving factor this market.
              • accustomed to intuitive digital interfaces in other aspects of their lives is the driving factor this market.
              • increasingly expect a similar level of sophistication and personalization in their vehicles. Reconfigurable instrument clusters play a pivotal role in meeting these expectations by offering dynamic is the driving factor this market.
              • customizable displays that go beyond traditional analog gauges. Drivers today seek seamless and visually engaging interaction with their vehicles. Reconfigurable instrument clusters fulfill this demand by providing real-time information on different aspects like navigation is the driving factor this market.
              • entertainment is the driving factor this market.
              • vehicle performance is the driving factor this market.
              • and safety alerts in a visually appealing format. For instance is the driving factor this market.
              • high-resolution screens can display vivid graphics is the driving factor this market.
              • intuitive icons is the driving factor this market.
              • and augmented reality overlays is the driving factor this market.
              • contributing to a more immersive driving experience. Customization is another key aspect of enhancing the user experience. Reconfigurable instrument clusters allow drivers to personalize their digital dashboards is the driving factor this market.
              • choose layouts and themes is the driving factor this market.
              • and the specific information they want to be displayed. Luxury car manufacturers are leveraging this trend by offering highly customizable clusters that align with the aesthetics of their automobiles is the driving factor this market.
              • which provide a sense of exclusivity to car owners. Furthermore is the driving factor this market.
              • the integration of advanced connectivity features in vehicles enhances the overall user experience. Reconfigurable instrument clusters integrate seamlessly with smartphones and other devices is the driving factor this market.
              • enabling functions such as hands-free calling is the driving factor this market.
              • music streaming is the driving factor this market.
              • and real-time traffic updates. These features contribute to a connected and technologically integrated driving environment that caters to the modern consumer digital lifestyle. Thus is the driving factor this market.
              • the growing demand for an enhanced and immersive driving experience will continue to drive the growth of the market in focus during the forecast period. is the driving factor this market.

              The Automotive Reconfigurable Instrument Cluster market vendors should focus on grabbing business opportunities from the Partially reconfigurable instrument cluster segment as it accounted for the largest market share in the base year.