Automotive Pump Market Analysis Europe, North America, APAC, South America, Middle East and Africa - US, China, Japan, Germany, UK - Size and Forecast 2024-2028

Automotive Pump Market Analysis Europe, North America, APAC, South America, Middle East and Africa - US, China, Japan, Germany, UK - Size and Forecast 2024-2028

Published: Mar 2024 175 Pages SKU: IRTNTR40073

Market Overview at a Glance

$3.49 B
Market Opportunity
4.14%
CAGR
3.7
YoY growth 2023-2024(%)

Automotive Pump Market Size 2024-2028 

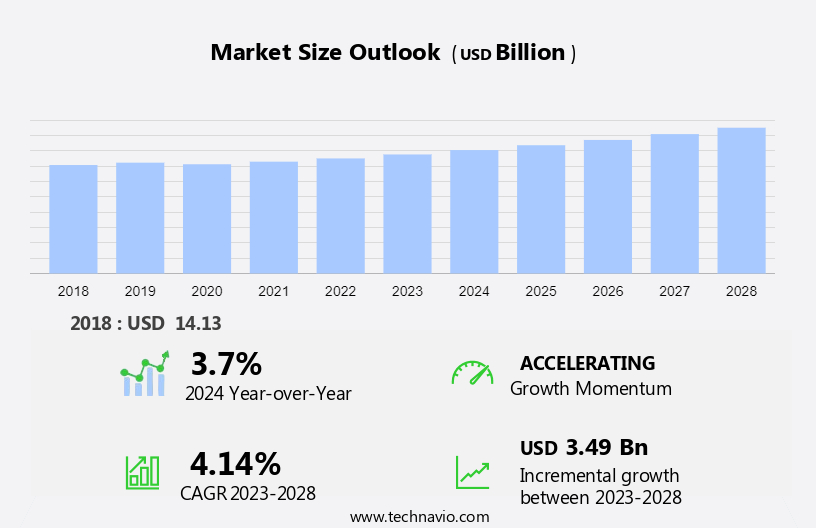
The automotive pump market size is forecast to increase by USD 3.49 billion at a CAGR of 4.14% between 2023 and 2028.

  • The market is driven by the expansion of the passenger automobile industry, particularly in emerging economies. Another significant growth factor is the increasing adoption of electric vehicle (EV) technologies and vehicle electrification.
  • However, challenges such as the high cost of electric fuel pumps and stringent environmental laws pose hurdles to market growth. Moreover, advancements in automation technologies are transforming the industry, enabling improved fuel efficiency and reducing emissions. The report provides a comprehensive analysis of these trends and challenges, offering insights into the future growth prospects of the market. For businesses aiming to capitalize on these opportunities, the report serves as a valuable resource, shedding light on the key market drivers, challenges, and future growth prospects.

What will be the Automotive Pump Market Size During the Forecast Period?

Automotive Pump Market Size

 Request Free Sample

  • The market in the US is witnessing significant changes as automotive original equipment manufacturers (OEMs) respond to stringent environmental regulations and the shift towards electric vehicles (EVs). The focus on reducing carbon emissions, particularly in urban areas and megacities, is driving the demand for advanced pump technologies in various vehicle sub-systems. Carbon emission norms have become increasingly stringent, compelling automotive OEMs to explore alternative fuel sources and technologies. Conventional fuel vehicles continue to dominate the market, but the adoption of EV technologies and vehicle electrification is on the rise.
  • For instance, the use of direct fuel injection systems and advanced turbocharging technologies requires the development of specialized fuel pumps to ensure optimal performance. The increasing adoption of EVs is also driving the demand for new pump solutions. In EVs, pumps are used for various applications, such as cooling the battery pack, circulating the coolant, and delivering the charging current. The development of EV technologies is leading to the creation of new pump designs and materials that can handle the unique requirements of these vehicles. The use of paint and solvents in the automotive industry is another area where pumps play a crucial role.

  • The application of these materials generates volatile organic compounds (VOCs), which contribute to photochemical haze and other environmental issues. The development of low-VOC and water-based coatings is driving the demand for pumps that can handle these new materials effectively. In conclusion, the market in the US is undergoing significant changes as automotive OEMs adapt to regulatory requirements and technological advancements. The focus on reducing carbon emissions, improving fuel efficiency, and developing new EV technologies is driving the demand for advanced pump solutions in various applications. The market is expected to grow steadily as automotive OEMs continue to innovate and respond to changing market conditions.

How is this market segmented and which is the largest segment?

The market research report provides comprehensive data (region-wise segment analysis), with forecasts and estimates in "USD billion" for the period 2024-2028, as well as historical data from 2018-2022 for the following segments.

  • Type
    • Mechanical
    • Automatic
  • Application
    • Passenger cars
    • Commercial vehicles
  • Geography
    • Europe
      • Germany
      • UK
    • North America
      • US
    • APAC
      • China
      • Japan
    • South America
    • Middle East and Africa

By Type Insights

  • The mechanical segment is estimated to witness significant growth during the forecast period.

Mechanical pumps serve a vital role in various transportation industries, including those utilizing vans, utility trucks, buses, trains, and motorcycles. These pumps are classified as positive displacement types, which employ automated mechanisms to generate fluid flow. Primarily, they are employed for pumping fuel or coolant. In the context of automobiles, mechanical fuel pumps are indispensable components of the fuel system. These pumps operate by utilizing a lever to create suction, drawing fuel from the tank, and delivering it to the carburetor or fuel injection system. Two primary categories of mechanical pumps exist: low-pressure mechanical pumps and high-pressure mechanical pumps.

Low-pressure pumps are designed to generate flow at minimal pressures. Once the outlet pressure surpasses the pump's capacity, the pump will cease creating flow. For instance, low-pressure pumps operate at a fuel pressure of around 10-15 psi. In the realm of transportation, sensors play a significant role in monitoring and optimizing the performance of mechanical pumps. These sensors provide real-time data, enabling proactive maintenance and enhancing overall efficiency. As the transportation sector continues to evolve, the demand for advanced mechanical pumps and related technologies is expected to grow.

Automotive Pump Market Size

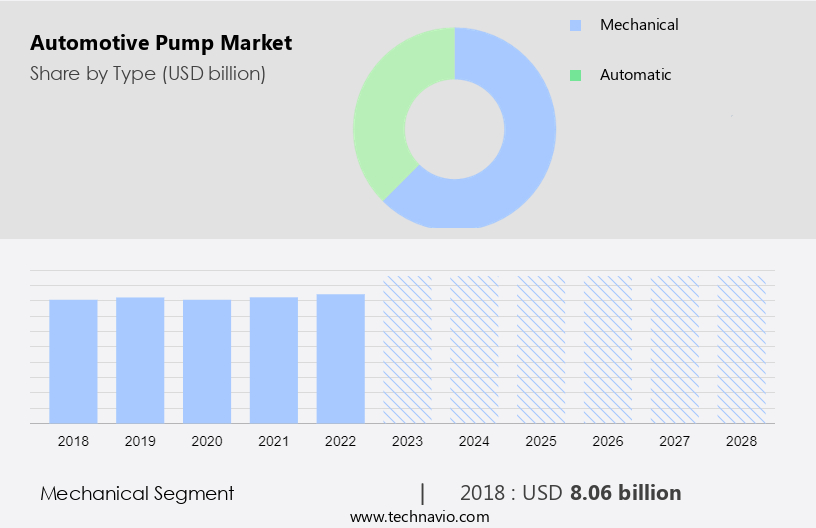
Get a glance at the market report of share of various segments Request Free Sample

The Mechanical segment was valued at USD 8.06 billion in 2018 and showed a gradual increase during the forecast period.

Regional Analysis

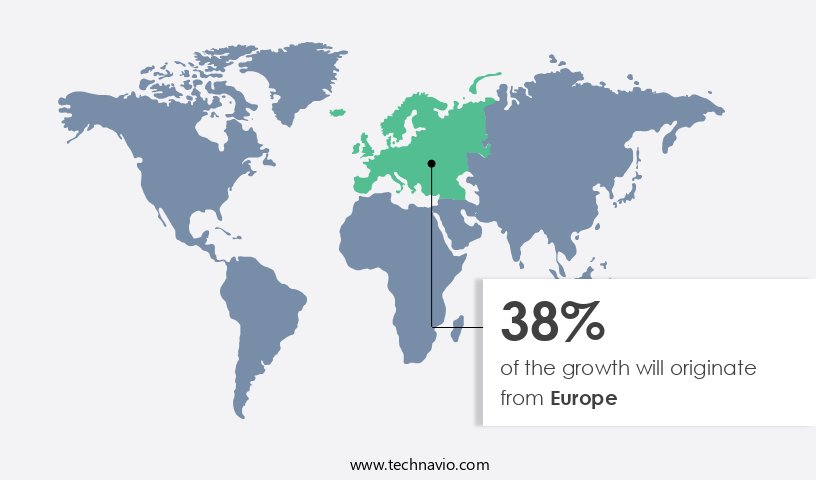
  • Europe is estimated to contribute 38% to the growth of the global market during the forecast period.

Technavio's analysts have elaborately explained the regional trends and drivers that shape the market during the forecast period.

Automotive Pump Market Share by Geography

For more insights on the market share of various regions, Request Free Sample

The European market is projected to exhibit a steady expansion during the forecast period. Major contributors to this market in Europe include Germany, France, Italy, Spain, and the United Kingdom. These nations have a significant demand for sophisticated fuel injection systems in vehicles and enforce stringent emission regulations. Europe is a pioneering region in the development of advanced automotive technologies. However, the growing popularity of electric vehicles in the region poses a challenge to the market, as most pumps are designed for use in vehicles with internal combustion engines (ICEs). Inverter cooling technologies and advanced combustion systems are driving the evolution of cooling technologies in the automotive industry. Carbon emissions remain a major concern, leading to the development of more efficient and eco-friendly cooling systems. Vehicle sub-systems, such as the cooling system, play a crucial role in ensuring optimal vehicle performance and reducing emissions.

Our researchers analyzed the data with 2023 as the base year, along with the key drivers, trends, and challenges. A holistic analysis of drivers will help companies refine their marketing strategies to gain a competitive advantage.

What are the key market drivers leading to the rise in adoption of Automotive Pump Market?

Growth of automotive industry in emerging economies is the key driver of the market.

  • The expanding economies of emerging markets significantly contribute to the global expansion of the automotive pump industry. The rise in economic activity in developing nations has resulted in an increase in per capita income, leading to a growing demand for personal vehicles. With urbanization and the subsequent growth of major cities, public transportation infrastructure struggles to keep pace with population growth and the resulting transportation needs. According to World Bank data, China's population accounts for approximately one-fifth of the world's total population. This urbanization trend has resulted in a surge in demand for automotive pumps, particularly in applications related to electric vehicles (EVs), emission control systems, radiators, and the handling of liquefied gases used in paint and solvents. As governments and businesses in these markets invest in reducing photochemical haze and improving emission levels, the market is poised for continued growth. 

What are the market trends shaping the Automotive Pump Market?

Developments in field of hydrocarbon evaporation control systems is the upcoming trend in the market.

  • The automotive industry in the United States is prioritizing efforts to minimize environmental impact. Various stakeholders, including automotive suppliers and government bodies, are collaborating to create a more sustainable automotive sector. This focus on sustainability has led to advancements and innovations in automotive technology and systems, which help reduce harmful emissions. One notable example is Continental Automotive GmbH, a leading Tier-1 supplier in The market. In response to stringent hydrocarbon evaporation legislation, Continental has introduced an electrified solution to reduce emissions. Specifically, they have developed an electric Active Purge Pump. This technology is designed to eliminate hydrocarbon-laden air from the canister, thereby minimizing evaporative hydrocarbon emissions. By implementing this electric pump, Continental is contributing to the broader goal of creating a more eco-friendly automotive industry.

What challenges does Automotive Pump Market face during the growth?

High cost of electric fuel pumps is a key challenge affecting the market growth.

  • Electric fuel pumps play a vital role in the performance of automotive fuel systems by delivering fuel at high pressure and precise quantities to the engine intake manifold in passenger automobiles. A malfunctioning electric fuel pump can negatively impact engine performance, potentially causing inadequate fuel supply and reduced engine efficiency. Replacing a faulty electric fuel pump can be costly, making it essential for automakers to source these components from reliable companies. The shift towards electric vehicle (EV) technologies and vehicle electrification is driving the demand for electric fuel pumps in the automotive industry. Environmental laws and regulations are also pushing automakers to adopt more efficient fuel systems. Furthermore, automation technologies are being integrated into fuel pump systems to enhance performance and reduce maintenance requirements. 

Exclusive Customer Landscape

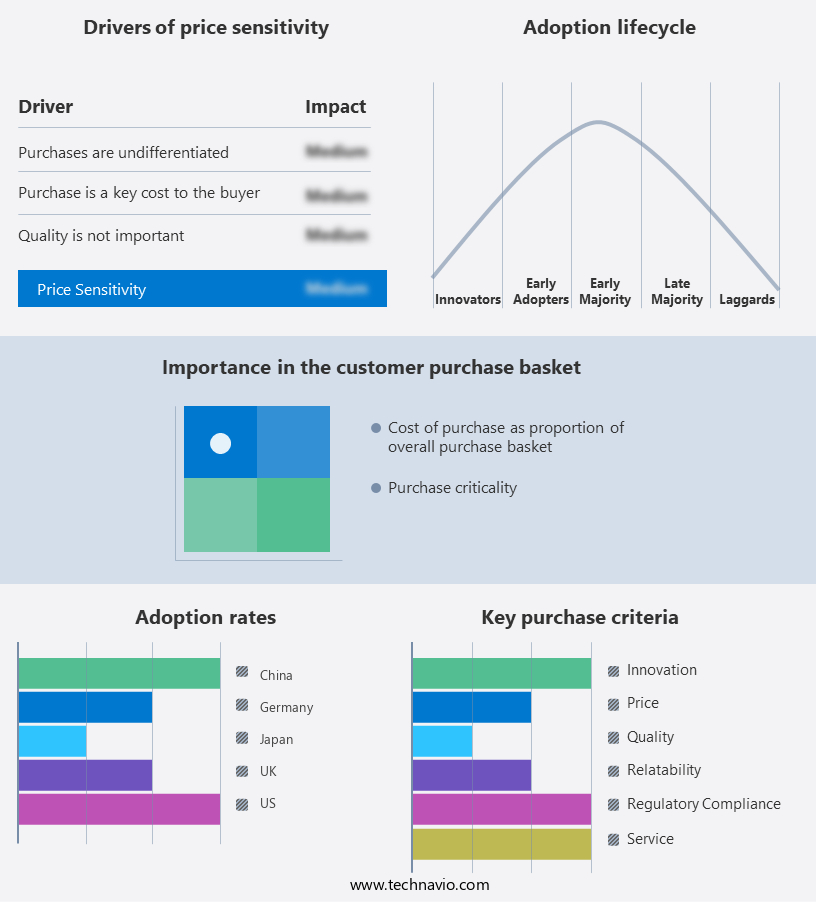
The market forecasting report includes the adoption lifecycle of the market, covering from the innovator's stage to the laggard's stage. It focuses on adoption rates in different regions based on penetration. Furthermore, the market report also includes key purchase criteria and drivers of price sensitivity to help companies evaluate and develop their market growth analysis strategies.

Automotive Pump Market Share by Geography

 Customer Landscape

Key Companies & Market Insights

Companies are implementing various strategies, such as strategic alliances, market forecast, partnerships, mergers and acquisitions, geographical expansion, and product/service launches, to enhance their presence in the market.

The market research and growth report includes detailed analyses of the competitive landscape of the market and information about key companies, including:

  • Bapcor Ltd.
  • BorgWarner Inc.
  • Carter Fuel Systems LLC
  • CHIESI Farmaceutici SpA
  • Concentric AB
  • Continental AG
  • Cummins Inc.
  • DENSO Corp.
  • GMB CORP.
  • Hitachi Ltd.
  • Johnson Electric Holdings Ltd.
  • Mitsubishi Electric Corp.
  • Pricol Ltd.
  • Rheinmetall AG
  • Robert Bosch GmbH
  • SHW AG
  • Stellantis NV
  • TI Fluid Systems Plc
  • Toyota Motor Corp.
  • Valeo SA
  • ZF Friedrichshafen AG

Qualitative and quantitative analysis of companies has been conducted to help clients understand the wider business environment as well as the strengths and weaknesses of key market players. Data is qualitatively analyzed to categorize companies as pure play, category-focused, industry-focused, and diversified; it is quantitatively analyzed to categorize companies as dominant, leading, strong, tentative, and weak.

Research Analyst Overview

The market is witnessing significant growth due to the increasing demand for advanced vehicle sub-systems in both conventional fuel vehicles and electric vehicles (EVs). Strict carbon emission norms in urban areas have led automotive OEMs to focus on reducing emissions from combustion engines by implementing cooling technologies such as electric coolant pumps and inverter cooling. Moreover, the shift towards EVs and vehicle electrification is driving the demand for batteries, electric motors, and pumps, including mechanical and electric pumps.

Moreover, commercial vehicles, such as vans, utility trucks, buses, and trains, also require various types of pumps for their operations. Sensors, microcontrollers, actuators, and other automation technologies are increasingly being integrated into pumps to improve their performance and efficiency. The market is expected to grow further due to the increasing adoption of EVs, stringent environmental laws, and the need for automation in various vehicle systems. The market is also witnessing innovation in cooling technologies for EVs, such as the use of liquefied gases and advanced radiators, to address the unique cooling requirements of EVs.

The Automotive Pump Market is a significant segment of the global industrial pumps industry, driven by the growing demand for advanced vehicle sub-systems in gasoline or diesel passenger cars and electric and hybrid vehicles. The market encompasses various types of pumps, including automotive fuel injection pumps, mechanical pumps, hydraulic steering pumps, electric coolant pumps (EWPS), and electric water pumps. Automotive fuel injection pumps have evolved from mechanical designs to electronic fuel injection (EFI) systems, utilizing microcontrollers for precise fuel delivery. These advancements have led to improved combustion technologies and enhanced vehicle performance. Hydraulic steering pumps and electric power steering systems have also gained popularity, offering better fuel efficiency and driving comfort.

Moreover, the hatchback segment is a significant contributor to the market growth, with the increasing demand for compact and fuel-efficient vehicles. Automatic transmission systems and electric and hybrid vehicles are also driving the market, with the integration of electric water pumps and other vehicle sub-systems. Overall, the Automotive Pump Market is expected to grow steadily, driven by advancements in technology and the increasing demand for fuel-efficient and eco-friendly vehicle solutions.

Automotive Pump Market Scope

Report Coverage

Details

Page number

175

Base year

2023

Historic period

2018-2022

Forecast period

2024-2028

Growth momentum & CAGR

Accelerate at a CAGR of 4.14%

Market growth 2024-2028

USD 3.49 billion

Market structure

Fragmented

YoY growth 2023-2024(%)

3.7

Key countries

US, China, Japan, Germany, and UK

Competitive landscape

Leading Companies, Market Positioning of Companies, Competitive Strategies, and Industry Risks

Request Free Sample

What are the Key Data Covered in this Market Research and Growth Report?

  • CAGR of the market during the forecast period
  • Detailed information on factors that will drive the market growth and forecasting between 2024 and 2028
  • Precise estimation of the size of the market  and its contribution of the market in focus to the parent market
  • Accurate predictions about upcoming market growth and trends and changes in consumer behaviour
  • Growth of the market across Europe, North America, APAC, South America, and Middle East and Africa
  • Thorough analysis of the market's competitive landscape and detailed information about companies
  • Comprehensive analysis of factors that will challenge the growth of market companies

We can help! Our analysts can customize this market research report to meet your requirements. Get in touch

1 Executive Summary

  • 1.1 Market overview
    • Exhibit 01: Executive Summary – Chart on Market Overview
    • Exhibit 02: Executive Summary – Data Table on Market Overview
    • Exhibit 03: Executive Summary – Chart on Global Market Characteristics
    • Exhibit 04: Executive Summary – Chart on Market by Geography
    • Exhibit 05: Executive Summary – Chart on Market Segmentation by Type
    • Exhibit 06: Executive Summary – Chart on Market Segmentation by Application
    • Exhibit 07: Executive Summary – Chart on Incremental Growth
    • Exhibit 08: Executive Summary – Data Table on Incremental Growth
    • Exhibit 09: Executive Summary – Chart on Vendor Market Positioning

2 Market Landscape

  • 2.1 Market ecosystem
    • Exhibit 10: Parent market
    • Exhibit 11: Market Characteristics

3 Market Sizing

  • 3.1 Market definition
    • Exhibit 12: Offerings of vendors included in the market definition
  • 3.2 Market segment analysis
    • Exhibit 13: Market segments
  • 3.3 Market size 2023
    • 3.4 Market outlook: Forecast for 2023-2028
      • Exhibit 14: Chart on Global - Market size and forecast 2023-2028 ($ billion)
      • Exhibit 15: Data Table on Global - Market size and forecast 2023-2028 ($ billion)
      • Exhibit 16: Chart on Global Market: Year-over-year growth 2023-2028 (%)
      • Exhibit 17: Data Table on Global Market: Year-over-year growth 2023-2028 (%)

    4 Historic Market Size

    • 4.1 Global automotive pump market 2018 - 2022
      • Exhibit 18: Historic Market Size – Data Table on global automotive pump market 2018 - 2022 ($ billion)
    • 4.2 Type Segment Analysis 2018 - 2022
      • Exhibit 19: Historic Market Size – Type Segment 2018 - 2022 ($ billion)
    • 4.3 Application Segment Analysis 2018 - 2022
      • Exhibit 20: Historic Market Size – Application Segment 2018 - 2022 ($ billion)
    • 4.4 Geography Segment Analysis 2018 - 2022
      • Exhibit 21: Historic Market Size – Geography Segment 2018 - 2022 ($ billion)
    • 4.5 Country Segment Analysis 2018 - 2022
      • Exhibit 22: Historic Market Size – Country Segment 2018 - 2022 ($ billion)

    5 Five Forces Analysis

    • 5.1 Five forces summary
      • Exhibit 23: Five forces analysis - Comparison between 2023 and 2028
    • 5.2 Bargaining power of buyers
      • Exhibit 24: Chart on Bargaining power of buyers – Impact of key factors 2023 and 2028
    • 5.3 Bargaining power of suppliers
      • Exhibit 25: Bargaining power of suppliers – Impact of key factors in 2023 and 2028
    • 5.4 Threat of new entrants
      • Exhibit 26: Threat of new entrants – Impact of key factors in 2023 and 2028
    • 5.5 Threat of substitutes
      • Exhibit 27: Threat of substitutes – Impact of key factors in 2023 and 2028
    • 5.6 Threat of rivalry
      • Exhibit 28: Threat of rivalry – Impact of key factors in 2023 and 2028
    • 5.7 Market condition
      • Exhibit 29: Chart on Market condition - Five forces 2023 and 2028

    6 Market Segmentation by Type

    • 6.1 Market segments
      • Exhibit 30: Chart on Type - Market share 2023-2028 (%)
      • Exhibit 31: Data Table on Type - Market share 2023-2028 (%)
    • 6.2 Comparison by Type
      • Exhibit 32: Chart on Comparison by Type
      • Exhibit 33: Data Table on Comparison by Type
    • 6.3 Mechanical - Market size and forecast 2023-2028
      • Exhibit 34: Chart on Mechanical - Market size and forecast 2023-2028 ($ billion)
      • Exhibit 35: Data Table on Mechanical - Market size and forecast 2023-2028 ($ billion)
      • Exhibit 36: Chart on Mechanical - Year-over-year growth 2023-2028 (%)
      • Exhibit 37: Data Table on Mechanical - Year-over-year growth 2023-2028 (%)
    • 6.4 Automatic - Market size and forecast 2023-2028
      • Exhibit 38: Chart on Automatic - Market size and forecast 2023-2028 ($ billion)
      • Exhibit 39: Data Table on Automatic - Market size and forecast 2023-2028 ($ billion)
      • Exhibit 40: Chart on Automatic - Year-over-year growth 2023-2028 (%)
      • Exhibit 41: Data Table on Automatic - Year-over-year growth 2023-2028 (%)
    • 6.5 Market opportunity by Type
      • Exhibit 42: Market opportunity by Type ($ billion)
      • Exhibit 43: Data Table on Market opportunity by Type ($ billion)

    7 Market Segmentation by Application

    • 7.1 Market segments
      • Exhibit 44: Chart on Application - Market share 2023-2028 (%)
      • Exhibit 45: Data Table on Application - Market share 2023-2028 (%)
    • 7.2 Comparison by Application
      • Exhibit 46: Chart on Comparison by Application
      • Exhibit 47: Data Table on Comparison by Application
    • 7.3 Passenger cars - Market size and forecast 2023-2028
      • Exhibit 48: Chart on Passenger cars - Market size and forecast 2023-2028 ($ billion)
      • Exhibit 49: Data Table on Passenger cars - Market size and forecast 2023-2028 ($ billion)
      • Exhibit 50: Chart on Passenger cars - Year-over-year growth 2023-2028 (%)
      • Exhibit 51: Data Table on Passenger cars - Year-over-year growth 2023-2028 (%)
    • 7.4 Commercial vehicles - Market size and forecast 2023-2028
      • Exhibit 52: Chart on Commercial vehicles - Market size and forecast 2023-2028 ($ billion)
      • Exhibit 53: Data Table on Commercial vehicles - Market size and forecast 2023-2028 ($ billion)
      • Exhibit 54: Chart on Commercial vehicles - Year-over-year growth 2023-2028 (%)
      • Exhibit 55: Data Table on Commercial vehicles - Year-over-year growth 2023-2028 (%)
    • 7.5 Market opportunity by Application
      • Exhibit 56: Market opportunity by Application ($ billion)
      • Exhibit 57: Data Table on Market opportunity by Application ($ billion)

    8 Customer Landscape

    • 8.1 Customer landscape overview
      • Exhibit 58: Analysis of price sensitivity, lifecycle, customer purchase basket, adoption rates, and purchase criteria

    9 Geographic Landscape

    • 9.1 Geographic segmentation
      • Exhibit 59: Chart on Market share by geography 2023-2028 (%)
      • Exhibit 60: Data Table on Market share by geography 2023-2028 (%)
    • 9.2 Geographic comparison
      • Exhibit 61: Chart on Geographic comparison
      • Exhibit 62: Data Table on Geographic comparison
    • 9.3 Europe - Market size and forecast 2023-2028
      • Exhibit 63: Chart on Europe - Market size and forecast 2023-2028 ($ billion)
      • Exhibit 64: Data Table on Europe - Market size and forecast 2023-2028 ($ billion)
      • Exhibit 65: Chart on Europe - Year-over-year growth 2023-2028 (%)
      • Exhibit 66: Data Table on Europe - Year-over-year growth 2023-2028 (%)
    • 9.4 North America - Market size and forecast 2023-2028
      • Exhibit 67: Chart on North America - Market size and forecast 2023-2028 ($ billion)
      • Exhibit 68: Data Table on North America - Market size and forecast 2023-2028 ($ billion)
      • Exhibit 69: Chart on North America - Year-over-year growth 2023-2028 (%)
      • Exhibit 70: Data Table on North America - Year-over-year growth 2023-2028 (%)
    • 9.5 APAC - Market size and forecast 2023-2028
      • Exhibit 71: Chart on APAC - Market size and forecast 2023-2028 ($ billion)
      • Exhibit 72: Data Table on APAC - Market size and forecast 2023-2028 ($ billion)
      • Exhibit 73: Chart on APAC - Year-over-year growth 2023-2028 (%)
      • Exhibit 74: Data Table on APAC - Year-over-year growth 2023-2028 (%)
    • 9.6 South America - Market size and forecast 2023-2028
      • Exhibit 75: Chart on South America - Market size and forecast 2023-2028 ($ billion)
      • Exhibit 76: Data Table on South America - Market size and forecast 2023-2028 ($ billion)
      • Exhibit 77: Chart on South America - Year-over-year growth 2023-2028 (%)
      • Exhibit 78: Data Table on South America - Year-over-year growth 2023-2028 (%)
    • 9.7 Middle East and Africa - Market size and forecast 2023-2028
      • Exhibit 79: Chart on Middle East and Africa - Market size and forecast 2023-2028 ($ billion)
      • Exhibit 80: Data Table on Middle East and Africa - Market size and forecast 2023-2028 ($ billion)
      • Exhibit 81: Chart on Middle East and Africa - Year-over-year growth 2023-2028 (%)
      • Exhibit 82: Data Table on Middle East and Africa - Year-over-year growth 2023-2028 (%)
    • 9.8 US - Market size and forecast 2023-2028
      • Exhibit 83: Chart on US - Market size and forecast 2023-2028 ($ billion)
      • Exhibit 84: Data Table on US - Market size and forecast 2023-2028 ($ billion)
      • Exhibit 85: Chart on US - Year-over-year growth 2023-2028 (%)
      • Exhibit 86: Data Table on US - Year-over-year growth 2023-2028 (%)
    • 9.9 China - Market size and forecast 2023-2028
      • Exhibit 87: Chart on China - Market size and forecast 2023-2028 ($ billion)
      • Exhibit 88: Data Table on China - Market size and forecast 2023-2028 ($ billion)
      • Exhibit 89: Chart on China - Year-over-year growth 2023-2028 (%)
      • Exhibit 90: Data Table on China - Year-over-year growth 2023-2028 (%)
    • 9.10 Germany - Market size and forecast 2023-2028
      • Exhibit 91: Chart on Germany - Market size and forecast 2023-2028 ($ billion)
      • Exhibit 92: Data Table on Germany - Market size and forecast 2023-2028 ($ billion)
      • Exhibit 93: Chart on Germany - Year-over-year growth 2023-2028 (%)
      • Exhibit 94: Data Table on Germany - Year-over-year growth 2023-2028 (%)
    • 9.11 UK - Market size and forecast 2023-2028
      • Exhibit 95: Chart on UK - Market size and forecast 2023-2028 ($ billion)
      • Exhibit 96: Data Table on UK - Market size and forecast 2023-2028 ($ billion)
      • Exhibit 97: Chart on UK - Year-over-year growth 2023-2028 (%)
      • Exhibit 98: Data Table on UK - Year-over-year growth 2023-2028 (%)
    • 9.12 Japan - Market size and forecast 2023-2028
      • Exhibit 99: Chart on Japan - Market size and forecast 2023-2028 ($ billion)
      • Exhibit 100: Data Table on Japan - Market size and forecast 2023-2028 ($ billion)
      • Exhibit 101: Chart on Japan - Year-over-year growth 2023-2028 (%)
      • Exhibit 102: Data Table on Japan - Year-over-year growth 2023-2028 (%)
    • 9.13 Market opportunity by geography
      • Exhibit 103: Market opportunity by geography ($ billion)
      • Exhibit 104: Data Tables on Market opportunity by geography ($ billion)

    10 Drivers, Challenges, and Trends

    • 10.1 Market drivers
      • 10.2 Market challenges
        • 10.3 Impact of drivers and challenges
          • Exhibit 105: Impact of drivers and challenges in 2023 and 2028
        • 10.4 Market trends

          11 Vendor Landscape

          • 11.1 Overview
            • 11.2 Vendor landscape
              • Exhibit 106: Overview on Criticality of inputs and Factors of differentiation
            • 11.3 Landscape disruption
              • Exhibit 107: Overview on factors of disruption
            • 11.4 Industry risks
              • Exhibit 108: Impact of key risks on business

            12 Vendor Analysis

            • 12.1 Vendors covered
              • Exhibit 109: Vendors covered
            • 12.2 Market positioning of vendors
              • Exhibit 110: Matrix on vendor position and classification
            • 12.3 BorgWarner Inc.
              • Exhibit 111: BorgWarner Inc. - Overview
              • Exhibit 112: BorgWarner Inc. - Business segments
              • Exhibit 113: BorgWarner Inc. - Key news
              • Exhibit 114: BorgWarner Inc. - Key offerings
              • Exhibit 115: BorgWarner Inc. - Segment focus
            • 12.4 Concentric AB
              • Exhibit 116: Concentric AB - Overview
              • Exhibit 117: Concentric AB - Business segments
              • Exhibit 118: Concentric AB - Key offerings
              • Exhibit 119: Concentric AB - Segment focus
            • 12.5 Continental AG
              • Exhibit 120: Continental AG - Overview
              • Exhibit 121: Continental AG - Business segments
              • Exhibit 122: Continental AG - Key news
              • Exhibit 123: Continental AG - Key offerings
              • Exhibit 124: Continental AG - Segment focus
            • 12.6 DENSO Corp.
              • Exhibit 125: DENSO Corp. - Overview
              • Exhibit 126: DENSO Corp. - Business segments
              • Exhibit 127: DENSO Corp. - Key news
              • Exhibit 128: DENSO Corp. - Key offerings
              • Exhibit 129: DENSO Corp. - Segment focus
            • 12.7 Hitachi Ltd.
              • Exhibit 130: Hitachi Ltd. - Overview
              • Exhibit 131: Hitachi Ltd. - Business segments
              • Exhibit 132: Hitachi Ltd. - Key news
              • Exhibit 133: Hitachi Ltd. - Key offerings
              • Exhibit 134: Hitachi Ltd. - Segment focus
            • 12.8 Johnson Electric Holdings Ltd.
              • Exhibit 135: Johnson Electric Holdings Ltd. - Overview
              • Exhibit 136: Johnson Electric Holdings Ltd. - Business segments
              • Exhibit 137: Johnson Electric Holdings Ltd. - Key offerings
              • Exhibit 138: Johnson Electric Holdings Ltd. - Segment focus
            • 12.9 Mitsubishi Electric Corp.
              • Exhibit 139: Mitsubishi Electric Corp. - Overview
              • Exhibit 140: Mitsubishi Electric Corp. - Business segments
              • Exhibit 141: Mitsubishi Electric Corp. - Key news
              • Exhibit 142: Mitsubishi Electric Corp. - Key offerings
              • Exhibit 143: Mitsubishi Electric Corp. - Segment focus
            • 12.10 Pricol Ltd.
              • Exhibit 144: Pricol Ltd. - Overview
              • Exhibit 145: Pricol Ltd. - Product / Service
              • Exhibit 146: Pricol Ltd. - Key offerings
            • 12.11 Rheinmetall AG
              • Exhibit 147: Rheinmetall AG - Overview
              • Exhibit 148: Rheinmetall AG - Business segments
              • Exhibit 149: Rheinmetall AG - Key offerings
              • Exhibit 150: Rheinmetall AG - Segment focus
            • 12.12 Robert Bosch GmbH
              • Exhibit 151: Robert Bosch GmbH - Overview
              • Exhibit 152: Robert Bosch GmbH - Business segments
              • Exhibit 153: Robert Bosch GmbH - Key offerings
              • Exhibit 154: Robert Bosch GmbH - Segment focus
            • 12.13 SHW AG
              • Exhibit 155: SHW AG - Overview
              • Exhibit 156: SHW AG - Product / Service
              • Exhibit 157: SHW AG - Key offerings
            • 12.14 Stellantis NV
              • Exhibit 158: Stellantis NV - Overview
              • Exhibit 159: Stellantis NV - Business segments
              • Exhibit 160: Stellantis NV - Key news
              • Exhibit 161: Stellantis NV - Key offerings
              • Exhibit 162: Stellantis NV - Segment focus
            • 12.15 Toyota Motor Corp.
              • Exhibit 163: Toyota Motor Corp. - Overview
              • Exhibit 164: Toyota Motor Corp. - Business segments
              • Exhibit 165: Toyota Motor Corp. - Key offerings
              • Exhibit 166: Toyota Motor Corp. - Segment focus
            • 12.16 Valeo SA
              • Exhibit 167: Valeo SA - Overview
              • Exhibit 168: Valeo SA - Business segments
              • Exhibit 169: Valeo SA - Key news
              • Exhibit 170: Valeo SA - Key offerings
              • Exhibit 171: Valeo SA - Segment focus
            • 12.17 ZF Friedrichshafen AG
              • Exhibit 172: ZF Friedrichshafen AG - Overview
              • Exhibit 173: ZF Friedrichshafen AG - Business segments
              • Exhibit 174: ZF Friedrichshafen AG - Key news
              • Exhibit 175: ZF Friedrichshafen AG - Key offerings
              • Exhibit 176: ZF Friedrichshafen AG - Segment focus

            13 Appendix

            • 13.1 Scope of the report
              • 13.2 Inclusions and exclusions checklist
                • Exhibit 177: Inclusions checklist
                • Exhibit 178: Exclusions checklist
              • 13.3 Currency conversion rates for US$
                • Exhibit 179: Currency conversion rates for US$
              • 13.4 Research methodology
                • Exhibit 180: Research methodology
                • Exhibit 181: Validation techniques employed for market sizing
                • Exhibit 182: Information sources
              • 13.5 List of abbreviations
                • Exhibit 183: List of abbreviations

              Research Methodology

              Technavio presents a detailed picture of the market by way of study, synthesis, and summation of data from multiple sources. The analysts have presented the various facets of the market with a particular focus on identifying the key industry influencers. The data thus presented is comprehensive, reliable, and the result of extensive research, both primary and secondary.

              INFORMATION SOURCES

              Primary sources

              • Manufacturers and suppliers
              • Channel partners
              • Industry experts
              • Strategic decision makers

              Secondary sources

              • Industry journals and periodicals
              • Government data
              • Financial reports of key industry players
              • Historical data
              • Press releases

              DATA ANALYSIS

              Data Synthesis

              • Collation of data
              • Estimation of key figures
              • Analysis of derived insights

              Data Validation

              • Triangulation with data models
              • Reference against proprietary databases
              • Corroboration with industry experts

              REPORT WRITING

              Qualitative

              • Market drivers
              • Market challenges
              • Market trends
              • Five forces analysis

              Quantitative

              • Market size and forecast
              • Market segmentation
              • Geographical insights
              • Competitive landscape

              Interested in this report?

              Get your sample now to see our research methodology and insights!

              Download Now

              Frequently Asked Questions

              Automotive Pump market growth will increase by $ 3.49 bn during 2024-2028.

              The Automotive Pump market is expected to grow at a CAGR of 4.14% during 2024-2028.

              Automotive Pump market is segmented by Type( Mechanical, Automatic) Application( Passenger cars, Commercial vehicles)

              Bapcor Ltd., BorgWarner Inc., Carter Fuel Systems LLC, CHIESI Farmaceutici SpA, Concentric AB, Continental AG, Cummins Inc., DENSO Corp., GMB CORP., Hitachi Ltd., Johnson Electric Holdings Ltd., Mitsubishi Electric Corp., Pricol Ltd., Rheinmetall AG, Robert Bosch GmbH, SHW AG, Stellantis NV, TI Fluid Systems Plc, Toyota Motor Corp., Valeo SA, ZF Friedrichshafen AG are a few of the key vendors in the Automotive Pump market.

              Europe will register the highest growth rate of 38% among the other regions. Therefore, the Automotive Pump market in Europe is expected to garner significant business opportunities for the vendors during the forecast period.

              US, China, Japan, Germany, UK

              • Growth of automotive industry in emerging economiesThe growth of the automotive industry in emerging economies is one of the primary factors driving the growth of the global automotive pump market. The increase in economic activities in emerging nations has led to the growth of per capita income in these countries. As cities are at the center of economic development is the driving factor this market.
              • increasing economic development has led to the growth of major cities and urbanization. In most cities in developing economies is the driving factor this market.
              • governments cannot meet the growing public transport needs of the population due to the increase in population and lack of transportation facilities. According to the World Bank data is the driving factor this market.
              • the population in China accounted for 1.412 billion in 2021. Likewise is the driving factor this market.
              • the urban population in Indonesia was 2.737 billion in 2021. This has led most urban commuters to purchase cars for convenient commuting is the driving factor this market.
              • resulting in the robust growth of the automotive industry in these countries. Furthermore is the driving factor this market.
              • the inability of the railways to provide last-mile connectivity and the growing popularity of e-commerce sites have led to a rise in sales of heavy CVs for logistics in emerging economies. As automotive pumps play a vital role in ensuring the efficient working of automotive engines is the driving factor this market.
              • the growth of the automotive industry in emerging economies will be a prime factor driving the growth of the global automotive pump market during the forecast period. is the driving factor this market.

              The Automotive Pump market vendors should focus on grabbing business opportunities from the Mechanical segment as it accounted for the largest market share in the base year.