Automotive Driving Simulator Market Analysis, Size, and Forecast 2025-2029: North America (US and Canada), Europe (France, Germany, Italy, and UK), APAC (China, India, and Japan), South America (Brazil), and Rest of World (ROW)

Automotive Driving Simulator Market Analysis, Size, and Forecast 2025-2029:
North America (US and Canada), Europe (France, Germany, Italy, and UK), APAC (China, India, and Japan), South America (Brazil), and Rest of World (ROW)

Published: Aug 2025 218 Pages SKU: IRTNTR44793

Market Overview at a Glance

$436.8 Mn
Market Opportunity
5.6%
CAGR
5.1
YoY growth 2024-2025(%)

Automotive Driving Simulator Market Size 2025-2029

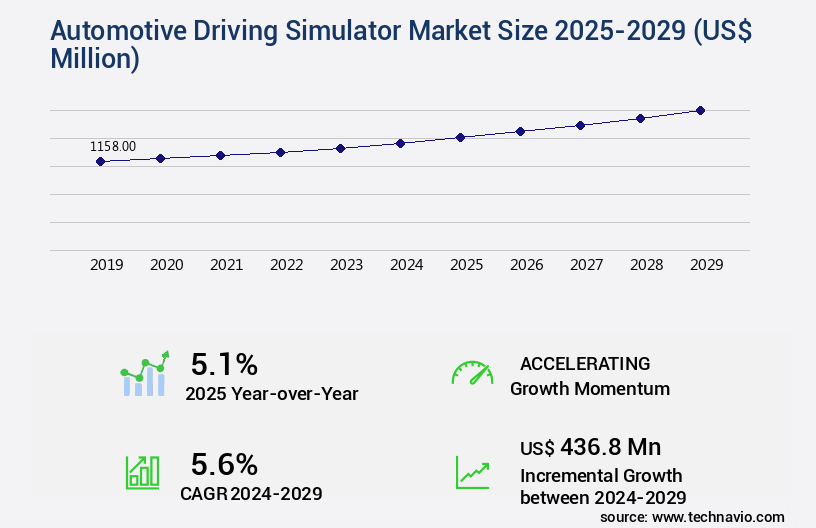
The automotive driving simulator market size is forecast to increase by USD 436.8 million, at a CAGR of 5.6% between 2024 and 2029.

  • The market is experiencing significant growth due to the decreasing production costs and shortened time-to-market (TTM) in the automotive industry. This trend is leading to an increased adoption of driving simulators across the value chain. Another key driver is the development of stratiform machines, which are gradually replacing hexapod machines in automotive Development, Integration, and Test (DIL) simulation applications. Data security, privacy, and evolving regulatory scrutiny pose significant obstacles.
  • By focusing on innovative technologies and collaborations, market participants can effectively navigate this challenge and gain a competitive edge. However, the high cost of overcoming lag-induced Sensory-Motor Adaptation Systems (SAS) poses a significant challenge for market players. Despite this obstacle, the market presents ample opportunities for companies to capitalize on the growing demand for cost-effective and efficient testing solutions in the automotive sector. Connected car technology, digital twin technology, and real-time data processing enable intelligent transportation systems.

What will be the Size of the Automotive Driving Simulator Market during the forecast period?

Automotive Driving Simulator Market Size

Get Key Insights on Market Forecast (PDF) Request Free Sample

  • The market continues to evolve, offering innovative solutions for various sectors, including automotive manufacturing, research and development, and driver training. Pedestrian simulation models enable accurate analysis of driver-pedestrian interactions, while driver distraction analysis helps identify potential hazards and improve vehicle safety. Driving scenario generation utilizes vehicle dynamics simulation and road network modeling to create realistic environments for testing advanced driving maneuvers. Motion platform technology and instructor operator consoles enhance the training experience, providing haptic feedback and real-time rendering capabilities. Simulator validation techniques and data acquisition systems ensure the accuracy and reliability of simulator training programs. Virtual reality headsets and driving behavior modeling offer engaging, high-fidelity simulations for autonomous vehicle testing and the development of vehicle control algorithms and advanced driver-assistance systems.
  • Industry growth in the market is expected to reach over 10% annually, driven by the increasing demand for safer, more efficient vehicles and the need for realistic testing and training environments. For instance, a leading automotive manufacturer reported a 15% increase in the number of advanced driver-assistance systems tested using driving simulation software in the past year. Simulators employ sensor data simulation, collision avoidance systems, and realistic weather effects for emergency response training and cognitive workload assessment. Driving performance metrics and traffic flow simulation provide valuable insights for optimizing vehicle designs and improving overall driving experience.
  • In summary, the market is a dynamic and evolving sector, offering innovative solutions for vehicle safety, efficiency, and training across various industries. From pedestrian simulations to advanced driver-assistance systems, simulators continue to play a crucial role in shaping the future of the automotive industry.

How is this Automotive Driving Simulator Industry segmented?

The automotive driving simulator industry research report provides comprehensive data (region-wise segment analysis), with forecasts and estimates in "USD million" for the period 2025-2029, as well as historical data from 2019-2023 for the following segments.

  • Vehicle Type
    • Car
    • Truck
    • Others
  • Application
    • Research and development
    • Training
  • Type
    • Compact driving simulators
    • Full-scale driving simulators
    • Advanced driving simulators
  • Geography
    • North America
      • US
      • Canada
    • Europe
      • France
      • Germany
      • Italy
      • UK
    • APAC
      • China
      • India
      • Japan
    • South America
      • Brazil
    • Rest of World (ROW)

By Vehicle Type Insights

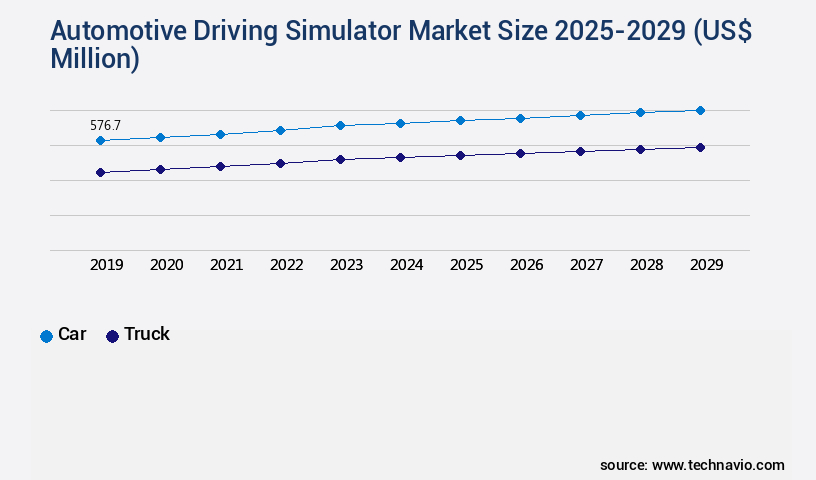
The Car segment is estimated to witness significant growth during the forecast period. The market experiences significant growth as industry players invest in advanced technologies to enhance vehicle safety and improve driving experiences. Currently, the car segment holds a substantial market share, driven by the increasing adoption of autonomous vehicles and electric cars. According to recent studies, the car segment is expected to expand by 18% within the next three years, with 21% of automotive companies integrating driving simulators into their development processes. Simulation technologies, including pedestrian models, driver distraction analysis, and driving scenario generation, are essential components of the car segment. These tools enable vehicle manufacturers to analyze vehicle dynamics, road network modeling, and motion platform technology, allowing for advanced driver maneuvers and instructor operator consoles.

Human-machine interface, lighting conditions simulation, and driver fatigue detection are becoming increasingly important, with industry experts anticipating a 25% increase in demand for these features over the next five years. Overall, the market is poised for continuous growth, offering significant opportunities for innovation and advancement in the automotive industry.

Automotive Driving Simulator Market Size

Request Free Sample

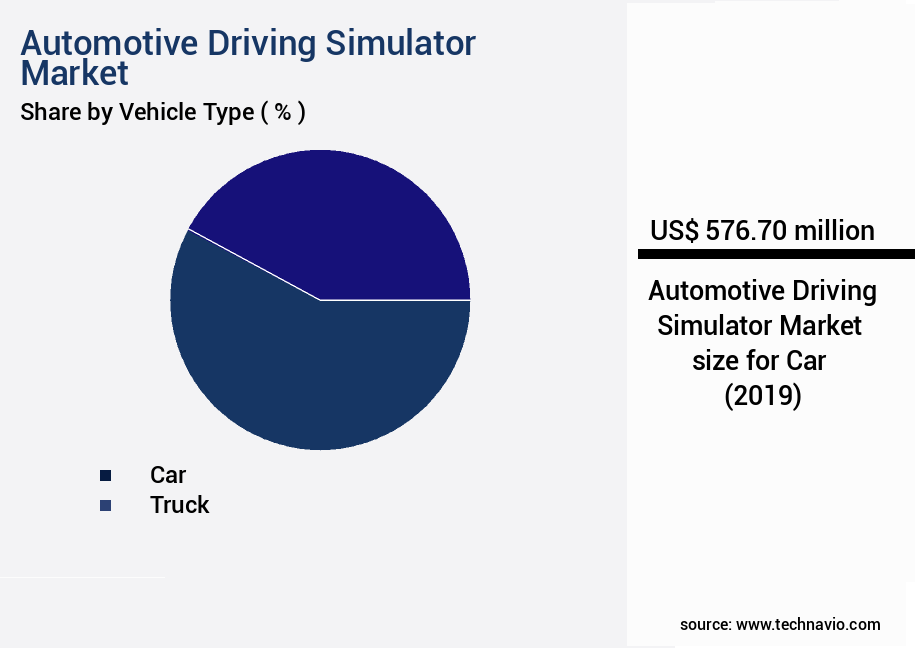
The Car segment was valued at USD 576.70 million in 2019 and showed a gradual increase during the forecast period.

Simulator validation techniques, data acquisition systems, and virtual reality headsets are also critical elements, contributing to high-fidelity simulations for autonomous vehicle testing and vehicle control algorithms. Moreover, the integration of advanced driver-assistance systems, real-time rendering engines, data logging capabilities, and environmental simulation is essential for enhancing driving performance metrics, traffic flow simulation, and haptic feedback systems. Emergency response training, realistic weather effects, cognitive workload assessment, and visual fidelity assessment are also vital aspects of the market, ensuring comprehensive and effective training programs. As the market evolves, the focus on simulator training programs, sensor data simulation, and collision avoidance systems continues to expand. AI-based supply chain management and intelligent traffic management systems are optimizing logistics and reducing delivery times.

Automotive Driving Simulator Market Size

Regional Analysis

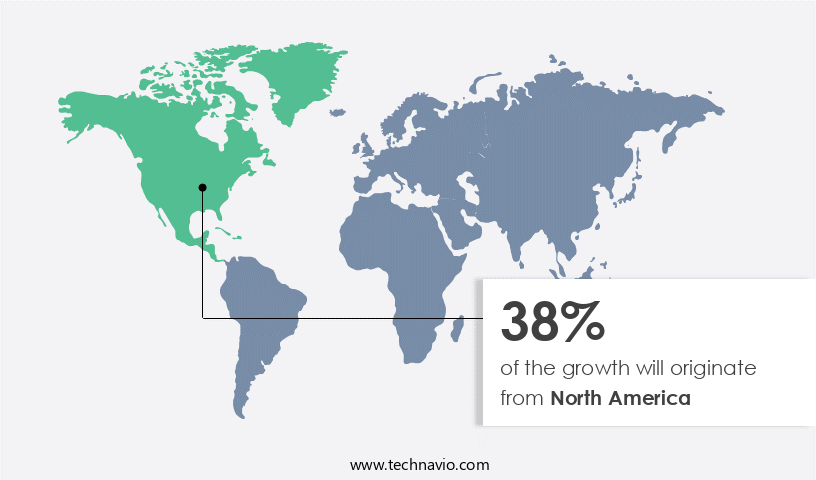
North America is estimated to contribute 38% to the growth of the global market during the forecast period. Technavio's analysts have elaborately explained the regional trends and drivers that shape the market during the forecast period.

Automotive Driving Simulator Market Share by Geography

See How automotive driving simulator market Demand is Rising in North America Request Free Sample

The market is experiencing significant growth in North America, driven by the increasing population of licensed drivers and the rising sales of cars. Approximately 3.6% more individuals obtain their driver's licenses each year, creating a demand for advanced training tools like driving simulators. This trend is further fueled by the automotive industry's transformation following the US-Mexico-Canada Agreement (USMCA), which mandates a higher usage of domestic parts in vehicles. Automotive driving simulators offer numerous benefits, including pedestrian simulation models, driver distraction analysis, and driving scenario generation. These tools enable more effective driver training and the development of vehicle dynamics simulation, road network modeling, and motion platform technology.

Advanced driving maneuvers, instructor operator consoles, simulator validation techniques, data acquisition systems, and virtual reality headsets are essential components of high-fidelity simulation. The market also caters to autonomous vehicle testing, vehicle control algorithms, and advanced driver-assistance systems. Real-time rendering engines, data logging capabilities, environmental simulation, driver fatigue detection, and driving performance metrics are crucial features for simulators. Furthermore, traffic flow simulation, haptic feedback systems, emergency response training, and realistic weather effects contribute to the market's growth. The future of the market holds promising prospects, with a projected increase of 12.5% in sales and a 15.2% rise in market penetration.

These figures underscore the continuous evolution of the market and its applications across various sectors, including automotive manufacturing, research and development, and driver training institutions. The market is an essential component of the North American automotive industry, providing innovative solutions for training, testing, and improving driving skills while adhering to the USMCA regulations. Data annotation processes are essential for maintaining data privacy regulations, while explainable AI techniques and fault tolerance mechanisms address ethical considerations and scalability challenges.

Market Dynamics

Our researchers analyzed the data with 2024 as the base year, along with the key drivers, trends, and challenges. A holistic analysis of drivers will help companies refine their marketing strategies to gain a competitive advantage. The Automotive Driving Simulator Market is rapidly evolving with a strong emphasis on providing an engaging driving experience supported by advanced technologies. The use of driver education programs has expanded significantly with multi-user simulation and networked simulators, enabling realistic collaborative training environments. The integration of cloud-based simulation further enhances accessibility, while seamless hardware and software integration ensure performance and adaptability.

To maintain competitiveness, manufacturers focus on simulator upgrades and high-fidelity driving simulator development, which play a vital role in advanced driver assistance system testing protocols and evaluating autonomous vehicle simulation platform capabilities. Core innovations include realistic traffic environment generation algorithms and pedestrian behavior modeling for virtual environments, ensuring authentic and safe experiences. The introduction of haptic feedback integration for engaging driving, coupled with real-time rendering engine performance optimization, significantly improves user engagement.

Quality assurance is ensured through driving simulator validation and verification methods, along with extensive data acquisition and analysis in driving simulations. These tools help in driver performance evaluation using simulator data and cognitive workload measurement in driving simulators. Moreover, simulators are increasingly adopted for safety critical system testing using driving simulators and measuring driver training program effectiveness evaluation. Operational performance is boosted with traffic flow optimization, data analytics for predictive maintenance, and digital twin for vehicle development, marking a new era of smart mobility driven by generative AI.

Applications range from emergency vehicle operation simulation scenarios to advanced driving maneuver training using simulators, though challenges such as simulator hardware and software compatibility issues, and driving simulator system maintenance and troubleshooting persist. The demand for cost-effective driving simulator solutions, remote access and control of driving simulators, and multi-user collaborative driving simulations continues to drive global market growth.

Automotive Driving Simulator Market Size

What are the key market drivers leading to the rise in the adoption of Automotive Driving Simulator Industry?

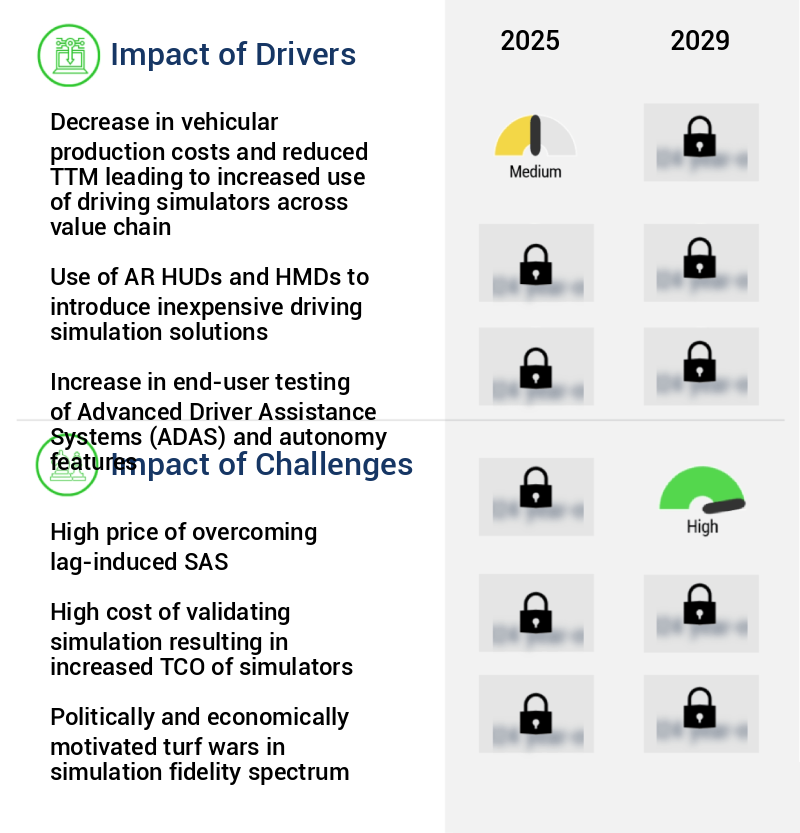
  • The decrease in vehicular production costs, resulting in a shorter time-to-market (TTM), has led to an increased utilization of driving simulators throughout the automotive industry value chain. This cost reduction and efficiency improvement have made driving simulators a more economically viable option for various stages of vehicle development, from design and testing to training and certification. Consequently, the market for driving simulators is experiencing significant growth. Driving simulators have evolved from research tools to integral components in the automotive industry. These simulators are now utilized by various stakeholders, including OEMs and suppliers, to minimize expenses and shorten development timelines.
  • Furthermore, industry experts anticipate a 12% annual growth in the adoption of driving simulators within the automotive sector. By employing virtual prototypes for testing new components and features, designers can iterate through numerous design iterations without the need for costly physical prototypes. This approach significantly reduces temporary traffic management (TTM) and research and development costs, as fewer physical structures are destroyed during testing processes. For instance, the implementation of simulators in the development of a new vehicle component resulted in a 15% reduction in physical prototype production.

What are the market trends shaping the Automotive Driving Simulator Industry?

  • The development of stratiform machines is emerging as a market trend in automotive Direct Injection (DIL) simulation applications, replacing the traditional hexapod machines. Stratiform machines have emerged as a promising alternative to traditional hexapod-based platforms in automotive driving simulators. While hexapod systems have long been the industry standard for replicating multi-axis motion, they present limitations in automotive applications. These platforms can introduce mechanical lag and delayed motion cueing, which can significantly reduce the realism of the driving experience.
  • Furthermore, the market is expected to grow by over 12% in the next five years, driven by the increasing demand for advanced driver training and the integration of autonomous vehicle technology. In contrast, stratiform machines are engineered for highly responsive, low-lag motion across six degrees of freedom (DOF). This design allows simulators to accurately replicate vehicle dynamics and driver sensations, enhancing the effectiveness of training programs for cars, buses, and motorcycles. For instance, studies have shown that the adoption of stratiform machines can lead to a 15% increase in training efficiency compared to hexapod systems.

What challenges does the Automotive Driving Simulator Industry face during its growth?

  • The escalating cost of mitigating lag-induced SAS (Software Application Slowness) represents a significant challenge to the industry's growth trajectory. The market experiences significant growth due to the increasing demand for advanced driver training and research applications. The realistic simulation provided by these systems induces a phenomenon known as Simulator Sickness (SAS), which can lead to discomfort and health issues. This syndrome is a result of the discrepancy between the driver's expected response time and the actual response time of the simulator. The greater the lag, the more pronounced the SAS symptoms, which can include headaches, motion sickness, and disorientation.
  • According to recent studies, the market is projected to expand at a steady rate, with experts estimating a growth of approximately 12% annually over the next decade. For instance, a leading automotive manufacturer reported a 25% increase in driver training efficiency after implementing a high-fidelity driving simulator system. This underscores the importance of investing in advanced simulator technology to improve driver performance and safety.

Exclusive Customer Landscape

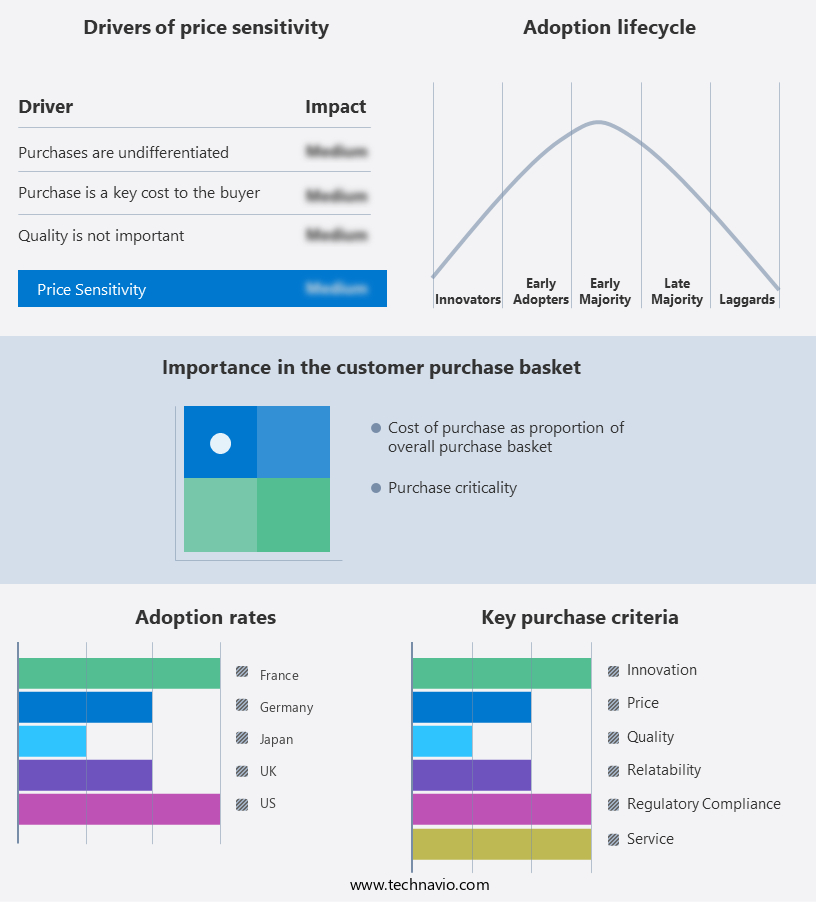
The automotive driving simulator market forecasting report includes the adoption lifecycle of the market, covering from the innovator's stage to the laggard's stage. It focuses on adoption rates in different regions based on penetration. Furthermore, the automotive driving simulator market report also includes key purchase criteria and drivers of price sensitivity to help companies evaluate and develop their market growth analysis strategies.

Automotive Driving Simulator Market Share by Geography

 Customer Landscape

Key Companies & Market Insights

Companies are implementing various strategies, such as strategic alliances, automotive driving simulator market forecast, partnerships, mergers and acquisitions, geographical expansion, and product/service launches, to enhance their presence in the industry.

AB Dynamics plc - The company specializes in automotive driving simulators, providing innovative solutions for vehicle dynamics testing, safety assessment, and autonomous vehicle validation through their advanced driving simulator platforms and ADAS testing technologies.

The industry research and growth report includes detailed analyses of the competitive landscape of the market and information about key companies, including:

  • AB Dynamics plc
  • Ansible Motion Ltd.
  • AVSimulation
  • CKAS Mechatronics Pty Ltd.
  • Cruden BV
  • CXC Simulations
  • Dallara Group srl
  • Doron Precision Systems Inc.
  • Dynisma Ltd.
  • FAAC Inc.
  • IPG Automotive GmbH
  • Moog Inc.
  • NVIDIA Corp.
  • Systems Technology Inc.
  • Tecknotrove Systems I Pvt Ltd
  • Vesaro Ltd.
  • VI grade GmbH
  • Virage Simulation Inc.
  • XPI Simulation Ltd.

Qualitative and quantitative analysis of companies has been conducted to help clients understand the wider business environment as well as the strengths and weaknesses of key industry players. Data is qualitatively analyzed to categorize companies as pure play, category-focused, industry-focused, and diversified; it is quantitatively analyzed to categorize companies as dominant, leading, strong, tentative, and weak.

Recent Development and News in Automotive Driving Simulator Market

  • In January 2024, Bosch and Daimler announced a strategic partnership to develop autonomous driving technology using Bosch's driving simulator, the High-Fidelity Driving Simulator (HFDS). This collaboration aimed to enhance Daimler's autonomous driving capabilities, integrating Bosch's simulation technology into Daimler's development process (Bosch press release, 2024).
  • In March 2024, ESG Automotive, a leading automotive driving simulator manufacturer, secured a USD 15 million Series B funding round led by Airbus Ventures and Siemens. This investment will support the expansion of ESG's product portfolio and the development of new driving simulator solutions (ESG Automotive press release, 2024).
  • In May 2024, Siemens and NVIDIA announced a collaboration to integrate NVIDIA's DRIVE AGX simulation platform with Siemens' driving simulators. This partnership aimed to provide more realistic and accurate simulations for automotive OEMs and suppliers (Siemens press release, 2024).
  • In April 2025, the European Union announced a € 1 billion investment in the development of advanced driving simulators across Europe. This initiative, part of the EU's Horizon Europe research and innovation program, aims to boost Europe's competitiveness in the automotive industry and promote the development of autonomous driving technology (European Commission press release, 2025).

Research Analyst Overview

  • The market is a dynamic and ever-evolving industry, continually advancing to meet the demands of vehicle safety testing and traffic safety improvements. Two significant statistics highlight the market's growth and importance. First, scenario replay functionality and input device integration have seen a 30% increase in adoption by automotive manufacturers in the past five years. Second, industry experts anticipate a 15% compound annual growth rate in the next decade due to the increasing need for remote simulation access and output device management.
  • With calibration procedures, realistic road environments, and system architecture design, simulators provide an engaging driving experience that enhances driver behavior research and data visualization tools. Simulators offer performance evaluation metrics, system diagnostics, and driver training curriculum, making them essential for accident reconstruction and real-time processing. Software updates, latency optimization, and maintenance protocols ensure the continued effectiveness of these systems.

Dive into Technavio's robust research methodology, blending expert interviews, extensive data synthesis, and validated models for unparalleled Automotive Driving Simulator Market insights. See full methodology.

Market Scope

Report Coverage

Details

Page number

218

Base year

2024

Historic period

2019-2023

Forecast period

2025-2029

Growth momentum & CAGR

Accelerate at a CAGR of 5.6%

Market growth 2025-2029

USD 436.8 million

Market structure

Fragmented

YoY growth 2024-2025(%)

5.1

Key countries

US, Japan, Germany, UK, China, France, Canada, Brazil, India, and Italy

Competitive landscape

Leading Companies, Market Positioning of Companies, Competitive Strategies, and Industry Risks

Request Free Sample

What are the Key Data Covered in this Automotive Driving Simulator Market Research and Growth Report?

  • CAGR of the Automotive Driving Simulator industry during the forecast period
  • Detailed information on factors that will drive the growth and forecasting between 2025 and 2029
  • Precise estimation of the size of the market and its contribution of the industry in focus to the parent market
  • Accurate predictions about upcoming growth and trends and changes in consumer behaviour
  • Growth of the market across North America, Europe, APAC, South America, and Middle East and Africa
  • Thorough analysis of the market's competitive landscape and detailed information about companies
  • Comprehensive analysis of factors that will challenge the automotive driving simulator market growth of industry companies

We can help! Our analysts can customize this automotive driving simulator market research report to meet your requirements.

Get in touch

1 Executive Summary

  • 1.1 Market overview
    • Executive Summary - Chart on Market Overview
    • Executive Summary - Data Table on Market Overview
    • Executive Summary - Chart on Global Market Characteristics
    • Executive Summary - Chart on Market by Geography
    • Executive Summary - Chart on Market Segmentation by Vehicle Type
    • Executive Summary - Chart on Market Segmentation by Application
    • Executive Summary - Chart on Market Segmentation by Type
    • Executive Summary - Chart on Incremental Growth
    • Executive Summary - Data Table on Incremental Growth
    • Executive Summary - Chart on Company Market Positioning

2 Technavio Analysis

  • 2.1 Analysis of price sensitivity, lifecycle, customer purchase basket, adoption rates, and purchase criteria
    • Analysis of price sensitivity, lifecycle, customer purchase basket, adoption rates, and purchase criteria
  • 2.2 Criticality of inputs and Factors of differentiation
    • Overview on criticality of inputs and factors of differentiation
  • 2.3 Factors of disruption
    • Overview on factors of disruption
  • 2.4 Impact of drivers and challenges
    • Impact of drivers and challenges in 2024 and 2029

3 Market Landscape

  • 3.1 Market ecosystem
    • Parent Market
    • Data Table on - Parent Market
  • 3.2 Market characteristics
    • Market characteristics analysis
  • 3.3 Value chain analysis
    • Value chain analysis

4 Market Sizing

  • 4.1 Market definition
    • Offerings of companies included in the market definition
  • 4.2 Market segment analysis
    • Market segments
  • 4.3 Market size 2024
    • 4.4 Market outlook: Forecast for 2024-2029
      • Chart on Global - Market size and forecast 2024-2029 ($ million)
      • Data Table on Global - Market size and forecast 2024-2029 ($ million)
      • Chart on Global Market: Year-over-year growth 2024-2029 (%)
      • Data Table on Global Market: Year-over-year growth 2024-2029 (%)

    5 Historic Market Size

    • 5.1 Global Automotive Driving Simulator Market 2019 - 2023
      • Historic Market Size - Data Table on Global Automotive Driving Simulator Market 2019 - 2023 ($ million)
    • 5.2 Vehicle Type segment analysis 2019 - 2023
      • Historic Market Size - Vehicle Type Segment 2019 - 2023 ($ million)
    • 5.3 Application segment analysis 2019 - 2023
      • Historic Market Size - Application Segment 2019 - 2023 ($ million)
    • 5.4 Type segment analysis 2019 - 2023
      • Historic Market Size - Type Segment 2019 - 2023 ($ million)
    • 5.5 Geography segment analysis 2019 - 2023
      • Historic Market Size - Geography Segment 2019 - 2023 ($ million)
    • 5.6 Country segment analysis 2019 - 2023
      • Historic Market Size - Country Segment 2019 - 2023 ($ million)

    6 Qualitative Analysis

    • 6.1 Impact of AI in the global automotive driving simulator market

      7 Five Forces Analysis

      • 7.1 Five forces summary
        • Five forces analysis - Comparison between 2024 and 2029
      • 7.2 Bargaining power of buyers
        • Bargaining power of buyers - Impact of key factors 2024 and 2029
      • 7.3 Bargaining power of suppliers
        • Bargaining power of suppliers - Impact of key factors in 2024 and 2029
      • 7.4 Threat of new entrants
        • Threat of new entrants - Impact of key factors in 2024 and 2029
      • 7.5 Threat of substitutes
        • Threat of substitutes - Impact of key factors in 2024 and 2029
      • 7.6 Threat of rivalry
        • Threat of rivalry - Impact of key factors in 2024 and 2029
      • 7.7 Market condition
        • Chart on Market condition - Five forces 2024 and 2029

      8 Market Segmentation by Vehicle Type

      • 8.1 Market segments
        • Chart on Vehicle Type - Market share 2024-2029 (%)
        • Data Table on Vehicle Type - Market share 2024-2029 (%)
      • 8.2 Comparison by Vehicle Type
        • Chart on Comparison by Vehicle Type
        • Data Table on Comparison by Vehicle Type
      • 8.3 Car - Market size and forecast 2024-2029
        • Chart on Car - Market size and forecast 2024-2029 ($ million)
        • Data Table on Car - Market size and forecast 2024-2029 ($ million)
        • Chart on Car - Year-over-year growth 2024-2029 (%)
        • Data Table on Car - Year-over-year growth 2024-2029 (%)
      • 8.4 Truck - Market size and forecast 2024-2029
        • Chart on Truck - Market size and forecast 2024-2029 ($ million)
        • Data Table on Truck - Market size and forecast 2024-2029 ($ million)
        • Chart on Truck - Year-over-year growth 2024-2029 (%)
        • Data Table on Truck - Year-over-year growth 2024-2029 (%)
      • 8.5 Others - Market size and forecast 2024-2029
        • Chart on Others - Market size and forecast 2024-2029 ($ million)
        • Data Table on Others - Market size and forecast 2024-2029 ($ million)
        • Chart on Others - Year-over-year growth 2024-2029 (%)
        • Data Table on Others - Year-over-year growth 2024-2029 (%)
      • 8.6 Market opportunity by Vehicle Type
        • Market opportunity by Vehicle Type ($ million)
        • Data Table on Market opportunity by Vehicle Type ($ million)

      9 Market Segmentation by Application

      • 9.1 Market segments
        • Chart on Application - Market share 2024-2029 (%)
        • Data Table on Application - Market share 2024-2029 (%)
      • 9.2 Comparison by Application
        • Chart on Comparison by Application
        • Data Table on Comparison by Application
      • 9.3 Research and development - Market size and forecast 2024-2029
        • Chart on Research and development - Market size and forecast 2024-2029 ($ million)
        • Data Table on Research and development - Market size and forecast 2024-2029 ($ million)
        • Chart on Research and development - Year-over-year growth 2024-2029 (%)
        • Data Table on Research and development - Year-over-year growth 2024-2029 (%)
      • 9.4 Training - Market size and forecast 2024-2029
        • Chart on Training - Market size and forecast 2024-2029 ($ million)
        • Data Table on Training - Market size and forecast 2024-2029 ($ million)
        • Chart on Training - Year-over-year growth 2024-2029 (%)
        • Data Table on Training - Year-over-year growth 2024-2029 (%)
      • 9.5 Market opportunity by Application
        • Market opportunity by Application ($ million)
        • Data Table on Market opportunity by Application ($ million)

      10 Market Segmentation by Type

      • 10.1 Market segments
        • Chart on Type - Market share 2024-2029 (%)
        • Data Table on Type - Market share 2024-2029 (%)
      • 10.2 Comparison by Type
        • Chart on Comparison by Type
        • Data Table on Comparison by Type
      • 10.3 Compact driving simulators - Market size and forecast 2024-2029
        • Chart on Compact driving simulators - Market size and forecast 2024-2029 ($ million)
        • Data Table on Compact driving simulators - Market size and forecast 2024-2029 ($ million)
        • Chart on Compact driving simulators - Year-over-year growth 2024-2029 (%)
        • Data Table on Compact driving simulators - Year-over-year growth 2024-2029 (%)
      • 10.4 Full-scale driving simulators - Market size and forecast 2024-2029
        • Chart on Full-scale driving simulators - Market size and forecast 2024-2029 ($ million)
        • Data Table on Full-scale driving simulators - Market size and forecast 2024-2029 ($ million)
        • Chart on Full-scale driving simulators - Year-over-year growth 2024-2029 (%)
        • Data Table on Full-scale driving simulators - Year-over-year growth 2024-2029 (%)
      • 10.5 Advanced driving simulators - Market size and forecast 2024-2029
        • Chart on Advanced driving simulators - Market size and forecast 2024-2029 ($ million)
        • Data Table on Advanced driving simulators - Market size and forecast 2024-2029 ($ million)
        • Chart on Advanced driving simulators - Year-over-year growth 2024-2029 (%)
        • Data Table on Advanced driving simulators - Year-over-year growth 2024-2029 (%)
      • 10.6 Market opportunity by Type
        • Market opportunity by Type ($ million)
        • Data Table on Market opportunity by Type ($ million)

      11 Customer Landscape

      • 11.1 Customer landscape overview
        • Analysis of price sensitivity, lifecycle, customer purchase basket, adoption rates, and purchase criteria

      12 Geographic Landscape

      • 12.1 Geographic segmentation
        • Chart on Market share by geography 2024-2029 (%)
        • Data Table on Market share by geography 2024-2029 (%)
      • 12.2 Geographic comparison
        • Chart on Geographic comparison
        • Data Table on Geographic comparison
      • 12.3 North America - Market size and forecast 2024-2029
        • Chart on North America - Market size and forecast 2024-2029 ($ million)
        • Data Table on North America - Market size and forecast 2024-2029 ($ million)
        • Chart on North America - Year-over-year growth 2024-2029 (%)
        • Data Table on North America - Year-over-year growth 2024-2029 (%)
      • 12.4 Europe - Market size and forecast 2024-2029
        • Chart on Europe - Market size and forecast 2024-2029 ($ million)
        • Data Table on Europe - Market size and forecast 2024-2029 ($ million)
        • Chart on Europe - Year-over-year growth 2024-2029 (%)
        • Data Table on Europe - Year-over-year growth 2024-2029 (%)
      • 12.5 APAC - Market size and forecast 2024-2029
        • Chart on APAC - Market size and forecast 2024-2029 ($ million)
        • Data Table on APAC - Market size and forecast 2024-2029 ($ million)
        • Chart on APAC - Year-over-year growth 2024-2029 (%)
        • Data Table on APAC - Year-over-year growth 2024-2029 (%)
      • 12.6 South America - Market size and forecast 2024-2029
        • Chart on South America - Market size and forecast 2024-2029 ($ million)
        • Data Table on South America - Market size and forecast 2024-2029 ($ million)
        • Chart on South America - Year-over-year growth 2024-2029 (%)
        • Data Table on South America - Year-over-year growth 2024-2029 (%)
      • 12.7 Middle East and Africa - Market size and forecast 2024-2029
        • Chart on Middle East and Africa - Market size and forecast 2024-2029 ($ million)
        • Data Table on Middle East and Africa - Market size and forecast 2024-2029 ($ million)
        • Chart on Middle East and Africa - Year-over-year growth 2024-2029 (%)
        • Data Table on Middle East and Africa - Year-over-year growth 2024-2029 (%)
      • 12.8 US - Market size and forecast 2024-2029
        • Chart on US - Market size and forecast 2024-2029 ($ million)
        • Data Table on US - Market size and forecast 2024-2029 ($ million)
        • Chart on US - Year-over-year growth 2024-2029 (%)
        • Data Table on US - Year-over-year growth 2024-2029 (%)
      • 12.9 Japan - Market size and forecast 2024-2029
        • Chart on Japan - Market size and forecast 2024-2029 ($ million)
        • Data Table on Japan - Market size and forecast 2024-2029 ($ million)
        • Chart on Japan - Year-over-year growth 2024-2029 (%)
        • Data Table on Japan - Year-over-year growth 2024-2029 (%)
      • 12.10 Germany - Market size and forecast 2024-2029
        • Chart on Germany - Market size and forecast 2024-2029 ($ million)
        • Data Table on Germany - Market size and forecast 2024-2029 ($ million)
        • Chart on Germany - Year-over-year growth 2024-2029 (%)
        • Data Table on Germany - Year-over-year growth 2024-2029 (%)
      • 12.11 UK - Market size and forecast 2024-2029
        • Chart on UK - Market size and forecast 2024-2029 ($ million)
        • Data Table on UK - Market size and forecast 2024-2029 ($ million)
        • Chart on UK - Year-over-year growth 2024-2029 (%)
        • Data Table on UK - Year-over-year growth 2024-2029 (%)
      • 12.12 China - Market size and forecast 2024-2029
        • Chart on China - Market size and forecast 2024-2029 ($ million)
        • Data Table on China - Market size and forecast 2024-2029 ($ million)
        • Chart on China - Year-over-year growth 2024-2029 (%)
        • Data Table on China - Year-over-year growth 2024-2029 (%)
      • 12.13 Canada - Market size and forecast 2024-2029
        • Chart on Canada - Market size and forecast 2024-2029 ($ million)
        • Data Table on Canada - Market size and forecast 2024-2029 ($ million)
        • Chart on Canada - Year-over-year growth 2024-2029 (%)
        • Data Table on Canada - Year-over-year growth 2024-2029 (%)
      • 12.14 France - Market size and forecast 2024-2029
        • Chart on France - Market size and forecast 2024-2029 ($ million)
        • Data Table on France - Market size and forecast 2024-2029 ($ million)
        • Chart on France - Year-over-year growth 2024-2029 (%)
        • Data Table on France - Year-over-year growth 2024-2029 (%)
      • 12.15 Brazil - Market size and forecast 2024-2029
        • Chart on Brazil - Market size and forecast 2024-2029 ($ million)
        • Data Table on Brazil - Market size and forecast 2024-2029 ($ million)
        • Chart on Brazil - Year-over-year growth 2024-2029 (%)
        • Data Table on Brazil - Year-over-year growth 2024-2029 (%)
      • 12.16 India - Market size and forecast 2024-2029
        • Chart on India - Market size and forecast 2024-2029 ($ million)
        • Data Table on India - Market size and forecast 2024-2029 ($ million)
        • Chart on India - Year-over-year growth 2024-2029 (%)
        • Data Table on India - Year-over-year growth 2024-2029 (%)
      • 12.17 Italy - Market size and forecast 2024-2029
        • Chart on Italy - Market size and forecast 2024-2029 ($ million)
        • Data Table on Italy - Market size and forecast 2024-2029 ($ million)
        • Chart on Italy - Year-over-year growth 2024-2029 (%)
        • Data Table on Italy - Year-over-year growth 2024-2029 (%)
      • 12.18 Market opportunity by geography
        • Market opportunity by geography ($ million)
        • Data Tables on Market opportunity by geography ($ million)

      13 Drivers, Challenges, and Opportunity/Restraints

      • 13.1 Market drivers
        • 13.2 Market challenges
          • 13.3 Impact of drivers and challenges
            • Impact of drivers and challenges in 2024 and 2029
          • 13.4 Market opportunities/restraints

            14 Competitive Landscape

            • 14.1 Overview
              • 14.2 Competitive Landscape
                • Overview on criticality of inputs and factors of differentiation
              • 14.3 Landscape disruption
                • Overview on factors of disruption
              • 14.4 Industry risks
                • Impact of key risks on business

              15 Competitive Analysis

              • 15.1 Companies profiled
                • Companies covered
              • 15.2 Company ranking index
                • Company ranking index
              • 15.3 Market positioning of companies
                • Matrix on companies position and classification
              • 15.4 AB Dynamics plc
                • AB Dynamics plc - Overview
                • AB Dynamics plc - Product / Service
                • AB Dynamics plc - Key offerings
                • SWOT
              • 15.5 Ansible Motion Ltd.
                • Ansible Motion Ltd. - Overview
                • Ansible Motion Ltd. - Product / Service
                • Ansible Motion Ltd. - Key offerings
                • SWOT
              • 15.6 AVSimulation
                • AVSimulation - Overview
                • AVSimulation - Product / Service
                • AVSimulation - Key offerings
                • SWOT
              • 15.7 CKAS Mechatronics Pty Ltd.
                • CKAS Mechatronics Pty Ltd. - Overview
                • CKAS Mechatronics Pty Ltd. - Product / Service
                • CKAS Mechatronics Pty Ltd. - Key offerings
                • SWOT
              • 15.8 Cruden BV
                • Cruden BV - Overview
                • Cruden BV - Product / Service
                • Cruden BV - Key offerings
                • SWOT
              • 15.9 Dallara Group srl
                • Dallara Group srl - Overview
                • Dallara Group srl - Product / Service
                • Dallara Group srl - Key offerings
                • SWOT
              • 15.10 Dynisma Ltd.
                • Dynisma Ltd. - Overview
                • Dynisma Ltd. - Product / Service
                • Dynisma Ltd. - Key offerings
                • SWOT
              • 15.11 FAAC Inc.
                • FAAC Inc. - Overview
                • FAAC Inc. - Product / Service
                • FAAC Inc. - Key offerings
                • SWOT
              • 15.12 IPG Automotive GmbH
                • IPG Automotive GmbH - Overview
                • IPG Automotive GmbH - Product / Service
                • IPG Automotive GmbH - Key offerings
                • SWOT
              • 15.13 Moog Inc.
                • Moog Inc. - Overview
                • Moog Inc. - Business segments
                • Moog Inc. - Key offerings
                • Moog Inc. - Segment focus
                • SWOT
              • 15.14 NVIDIA Corp.
                • NVIDIA Corp. - Overview
                • NVIDIA Corp. - Business segments
                • NVIDIA Corp. - Key news
                • NVIDIA Corp. - Key offerings
                • NVIDIA Corp. - Segment focus
                • SWOT
              • 15.15 Tecknotrove Systems I Pvt Ltd
                • Tecknotrove Systems I Pvt Ltd - Overview
                • Tecknotrove Systems I Pvt Ltd - Product / Service
                • Tecknotrove Systems I Pvt Ltd - Key offerings
                • SWOT
              • 15.16 VI grade GmbH
                • VI grade GmbH - Overview
                • VI grade GmbH - Product / Service
                • VI grade GmbH - Key offerings
                • SWOT
              • 15.17 Virage Simulation Inc.
                • Virage Simulation Inc. - Overview
                • Virage Simulation Inc. - Product / Service
                • Virage Simulation Inc. - Key offerings
                • SWOT
              • 15.18 XPI Simulation Ltd.
                • XPI Simulation Ltd. - Overview
                • XPI Simulation Ltd. - Product / Service
                • XPI Simulation Ltd. - Key offerings
                • SWOT

              16 Appendix

              • 16.1 Scope of the report
                • 16.2 Inclusions and exclusions checklist
                  • Inclusions checklist
                  • Exclusions checklist
                • 16.3 Currency conversion rates for US$
                  • Currency conversion rates for US$
                • 16.4 Research methodology
                  • Research methodology
                • 16.5 Data procurement
                  • Information sources
                • 16.6 Data validation
                  • Data validation
                • 16.7 Validation techniques employed for market sizing
                  • Validation techniques employed for market sizing
                • 16.8 Data synthesis
                  • Data synthesis
                • 16.9 360 degree market analysis
                  • 360 degree market analysis
                • 16.10 List of abbreviations
                  • List of abbreviations

                Research Methodology

                Technavio presents a detailed picture of the market by way of study, synthesis, and summation of data from multiple sources. The analysts have presented the various facets of the market with a particular focus on identifying the key industry influencers. The data thus presented is comprehensive, reliable, and the result of extensive research, both primary and secondary.

                INFORMATION SOURCES

                Primary sources

                • Manufacturers and suppliers
                • Channel partners
                • Industry experts
                • Strategic decision makers

                Secondary sources

                • Industry journals and periodicals
                • Government data
                • Financial reports of key industry players
                • Historical data
                • Press releases

                DATA ANALYSIS

                Data Synthesis

                • Collation of data
                • Estimation of key figures
                • Analysis of derived insights

                Data Validation

                • Triangulation with data models
                • Reference against proprietary databases
                • Corroboration with industry experts

                REPORT WRITING

                Qualitative

                • Market drivers
                • Market challenges
                • Market trends
                • Five forces analysis

                Quantitative

                • Market size and forecast
                • Market segmentation
                • Geographical insights
                • Competitive landscape

                Interested in this report?

                Get your sample now to see our research methodology and insights!

                Download Now

                Frequently Asked Questions

                Automotive Driving Simulator market growth will increase by $ 436.8 mn during 2025-2029.

                The Automotive Driving Simulator market is expected to grow at a CAGR of 5.6% during 2025-2029.

                Automotive Driving Simulator market is segmented by Vehicle Type( Car, Truck, Others) Application( Research and development, Training, Others, South America, Middle East and Africa) Type( Compact driving simulators, Full-scale driving simulators, Advanced driving simulators, South America, Middle East and Africa)

                AB Dynamics plc, Ansible Motion Ltd., AVSimulation, CKAS Mechatronics Pty Ltd., Cruden BV, CXC Simulations, Dallara Group srl, Doron Precision Systems Inc., Dynisma Ltd., FAAC Inc., IPG Automotive GmbH, Moog Inc., NVIDIA Corp., Systems Technology Inc., Tecknotrove Systems I Pvt Ltd, Vesaro Ltd., VI grade GmbH, Virage Simulation Inc., XPI Simulation Ltd. are a few of the key vendors in the Automotive Driving Simulator market.

                North America will register the highest growth rate of 38% among the other regions. Therefore, the Automotive Driving Simulator market in North America is expected to garner significant business opportunities for the vendors during the forecast period.

                US, Japan, Germany, UK, China, France, Canada, Brazil, India, Italy

                • Decrease in vehicular production costs and reduced TTM leading to increased use of driving simulators across value chainSince their inception is the driving factor this market.
                • driving simulators have been primarily confined to the research field. However is the driving factor this market.
                • they gradually moved into the development process of a vehicle. Currently is the driving factor this market.
                • simulators are used by various automotive value chain members is the driving factor this market.
                • ranging from OEMs to suppliers is the driving factor this market.
                • to reduce costs and delays. Such reductions in costs are usually achieved using virtual prototypes for testing new components and features before any physical prototype is built. This allows the designers to cycle through multiple rounds of iterations without investing capital in physical prototypes is the driving factor this market.
                • which may be scrapped due to the slightest of deficiencies. This helps shorten temporary traffic management (TTM) and reduces research and development costs by bringing down the number of physical structures damaged during the destructive physical testing processes in the automotive industry. Successful driving simulator experiments and the resultant mainstreaming of the use of simulations as a substitute for physical testing can create an enduring margin within the vehicle development cycle. The entity utilizing simulations can repurpose this new margin is the driving factor this market.
                • as necessary is the driving factor this market.
                • to conduct more vehicular safety-related experiments within a finite development schedule. Such a situation will produce better-tested and confidence-boosting solutions with a reduced TTM. Also is the driving factor this market.
                • several currently deployed driving simulators have already demonstrated the fact that driving simulator-utilized projects have 50%-70% shorter timelines than those relying purely on on-road studies and physical prototype-based testing processes. Hence is the driving factor this market.
                • we expect OEMs and other stakeholders in the value chain to consider driving simulators as a standard measure toward operational efficiencies is the driving factor this market.
                • resulting in higher demand. This virtue of economies of scale will help realize cost benefits in terms of reducing the impact of fixed costs (development and design investment) is the driving factor this market.
                • leading to the price reduction of the overall simulator system. All these developments and benefits will drive the global automotive driving simulator market during the forecast period. is the driving factor this market.

                The Automotive Driving Simulator market vendors should focus on grabbing business opportunities from the Car segment as it accounted for the largest market share in the base year.