Automotive Clutch Market Analysis APAC, North America, Europe, South America, Middle East and Africa - US, China, Japan, UK, France - Size and Forecast 2024-2028

Automotive Clutch Market Analysis APAC, North America, Europe, South America, Middle East and Africa - US, China, Japan, UK, France - Size and Forecast 2024-2028

Published: Feb 2024 163 Pages SKU: IRTNTR77534

Market Overview at a Glance

$4.49 B
Market Opportunity
5.78%
CAGR
5.25
YoY growth 2023-2024(%)

Automotive Clutch Market Size 2024-2028 

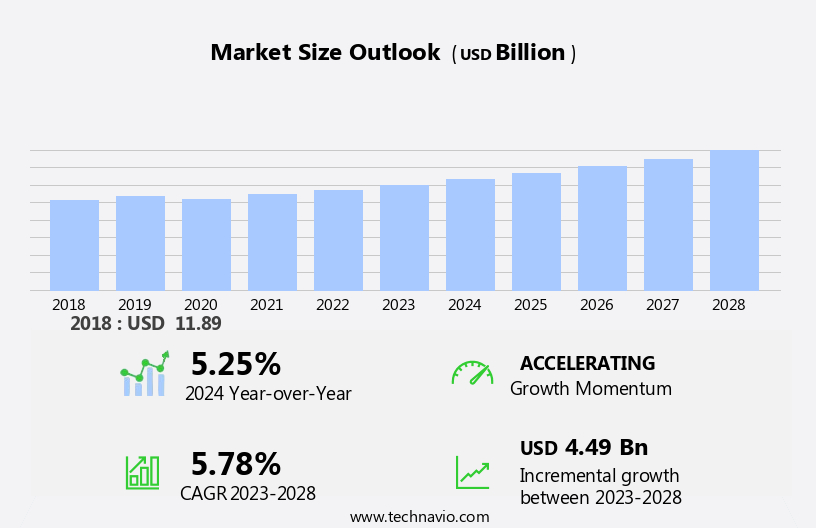
The automotive clutch market size is forecast to increase by USD 4.49 billion at a CAGR of 5.78% between 2023 and 2028. The market is experiencing significant growth due to several key factors. Rising disposable incomes and a shift in consumer preferences towards advanced vehicles are driving the demand for sophisticated transmission systems, such as Fully Automatic Transmissions (FATs), Automated Manual Transmissions (AMTs), and Dual-Clutch Transmissions (DCTs). These advanced transmissions are increasingly popular due to their smooth shifting and improved fuel efficiency. Moreover, governments around the world are offering subsidies to encourage the adoption of eco-friendly vehicles, further boosting the market growth. However, the market is not without challenges. Regulatory bodies are imposing stringent requirements on clutch systems to ensure durability and reliability, which increases the manufacturing costs. Standard-bearer companies, such as Tesla, are setting new benchmarks for vehicle performance and efficiency, putting pressure on other players to innovate and differentiate. The market analysis report provides a comprehensive study of these trends and challenges, offering valuable insights for stakeholders in the automotive industry.

What will be the Size of the Market During the Forecast Period?

Automotive Clutch Market Size

 Request Free Sample

The market is a vital component of manual vehicle transmission systems, enabling the smooth transfer of rotational power from the engine shaft to the transmission systems. This market caters to both manual transmission vehicles and emerging automatic transmission technologies. Manual clutches have long been the cornerstone of manual transmission vehicles, facilitating the connection and disconnection of the engine and transmission during gear changes. However, the increasing focus of Original Equipment Manufacturers (OEMs) on producing automatic transmission systems, such as torque converters, has led to a shift in market dynamics.

Moreover, consumer preference plays a significant role in the market. While manual transmission vehicles offer a more engaging driving experience, automatic transmission systems provide convenience and ease of use. The global operations of automotive hubs in various regions, including emerging economies, are expanding, contributing to the growth of the market. Production capacity is a crucial factor influencing the market. OEMs are investing in advanced production facilities to increase their output and meet the growing demand for both manual and automatic transmission vehicles. The fossil fuel dependency of the automotive industry poses a challenge to the market, as the shift towards electric vehicles gains momentum.

The torque converter, a key component of automatic transmission systems, has gained popularity due to its ability to provide a seamless driving experience. However, the manual clutch continues to hold its ground in the market, particularly in passenger cars, where cost and fuel efficiency remain essential considerations. The market is characterized by a global presence, with major players operating in various regions. The industry is driven by technological advancements, increasing demand for efficient transmission systems, and the growing popularity of electric vehicles. In conclusion, the market is a dynamic and evolving industry, influenced by various factors such as consumer preference, production capacity, and technological advancements.

In conclusion, the shift towards automatic transmission systems and the growing popularity of electric vehicles present both opportunities and challenges for market participants. OEMs must adapt to these trends while maintaining their focus on delivering high-quality, efficient, and cost-effective clutch solutions to meet the diverse needs of the global automotive market.

Market Segmentation

The market research report provides comprehensive data (region-wise segment analysis), with forecasts and estimates in "USD billion" for the period 2024-2028, as well as historical data from 2018-2022 for the following segments.

  • Channel
    • OEM
    • Aftermarket
  • Vehicle Type
    • Passenger vehicles
    • Commercial vehicles
  • Geography
    • APAC
      • China
      • Japan
    • North America
      • US
    • Europe
      • UK
      • France
    • South America
    • Middle East and Africa

By Channel Insights

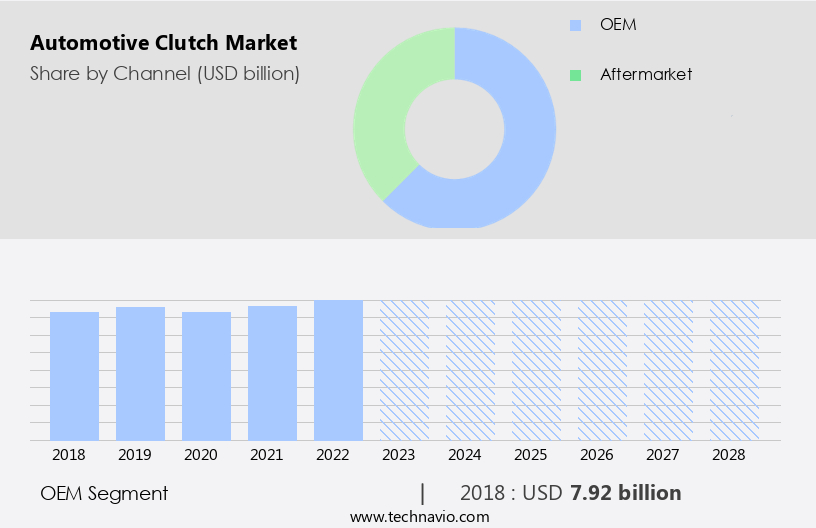
The OEM segment is estimated to witness significant growth during the forecast period. In the market, Original Equipment Manufacturers (OEMs) distribute their clutch products through various channels to reach customers worldwide. OEMs primarily sell automotive clutches to vehicle manufacturers for installation during production, accounting for a substantial portion of OEM clutch sales. This direct sales channel is crucial for automakers, as they require dependable clutch systems to ensure vehicle performance and durability. Furthermore, OEMs may partner with authorized dealerships and distributors to supply clutch components for aftermarket services and repairs. These authorized channels offer customers authentic OEM parts, safeguarding their vehicles' integrity and warranties.

Automotive Clutch Market Size

Get a glance at the market share of various segments Request Free Sample

The OEM segment was valued at USD 7.92 billion in 2018 and showed a gradual increase during the forecast period.

Regional Insights

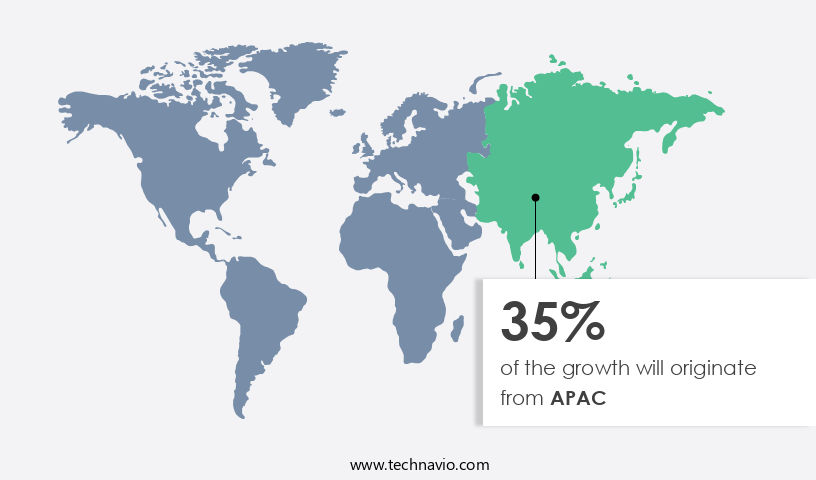
APAC is estimated to contribute 35% to the growth of the global market during the forecast period. Technavio’s analysts have elaborately explained the regional trends and drivers that shape the market during the forecast period.

Automotive Clutch Market Share by Geography

For more insights on the market share of various regions Request Free Sample

The Asia-Pacific (APAC) region plays a pivotal role in The market due to its expanding automotive industry, population growth, and escalating demand for passenger and commercial vehicles. Notable countries like China, Japan, India, and South Korea significantly impact the APAC market, given their thriving automotive sectors and increasing vehicle production. China, the world's largest automotive market, fuels substantial demand for automotive clutches, primarily due to its advanced manufacturing sector and burgeoning vehicle manufacturing industry.

Moreover, Japan and South Korea, recognized for their innovative automotive technologies, house leading automakers such as Toyota, Honda, and Hyundai, who incorporate premium clutches into their vehicles to ensure optimal performance. The APAC region is expected to dominate the global EV market, with China being the largest market shareholder. This trend is expected to create a significant demand for automotive clutches in the region. In summary, the APAC region, driven by countries like China, Japan, and South Korea, holds immense potential for the market due to its expanding automotive industry, population growth, and increasing demand for passenger and commercial vehicles, including electric vehicles.

Market Dynamics

Our researchers analyzed the data with 2023 as the base year, along with the key drivers, trends, and challenges. A holistic analysis of drivers will help companies refine their marketing strategies to gain a competitive advantage.

Market Driver

Rising disposable incomes and changing consumer preferences toward advanced vehicles is the key driver of the market. The market is experiencing significant growth due to increasing consumer preferences for advanced manual and automatic transmission systems in manual vehicles. These transmission systems offer benefits such as improved rotational power transfer from the engine shaft to the transmission systems, smoother gear shifts, and enhanced driving comfort. The market is witnessing a shift towards electric vehicles (EVs) and semiautomatic transmissions, including fully automatic and torque convertor systems. OEMs are focusing on expanding their production capacity and global operations to cater to this growing demand. Government subsidies and incentives for EVs in emerging economies are further fueling the market's growth.

Consumers' increasing focus on advanced features and technologies, including connectivity and autonomous driving, is driving the demand for sophisticated clutch solutions. The market is expected to continue its growth trajectory as the automotive industry evolves towards electrification and advanced transmission technologies.

Market Trends

Increasing demand for automated manual transmissions (AMTs) and dual-clutch transmissions (DCTs) is the upcoming trend in the market. The market is experiencing significant growth due to the increasing consumer preference for advanced transmission systems in manual vehicles. Automotive clutch solutions, such as automated manual transmissions (AMTs) and dual-clutch transmissions (DCTs), offer improved rotational power transfer from the engine shaft to the transmission systems. These advanced transmissions provide smoother gear shifts, enhanced driving comfort, and better fuel efficiency compared to traditional manual transmissions. As the demand for vehicles with automated manual and dual-clutch transmissions continues to rise, key Original Equipment Manufacturers (OEMs) are focusing on expanding their production capacity to meet consumer needs. BorgWarner Inc., a leading player in The market, is one such company that caters to this trend by providing advanced transmission solutions, including clutches, for a wide range of vehicles, including passenger cars and commercial vehicles.

Moreover, the increasing popularity of electric vehicles (EVs) and the ongoing expansion of automotive hubs in emerging economies are also contributing to the growth of the market. Government subsidies and incentives for the adoption of electric vehicles and the establishment of new production facilities further bolster market growth. In summary, the market is driven by the increasing demand for advanced transmission technologies in manual vehicles, the expansion of production capacity by OEMs, and the growing popularity of electric vehicles. BorgWarner Inc. Is one of the prominent players in this market, offering innovative transmission solutions for various vehicle types.

Market Challenge

Stringent regulatory requirements on clutch systems to meet durability and reliability standards is a key challenge affecting the market growth. The market faces stringent regulatory requirements to ensure clutch systems meet durability and reliability standards set by governments worldwide. In the EU, clutch systems must comply with European Commission directives on vehicle safety and emissions, undergoing rigorous testing to demonstrate compliance. Similarly, in the US, the National Highway Traffic Safety Administration (NHTSA) sets safety standards through Federal Motor Vehicle Safety Standards (FMVSS). These regulations aim to enhance vehicle safety, performance, and longevity by mandating high-quality clutch systems. Manual transmission vehicles, such as passenger cars and commercial vehicles, primarily utilize manual clutches. However, the increasing focus on automatic transmission systems, including fully automatic and semiautomatic transmissions, may impact the manual clutch market.

However, OEMs (Original Equipment Manufacturers) are expanding their production capacity to meet the growing demand for automatic transmissions, with some, like Tesla, focusing solely on electric vehicles and their proprietary torque convertor systems. The automotive hubs in emerging economies, such as China and India, are witnessing significant growth due to increasing consumer preference for affordable vehicles. This trend may influence the market, as manual transmission vehicles are often more cost-effective than their automatic counterparts. Additionally, government subsidies in these regions may further boost the demand for manual transmission vehicles and, consequently, the manual clutch market.

In summary, The market is subject to regulatory requirements ensuring clutch systems meet durability and reliability standards. The increasing focus on automatic transmissions and the growth of emerging economies may impact the market dynamics. OEMs are expanding their production capacity to cater to the demand for automatic transmissions, while consumer preference and government subsidies in emerging economies may favor manual transmission vehicles.

Exclusive Customer Landscape

The market forecasting report includes the adoption lifecycle of the market, covering from the innovator’s stage to the laggard’s stage. It focuses on adoption rates in different regions based on penetration. Furthermore, the report also includes key purchase criteria and drivers of price sensitivity to help companies evaluate and develop their market growth analysis strategies.
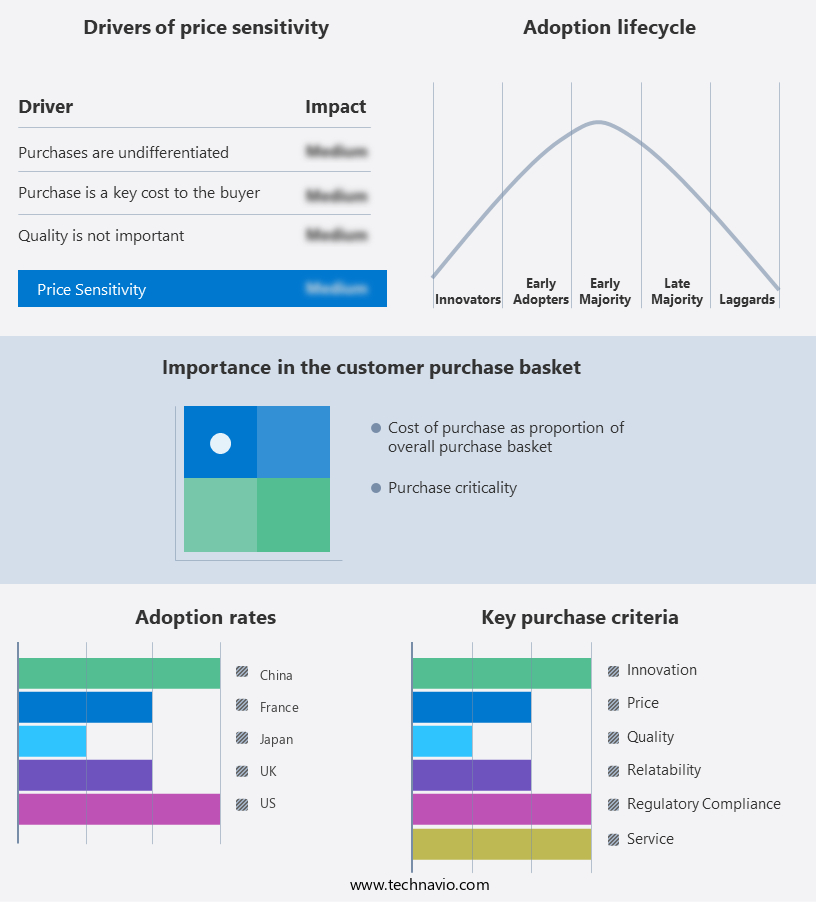
Automotive Clutch Market Share by Geography

 Customer Landscape

Key Companies & Market Insights

Companies are implementing various strategies, such as strategic alliances, partnerships, mergers and acquisitions, geographical expansion, and product/service launches, to enhance their presence in the market.

AISIN CORP.: The company offers automotive clutches such as the NVR (Noise Vibration Reduction) Clutch system that has been adopted into the automotive industry as Original Equipment.

The market research and growth report includes detailed analyses of the competitive landscape of the market and information about key companies, including:

  • AISIN CORP.
  • BorgWarner Inc.
  • Burg Germany GmbH
  • Eaton Corp. Plc
  • EXEDY Corp.
  • FCC Clutch India Pvt. Ltd.
  • GMP Friction Products
  • NSK Ltd.
  • Schaeffler AG
  • SEPAC Inc.
  • The Rowland Co.
  • Valeo SA
  • Wabtec Corp.
  • WPT Power Corp.
  • ZF Friedrichshafen AG
  • Honda Motor Co. Ltd.
  • Hyundai Motor Co.
  • Mercedes Benz Group AG
  • Nissan Motor Co. Ltd.
  • Toyota Motor Corp.

Qualitative and quantitative analysis of companies has been conducted to help clients understand the wider business environment as well as the strengths and weaknesses of key market players. Data is qualitatively analyzed to categorize companies as pure play, category-focused, industry-focused, and diversified; it is quantitatively analyzed to categorize companies as dominant, leading, strong, tentative, and weak.

Research Analyst Overview

The market plays a crucial role in manual vehicles with manual transmissions, facilitating the transfer of rotational power from the engine shaft to the transmission systems. Consumer preference for manual transmissions varies, particularly in passenger cars, with OEMs focusing on both manual and automatic transmission options.

In summary, automotive hubs, including torque convertors, are integral components of automatic transmission systems. Global operations in the market span across emerging economies, driven by increasing production capacity and government subsidies. The industry's focus on innovation extends to electric vehicles, with the development of clutches for semiautomatic and fully automatic transmissions. The market's growth is influenced by the ongoing shift towards electric and alternative fuel vehicles, as well as advancements in technology and manufacturing processes. Passenger cars remain a significant market for automotive clutches, with manual clutches continuing to be a popular choice for those seeking a more engaging driving experience. The industry's future looks promising, with ongoing research and development efforts aimed at improving efficiency, performance, and sustainability.

Market Scope

Report Coverage

Details

Page number

163

Base year

2023

Historic period

2018-2022

Forecast period

2024-2028

Growth momentum & CAGR

Accelerate at a CAGR of 5.78%

Market growth 2024-2028

USD 4.49 billion

Market structure

Fragmented

YoY growth 2023-2024(%)

5.25

Regional analysis

APAC, North America, Europe, South America, and Middle East and Africa

Performing market contribution

APAC at 35%

Key countries

US, China, Japan, UK, and France

Competitive landscape

Leading Companies, Market Positioning of Companies, Competitive Strategies, and Industry Risks

Key companies profiled

AISIN CORP., BorgWarner Inc., Burg Germany GmbH, Eaton Corp. Plc, EXEDY Corp., FCC Clutch India Pvt. Ltd., GMP Friction Products, NSK Ltd., Schaeffler AG, SEPAC Inc., The Rowland Co., Valeo SA, Wabtec Corp., WPT Power Corp., ZF Friedrichshafen AG, Honda Motor Co. Ltd., Hyundai Motor Co., Mercedes Benz Group AG, Nissan Motor Co. Ltd., and Toyota Motor Corp.

Market dynamics

Parent market analysis, market growth inducers and obstacles, market forecast, fast-growing and slow-growing segment analysis, COVID-19 impact and recovery analysis and future consumer dynamics, market condition analysis for the forecast period

Customization purview

If our market report has not included the data that you are looking for, you can reach out to our analysts and get segments customized.

Request Free Sample

What are the Key Data Covered in this Market Research and Growth Report?

  • CAGR of the market during the forecast period
  • Detailed information on factors that will drive the market growth and forecasting between 2024 and 2028
  • Precise estimation of the size of the market  and its contribution of the market in focus to the parent market
  • Accurate predictions about upcoming market growth and trends and changes in consumer behaviour
  • Growth of the market across APAC, North America, Europe, South America, and Middle East and Africa
  • Thorough analysis of the market’s competitive landscape and detailed information about companies
  • Comprehensive analysis of factors that will challenge the growth of market companies

We can help! Our analysts can customize this market research report to meet your requirements. Get in touch

1 Executive Summary

  • 1.1 Market overview
    • Exhibit 01: Executive Summary – Chart on Market Overview
    • Exhibit 02: Executive Summary – Data Table on Market Overview
    • Exhibit 03: Executive Summary – Chart on Global Market Characteristics
    • Exhibit 04: Executive Summary – Chart on Market by Geography
    • Exhibit 05: Executive Summary – Chart on Market Segmentation by Channel
    • Exhibit 06: Executive Summary – Chart on Market Segmentation by Vehicle Type
    • Exhibit 07: Executive Summary – Chart on Incremental Growth
    • Exhibit 08: Executive Summary – Data Table on Incremental Growth
    • Exhibit 09: Executive Summary – Chart on Vendor Market Positioning

2 Market Landscape

  • 2.1 Market ecosystem
    • Exhibit 10: Parent market
    • Exhibit 11: Market Characteristics

3 Market Sizing

  • 3.1 Market definition
    • Exhibit 12: Offerings of vendors included in the market definition
  • 3.2 Market segment analysis
    • Exhibit 13: Market segments
  • 3.3 Market size 2023
    • 3.4 Market outlook: Forecast for 2023-2028
      • Exhibit 14: Chart on Global - Market size and forecast 2023-2028 ($ billion)
      • Exhibit 15: Data Table on Global - Market size and forecast 2023-2028 ($ billion)
      • Exhibit 16: Chart on Global Market: Year-over-year growth 2023-2028 (%)
      • Exhibit 17: Data Table on Global Market: Year-over-year growth 2023-2028 (%)

    4 Historic Market Size

    • 4.1 Global automotive clutch market 2018 - 2022
      • Exhibit 18: Historic Market Size – Data Table on global automotive clutch market 2018 - 2022 ($ billion)
    • 4.2 Channel Segment Analysis 2018 - 2022
      • Exhibit 19: Historic Market Size – Channel Segment 2018 - 2022 ($ billion)
    • 4.3 Vehicle Type Segment Analysis 2018 - 2022
      • Exhibit 20: Historic Market Size – Vehicle Type Segment 2018 - 2022 ($ billion)
    • 4.4 Geography Segment Analysis 2018 - 2022
      • Exhibit 21: Historic Market Size – Geography Segment 2018 - 2022 ($ billion)
    • 4.5 Country Segment Analysis 2018 - 2022
      • Exhibit 22: Historic Market Size – Country Segment 2018 - 2022 ($ billion)

    5 Five Forces Analysis

    • 5.1 Five forces summary
      • Exhibit 23: Five forces analysis - Comparison between 2023 and 2028
    • 5.2 Bargaining power of buyers
      • Exhibit 24: Chart on Bargaining power of buyers – Impact of key factors 2023 and 2028
    • 5.3 Bargaining power of suppliers
      • Exhibit 25: Bargaining power of suppliers – Impact of key factors in 2023 and 2028
    • 5.4 Threat of new entrants
      • Exhibit 26: Threat of new entrants – Impact of key factors in 2023 and 2028
    • 5.5 Threat of substitutes
      • Exhibit 27: Threat of substitutes – Impact of key factors in 2023 and 2028
    • 5.6 Threat of rivalry
      • Exhibit 28: Threat of rivalry – Impact of key factors in 2023 and 2028
    • 5.7 Market condition
      • Exhibit 29: Chart on Market condition - Five forces 2023 and 2028

    6 Market Segmentation by Channel

    • 6.1 Market segments
      • Exhibit 30: Chart on Channel - Market share 2023-2028 (%)
      • Exhibit 31: Data Table on Channel - Market share 2023-2028 (%)
    • 6.2 Comparison by Channel
      • Exhibit 32: Chart on Comparison by Channel
      • Exhibit 33: Data Table on Comparison by Channel
    • 6.3 OEM - Market size and forecast 2023-2028
      • Exhibit 34: Chart on OEM - Market size and forecast 2023-2028 ($ billion)
      • Exhibit 35: Data Table on OEM - Market size and forecast 2023-2028 ($ billion)
      • Exhibit 36: Chart on OEM - Year-over-year growth 2023-2028 (%)
      • Exhibit 37: Data Table on OEM - Year-over-year growth 2023-2028 (%)
    • 6.4 Aftermarket - Market size and forecast 2023-2028
      • Exhibit 38: Chart on Aftermarket - Market size and forecast 2023-2028 ($ billion)
      • Exhibit 39: Data Table on Aftermarket - Market size and forecast 2023-2028 ($ billion)
      • Exhibit 40: Chart on Aftermarket - Year-over-year growth 2023-2028 (%)
      • Exhibit 41: Data Table on Aftermarket - Year-over-year growth 2023-2028 (%)
    • 6.5 Market opportunity by Channel
      • Exhibit 42: Market opportunity by Channel ($ billion)
      • Exhibit 43: Data Table on Market opportunity by Channel ($ billion)

    7 Market Segmentation by Vehicle Type

    • 7.1 Market segments
      • Exhibit 44: Chart on Vehicle Type - Market share 2023-2028 (%)
      • Exhibit 45: Data Table on Vehicle Type - Market share 2023-2028 (%)
    • 7.2 Comparison by Vehicle Type
      • Exhibit 46: Chart on Comparison by Vehicle Type
      • Exhibit 47: Data Table on Comparison by Vehicle Type
    • 7.3 Passenger vehicles - Market size and forecast 2023-2028
      • Exhibit 48: Chart on Passenger vehicles - Market size and forecast 2023-2028 ($ billion)
      • Exhibit 49: Data Table on Passenger vehicles - Market size and forecast 2023-2028 ($ billion)
      • Exhibit 50: Chart on Passenger vehicles - Year-over-year growth 2023-2028 (%)
      • Exhibit 51: Data Table on Passenger vehicles - Year-over-year growth 2023-2028 (%)
    • 7.4 Commercial vehicles - Market size and forecast 2023-2028
      • Exhibit 52: Chart on Commercial vehicles - Market size and forecast 2023-2028 ($ billion)
      • Exhibit 53: Data Table on Commercial vehicles - Market size and forecast 2023-2028 ($ billion)
      • Exhibit 54: Chart on Commercial vehicles - Year-over-year growth 2023-2028 (%)
      • Exhibit 55: Data Table on Commercial vehicles - Year-over-year growth 2023-2028 (%)
    • 7.5 Market opportunity by Vehicle Type
      • Exhibit 56: Market opportunity by Vehicle Type ($ billion)
      • Exhibit 57: Data Table on Market opportunity by Vehicle Type ($ billion)

    8 Customer Landscape

    • 8.1 Customer landscape overview
      • Exhibit 58: Analysis of price sensitivity, lifecycle, customer purchase basket, adoption rates, and purchase criteria

    9 Geographic Landscape

    • 9.1 Geographic segmentation
      • Exhibit 59: Chart on Market share by geography 2023-2028 (%)
      • Exhibit 60: Data Table on Market share by geography 2023-2028 (%)
    • 9.2 Geographic comparison
      • Exhibit 61: Chart on Geographic comparison
      • Exhibit 62: Data Table on Geographic comparison
    • 9.3 APAC - Market size and forecast 2023-2028
      • Exhibit 63: Chart on APAC - Market size and forecast 2023-2028 ($ billion)
      • Exhibit 64: Data Table on APAC - Market size and forecast 2023-2028 ($ billion)
      • Exhibit 65: Chart on APAC - Year-over-year growth 2023-2028 (%)
      • Exhibit 66: Data Table on APAC - Year-over-year growth 2023-2028 (%)
    • 9.4 North America - Market size and forecast 2023-2028
      • Exhibit 67: Chart on North America - Market size and forecast 2023-2028 ($ billion)
      • Exhibit 68: Data Table on North America - Market size and forecast 2023-2028 ($ billion)
      • Exhibit 69: Chart on North America - Year-over-year growth 2023-2028 (%)
      • Exhibit 70: Data Table on North America - Year-over-year growth 2023-2028 (%)
    • 9.5 Europe - Market size and forecast 2023-2028
      • Exhibit 71: Chart on Europe - Market size and forecast 2023-2028 ($ billion)
      • Exhibit 72: Data Table on Europe - Market size and forecast 2023-2028 ($ billion)
      • Exhibit 73: Chart on Europe - Year-over-year growth 2023-2028 (%)
      • Exhibit 74: Data Table on Europe - Year-over-year growth 2023-2028 (%)
    • 9.6 South America - Market size and forecast 2023-2028
      • Exhibit 75: Chart on South America - Market size and forecast 2023-2028 ($ billion)
      • Exhibit 76: Data Table on South America - Market size and forecast 2023-2028 ($ billion)
      • Exhibit 77: Chart on South America - Year-over-year growth 2023-2028 (%)
      • Exhibit 78: Data Table on South America - Year-over-year growth 2023-2028 (%)
    • 9.7 Middle East and Africa - Market size and forecast 2023-2028
      • Exhibit 79: Chart on Middle East and Africa - Market size and forecast 2023-2028 ($ billion)
      • Exhibit 80: Data Table on Middle East and Africa - Market size and forecast 2023-2028 ($ billion)
      • Exhibit 81: Chart on Middle East and Africa - Year-over-year growth 2023-2028 (%)
      • Exhibit 82: Data Table on Middle East and Africa - Year-over-year growth 2023-2028 (%)
    • 9.8 US - Market size and forecast 2023-2028
      • Exhibit 83: Chart on US - Market size and forecast 2023-2028 ($ billion)
      • Exhibit 84: Data Table on US - Market size and forecast 2023-2028 ($ billion)
      • Exhibit 85: Chart on US - Year-over-year growth 2023-2028 (%)
      • Exhibit 86: Data Table on US - Year-over-year growth 2023-2028 (%)
    • 9.9 China - Market size and forecast 2023-2028
      • Exhibit 87: Chart on China - Market size and forecast 2023-2028 ($ billion)
      • Exhibit 88: Data Table on China - Market size and forecast 2023-2028 ($ billion)
      • Exhibit 89: Chart on China - Year-over-year growth 2023-2028 (%)
      • Exhibit 90: Data Table on China - Year-over-year growth 2023-2028 (%)
    • 9.10 UK - Market size and forecast 2023-2028
      • Exhibit 91: Chart on UK - Market size and forecast 2023-2028 ($ billion)
      • Exhibit 92: Data Table on UK - Market size and forecast 2023-2028 ($ billion)
      • Exhibit 93: Chart on UK - Year-over-year growth 2023-2028 (%)
      • Exhibit 94: Data Table on UK - Year-over-year growth 2023-2028 (%)
    • 9.11 France - Market size and forecast 2023-2028
      • Exhibit 95: Chart on France - Market size and forecast 2023-2028 ($ billion)
      • Exhibit 96: Data Table on France - Market size and forecast 2023-2028 ($ billion)
      • Exhibit 97: Chart on France - Year-over-year growth 2023-2028 (%)
      • Exhibit 98: Data Table on France - Year-over-year growth 2023-2028 (%)
    • 9.12 Japan - Market size and forecast 2023-2028
      • Exhibit 99: Chart on Japan - Market size and forecast 2023-2028 ($ billion)
      • Exhibit 100: Data Table on Japan - Market size and forecast 2023-2028 ($ billion)
      • Exhibit 101: Chart on Japan - Year-over-year growth 2023-2028 (%)
      • Exhibit 102: Data Table on Japan - Year-over-year growth 2023-2028 (%)
    • 9.13 Market opportunity by geography
      • Exhibit 103: Market opportunity by geography ($ billion)
      • Exhibit 104: Data Tables on Market opportunity by geography ($ billion)

    10 Drivers, Challenges, and Trends

    • 10.1 Market drivers
      • 10.2 Market challenges
        • 10.3 Impact of drivers and challenges
          • Exhibit 105: Impact of drivers and challenges in 2023 and 2028
        • 10.4 Market trends

          11 Vendor Landscape

          • 11.1 Overview
            • 11.2 Vendor landscape
              • Exhibit 106: Overview on Criticality of inputs and Factors of differentiation
            • 11.3 Landscape disruption
              • Exhibit 107: Overview on factors of disruption
            • 11.4 Industry risks
              • Exhibit 108: Impact of key risks on business

            12 Vendor Analysis

            • 12.1 Vendors covered
              • Exhibit 109: Vendors covered
            • 12.2 Market positioning of vendors
              • Exhibit 110: Matrix on vendor position and classification
            • 12.3 AISIN CORP.
              • Exhibit 111: AISIN CORP. - Overview
              • Exhibit 112: AISIN CORP. - Business segments
              • Exhibit 113: AISIN CORP. - Key offerings
              • Exhibit 114: AISIN CORP. - Segment focus
            • 12.4 BorgWarner Inc.
              • Exhibit 115: BorgWarner Inc. - Overview
              • Exhibit 116: BorgWarner Inc. - Business segments
              • Exhibit 117: BorgWarner Inc. - Key offerings
              • Exhibit 118: BorgWarner Inc. - Segment focus
            • 12.5 Eaton Corp. Plc
              • Exhibit 119: Eaton Corp. Plc - Overview
              • Exhibit 120: Eaton Corp. Plc - Business segments
              • Exhibit 121: Eaton Corp. Plc - Key offerings
              • Exhibit 122: Eaton Corp. Plc - Segment focus
            • 12.6 EXEDY Corp.
              • Exhibit 123: EXEDY Corp. - Overview
              • Exhibit 124: EXEDY Corp. - Business segments
              • Exhibit 125: EXEDY Corp. - Key offerings
              • Exhibit 126: EXEDY Corp. - Segment focus
            • 12.7 Honda Motor Co. Ltd.
              • Exhibit 127: Honda Motor Co. Ltd. - Overview
              • Exhibit 128: Honda Motor Co. Ltd. - Business segments
              • Exhibit 129: Honda Motor Co. Ltd. - Key news
              • Exhibit 130: Honda Motor Co. Ltd. - Key offerings
              • Exhibit 131: Honda Motor Co. Ltd. - Segment focus
            • 12.8 Hyundai Motor Co.
              • Exhibit 132: Hyundai Motor Co. - Overview
              • Exhibit 133: Hyundai Motor Co. - Business segments
              • Exhibit 134: Hyundai Motor Co. - Key news
              • Exhibit 135: Hyundai Motor Co. - Key offerings
              • Exhibit 136: Hyundai Motor Co. - Segment focus
            • 12.9 Mercedes Benz Group AG
              • Exhibit 137: Mercedes Benz Group AG - Overview
              • Exhibit 138: Mercedes Benz Group AG - Business segments
              • Exhibit 139: Mercedes Benz Group AG - Key news
              • Exhibit 140: Mercedes Benz Group AG - Key offerings
              • Exhibit 141: Mercedes Benz Group AG - Segment focus
            • 12.10 Nissan Motor Co. Ltd.
              • Exhibit 142: Nissan Motor Co. Ltd. - Overview
              • Exhibit 143: Nissan Motor Co. Ltd. - Business segments
              • Exhibit 144: Nissan Motor Co. Ltd. - Key news
              • Exhibit 145: Nissan Motor Co. Ltd. - Key offerings
              • Exhibit 146: Nissan Motor Co. Ltd. - Segment focus
            • 12.11 NSK Ltd.
              • Exhibit 147: NSK Ltd. - Overview
              • Exhibit 148: NSK Ltd. - Product / Service
              • Exhibit 149: NSK Ltd. - Key offerings
            • 12.12 Schaeffler AG
              • Exhibit 150: Schaeffler AG - Overview
              • Exhibit 151: Schaeffler AG - Business segments
              • Exhibit 152: Schaeffler AG - Key offerings
              • Exhibit 153: Schaeffler AG - Segment focus
            • 12.13 SEPAC Inc.
              • Exhibit 154: SEPAC Inc. - Overview
              • Exhibit 155: SEPAC Inc. - Product / Service
              • Exhibit 156: SEPAC Inc. - Key offerings
            • 12.14 Toyota Motor Corp.
              • Exhibit 157: Toyota Motor Corp. - Overview
              • Exhibit 158: Toyota Motor Corp. - Business segments
              • Exhibit 159: Toyota Motor Corp. - Key offerings
              • Exhibit 160: Toyota Motor Corp. - Segment focus
            • 12.15 Valeo SA
              • Exhibit 161: Valeo SA - Overview
              • Exhibit 162: Valeo SA - Business segments
              • Exhibit 163: Valeo SA - Key news
              • Exhibit 164: Valeo SA - Key offerings
              • Exhibit 165: Valeo SA - Segment focus
            • 12.16 Wabtec Corp.
              • Exhibit 166: Wabtec Corp. - Overview
              • Exhibit 167: Wabtec Corp. - Business segments
              • Exhibit 168: Wabtec Corp. - Key offerings
              • Exhibit 169: Wabtec Corp. - Segment focus
            • 12.17 ZF Friedrichshafen AG
              • Exhibit 170: ZF Friedrichshafen AG - Overview
              • Exhibit 171: ZF Friedrichshafen AG - Business segments
              • Exhibit 172: ZF Friedrichshafen AG - Key news
              • Exhibit 173: ZF Friedrichshafen AG - Key offerings
              • Exhibit 174: ZF Friedrichshafen AG - Segment focus

            13 Appendix

            • 13.1 Scope of the report
              • 13.2 Inclusions and exclusions checklist
                • Exhibit 175: Inclusions checklist
                • Exhibit 176: Exclusions checklist
              • 13.3 Currency conversion rates for US$
                • Exhibit 177: Currency conversion rates for US$
              • 13.4 Research methodology
                • Exhibit 178: Research methodology
                • Exhibit 179: Validation techniques employed for market sizing
                • Exhibit 180: Information sources
              • 13.5 List of abbreviations
                • Exhibit 181: List of abbreviations

              Research Methodology

              Technavio presents a detailed picture of the market by way of study, synthesis, and summation of data from multiple sources. The analysts have presented the various facets of the market with a particular focus on identifying the key industry influencers. The data thus presented is comprehensive, reliable, and the result of extensive research, both primary and secondary.

              INFORMATION SOURCES

              Primary sources

              • Manufacturers and suppliers
              • Channel partners
              • Industry experts
              • Strategic decision makers

              Secondary sources

              • Industry journals and periodicals
              • Government data
              • Financial reports of key industry players
              • Historical data
              • Press releases

              DATA ANALYSIS

              Data Synthesis

              • Collation of data
              • Estimation of key figures
              • Analysis of derived insights

              Data Validation

              • Triangulation with data models
              • Reference against proprietary databases
              • Corroboration with industry experts

              REPORT WRITING

              Qualitative

              • Market drivers
              • Market challenges
              • Market trends
              • Five forces analysis

              Quantitative

              • Market size and forecast
              • Market segmentation
              • Geographical insights
              • Competitive landscape

              Interested in this report?

              Get your sample now to see our research methodology and insights!

              Download Now

              Frequently Asked Questions

              Automotive Clutch market growth will increase by $ 4.49 bn during 2024-2028.

              The Automotive Clutch market is expected to grow at a CAGR of 5.78% during 2024-2028.

              Automotive Clutch market is segmented by Channel( OEM, Aftermarket) Vehicle Type( Passenger vehicles, Commercial vehicles)

              AISIN CORP., BorgWarner Inc., Burg Germany GmbH, Eaton Corp. Plc, EXEDY Corp., FCC Clutch India Pvt. Ltd., GMP Friction Products, NSK Ltd., Schaeffler AG, SEPAC Inc., The Rowland Co., Valeo SA, Wabtec Corp., WPT Power Corp., ZF Friedrichshafen AG, Honda Motor Co. Ltd., Hyundai Motor Co., Mercedes Benz Group AG, Nissan Motor Co. Ltd., Toyota Motor Corp. are a few of the key vendors in the Automotive Clutch market.

              APAC will register the highest growth rate of 35% among the other regions. Therefore, the Automotive Clutch market in APAC is expected to garner significant business opportunities for the vendors during the forecast period.

              US, China, Japan, UK, France

              • Rising disposable incomes and changing consumer preferences toward advanced vehiclesRising disposable incomes and changing consumer preferences toward advanced vehicles are significant driving factors shaping the global automotive clutch market. Advanced transmission technologies inculcated in automotive clutches offer benefits such as improved fuel efficiency is the driving factor this market.
              • smoother gear shifts is the driving factor this market.
              • and enhanced driving comfort is the driving factor this market.
              • aligning with the preferences of discerning consumers seeking superior performance and convenience. Moreover is the driving factor this market.
              • changing consumer preferences toward advanced vehicles reflect a broader shift in the automotive industry toward electrification is the driving factor this market.
              • connectivity is the driving factor this market.
              • and autonomous driving. As consumers become more tech-savvy and environmentally conscious is the driving factor this market.
              • they prioritize vehicles equipped with cutting-edge features and technologies. This includes hybrid and electric vehicles (EVs) with sophisticated transmission systems that optimize power delivery and efficiency is the driving factor this market.
              • further driving the demand for advanced clutch solutions. In response to these changing consumer preferences and increasing disposable incomes is the driving factor this market.
              • automotive manufacturers and clutch suppliers are investing in research and development to innovate and enhance clutch technologies. This includes the development of lightweight and compact clutch designs is the driving factor this market.
              • integration of advanced materials is the driving factor this market.
              • and implementation of smart transmission control systems to meet the evolving demands of the market. Overall is the driving factor this market.
              • rising disposable incomes and changing consumer preferences toward advanced vehicles are expected to fuel growth and innovation in the global automotive clutch market during the forecast period. is the driving factor this market.

              The Automotive Clutch market vendors should focus on grabbing business opportunities from the OEM segment as it accounted for the largest market share in the base year.