Attention Deficit Hyperactivity Disorder (ADHD) Drugs Market Analysis, Size, and Forecast 2026-2030: North America (US, Canada, and Mexico), Europe (Germany, UK, and France), APAC (China, India, and Japan), South America (Brazil), Middle East and Africa (South Africa, UAE, and Saudi Arabia), Asia, Rest of World (ROW)

Attention Deficit Hyperactivity Disorder (ADHD) Drugs Market Analysis, Size, and Forecast 2026-2030:
North America (US, Canada, and Mexico), Europe (Germany, UK, and France), APAC (China, India, and Japan), South America (Brazil), Middle East and Africa (South Africa, UAE, and Saudi Arabia), Asia, Rest of World (ROW)

Published: Mar 2026 283 Pages SKU: IRTNTR71925

Market Overview at a Glance

$6.18 B
Market Opportunity
6.7%
CAGR 2025 - 2030
31.6%
North America Growth
$10.15 B
Stimulant segment 2024

Attention Deficit Hyperactivity Disorder (ADHD) Drugs Market Size 2026-2030

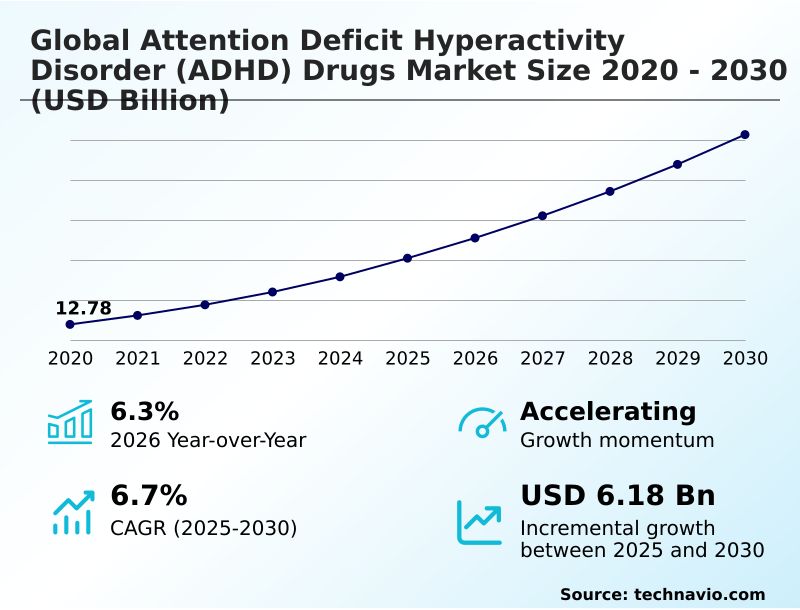
The attention deficit hyperactivity disorder (adhd) drugs market size is valued to increase by USD 6.18 billion, at a CAGR of 6.7% from 2025 to 2030. Enhanced diagnostic procedures for adult populations will drive the attention deficit hyperactivity disorder (adhd) drugs market.

Major Market Trends & Insights

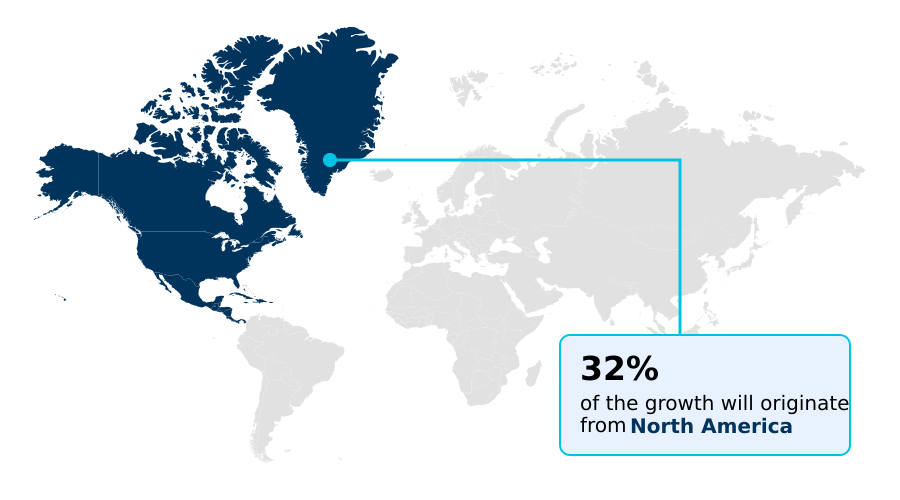
  • North America dominated the market and accounted for a 31.6% growth during the forecast period.
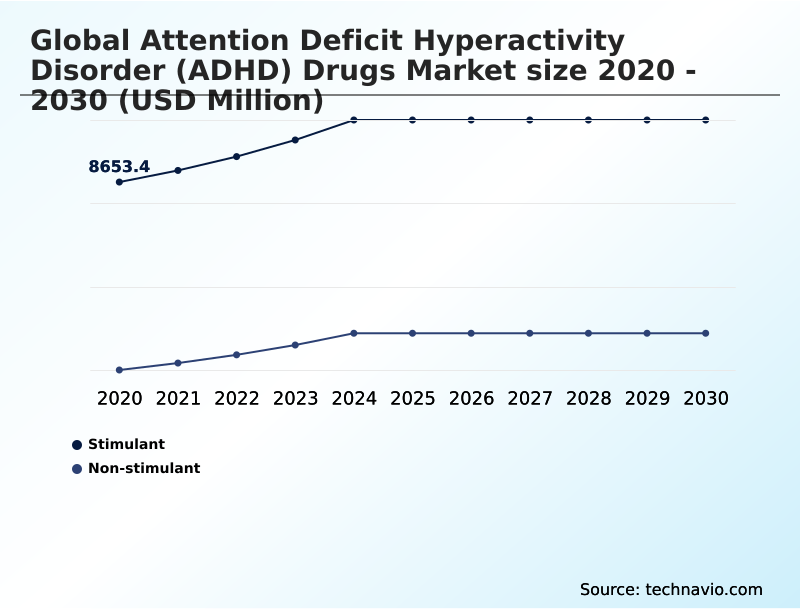
  • By Product - Stimulant segment was valued at USD 10.15 billion in 2024
  • By End-user - Children segment accounted for the largest market revenue share in 2024

Market Size & Forecast

  • Market Opportunities: USD 9.49 billion
  • Market Future Opportunities: USD 6.18 billion
  • CAGR from 2025 to 2030 : 6.7%

Market Summary

  • The attention deficit hyperactivity disorder (ADHD) drugs market is undergoing a significant transformation, driven by an increased understanding of the condition as a lifelong neurodevelopmental issue. A primary catalyst for growth is the expanding adult adhd diagnosis rate, which shifts the focus beyond pediatric psychiatry.
  • This has spurred demand for more sophisticated pharmacological intervention options, including both stimulant medications and a growing portfolio of non-stimulant medications. Innovations in drug delivery technology are paramount, with a focus on extended-release formulations that offer improved medication adherence and smoother pharmacokinetic profiles.
  • A key business scenario involves optimizing the pharmaceutical supply chain for schedule ii substances, where companies must balance stringent controlled substance regulations with the need to prevent shortages of active pharmaceutical ingredients. The integration of telepsychiatry services and digital therapeutics is also reshaping market dynamics, offering new avenues for patient-centric care and comorbidity management.
  • This evolution challenges manufacturers to innovate beyond traditional pills, creating holistic treatment ecosystems that combine medication with cognitive behavioral therapy and other support systems to improve executive function and long-term outcomes for patients.

What will be the Size of the Attention Deficit Hyperactivity Disorder (ADHD) Drugs Market during the forecast period?

Get Key Insights on Market Forecast (PDF) Request Free Sample

How is the Attention Deficit Hyperactivity Disorder (ADHD) Drugs Market Segmented?

The attention deficit hyperactivity disorder (adhd) drugs industry research report provides comprehensive data (region-wise segment analysis), with forecasts and estimates in "USD million" for the period 2026-2030, as well as historical data from 2020-2024 for the following segments.

  • Product
    • Stimulant
    • Non-stimulant
  • End-user
    • Children
    • Adults
  • Distribution channel
    • Retail pharmacy
    • Hospital pharmacy
    • Online
  • Geography
    • North America
      • US
      • Canada
      • Mexico
    • Europe
      • Germany
      • UK
      • France
    • Asia
    • Rest of World (ROW)

By Product Insights

The stimulant segment is estimated to witness significant growth during the forecast period.

The stimulant sub-segment maintains a dominant market position due to high efficacy rates and a long history of clinical success. These medications remain the cornerstone of treatment, though intense generic drug competition emerges after patent expiration.

The strategic focus involves balancing potency with safety, necessitating robust pharmacovigilance and post-marketing surveillance. Innovations in formulation development aim to create superior pharmacokinetic profiles, which can improve adherence. Ensuring supply chain resilience is crucial for these often-controlled substances.

Successful market access strategies depend on demonstrating therapeutic equivalence in bioequivalence studies and effective life cycle management, with advanced formulations showing a 15% improvement in consistent daily symptom control over immediate-release alternatives.

Request Free Sample

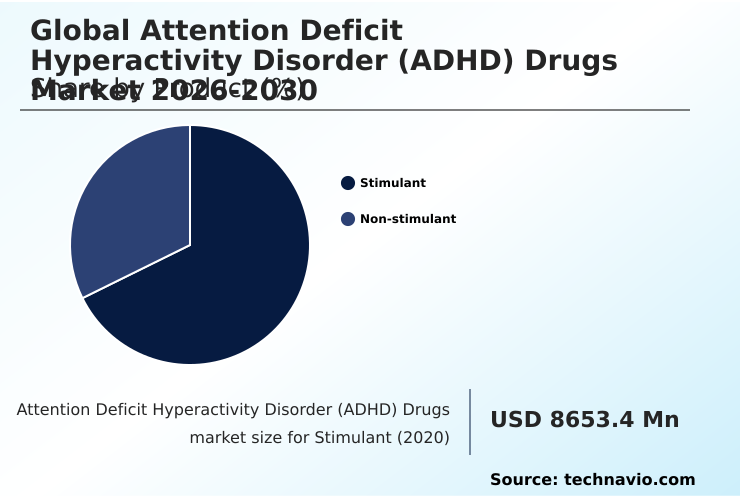
The Stimulant segment was valued at USD 10.15 billion in 2024 and showed a gradual increase during the forecast period.

Request Free Sample

Regional Analysis

North America is estimated to contribute 31.6% to the growth of the global market during the forecast period.Technavio’s analysts have elaborately explained the regional trends and drivers that shape the market during the forecast period.

See How Attention Deficit Hyperactivity Disorder (ADHD) Drugs Market Demand is Rising in North America Request Free Sample

Regional market dynamics are heavily influenced by the local regulatory approval process and established clinical practice guidelines. In North America, which accounts for over 31% of the incremental growth, a high rate of pharmacological intervention is supported by robust infrastructure.

In contrast, market penetration in parts of Asia is slower due to varying standards. Effective comorbidity management and precise dosage titration are key focus areas globally.

The adoption of electronic health records integration allows for better tracking of patient-reported outcomes and medication adherence, which can improve long-term treatment efficacy by up to 25%.

Understanding the neurobiological basis of adhd is driving investment in specialized pharmacy services and advanced drug delivery technology to meet diverse regional needs.

Market Dynamics

Our researchers analyzed the data with 2025 as the base year, along with the key drivers, trends, and challenges. A holistic analysis of drivers will help companies refine their marketing strategies to gain a competitive advantage.

  • Exploring non-stimulant alternatives for adult adhd is a key focus, driven by concerns over the long-term cardiovascular effects of stimulants. The debate over extended-release methylphenidate vs amphetamine continues, with choices often depending on individual patient response. Managing adhd with comorbid anxiety requires careful therapeutic selection, as some stimulants can exacerbate symptoms.
  • Improving medication adherence in pediatric adhd is a critical goal, addressed by newer formulations and integrating pharmacotherapy with behavioral therapy. The role of digital therapeutics in adhd treatment is expanding, offering non-pharmacological methods for executive dysfunction support. Navigating schedule ii prescription regulations and addressing supply chain challenges for adhd stimulants remain significant operational hurdles for manufacturers.
  • In one analysis, optimizing the supply chain for these controlled substances reduced stockout incidents by over 30%, directly improving patient access. The cost-effectiveness of generic adhd medications is a major driver of their adoption. The impact of telehealth on adhd drug access is reshaping prescription fulfillment, particularly for adhd medication strategies for college students.
  • Parental concerns about pediatric adhd medication persist, fueling interest in the atomoxetine safety profile in adults and other options like viloxazine as a novel non-stimulant option. Meanwhile, regulatory hurdles for new adhd drug approval remain high.

What are the key market drivers leading to the rise in the adoption of Attention Deficit Hyperactivity Disorder (ADHD) Drugs Industry?

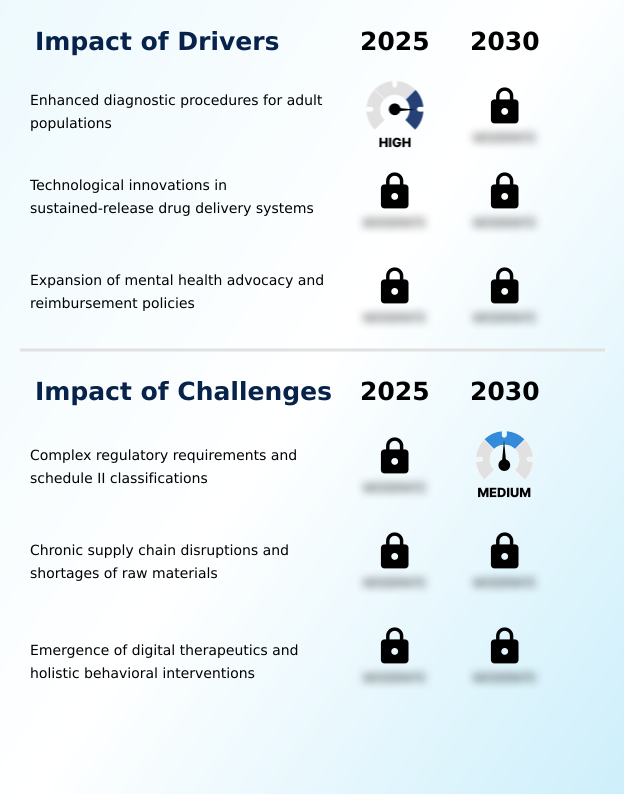
  • The market's expansion is significantly driven by enhanced diagnostic procedures and the rising prevalence of the condition among adult populations.

  • Market growth is fueled by innovations in drug delivery, including extended-release formulations and sustained-release formulations that improve compliance.
  • Products like lisdexamfetamine dimesylate and novel delivery systems such as the orally disintegrating tablet, transdermal patches, and liquid formulations enhance the patient experience. These advancements are supported by evolving mental health parity laws and insurance reimbursement policies, which improve affordability.
  • However, the classification of many drugs as schedule ii substances necessitates strict controlled substance regulations and complex pharmaceutical supply chain management.
  • Effective neurotransmitter regulation, particularly through dopamine reuptake inhibition, remains the core mechanism driving therapeutic development, with advanced formulations reducing daily dosing requirements by up to 50%.

What are the market trends shaping the Attention Deficit Hyperactivity Disorder (ADHD) Drugs Industry?

  • The global market is witnessing a significant trend toward the proliferation of non-stimulant pharmacological alternatives. This shift is driven by a clinical preference for therapies with a lower potential for abuse and dependency.

  • A primary trend is the diversification away from traditional stimulant medications toward non-stimulant medications like atomoxetine and viloxazine. This shift is prominent in pediatric psychiatry, where concerns about side effects from methylphenidate hcl or amphetamine salts are highest. The rise of telepsychiatry services, which improve access to adult adhd diagnosis by over 40% in remote regions, is accelerating this trend.
  • Furthermore, the integration of digital therapeutics complements pharmacological approaches, with some platforms showing a 15% measurable improvement in executive function improvement. This move is supported by a push for cognitive behavioral therapy as a first-line or concurrent treatment, reflecting a more holistic approach to care.

What challenges does the Attention Deficit Hyperactivity Disorder (ADHD) Drugs Industry face during its growth?

  • A key challenge affecting industry growth is the complex web of regulatory requirements and the classification of many primary treatments as Schedule II controlled substances.

  • Navigating the complex regulatory landscape presents a significant challenge, with requirements for prescription drug monitoring programs and oversight of active pharmaceutical ingredients. The development of novel norepinephrine reuptake inhibitors and alpha-2 adrenergic receptor agonists is partly a response to the difficulties associated with managing central nervous system disorders with controlled substances.
  • Gaps in clinical trial data for long-term use create uncertainty for both providers and patients dealing with neurodevelopmental symptoms. This has led to a rise in holistic behavioral interventions and patient-centric care models.
  • Addressing treatment-resistant adhd and managing medication side effect profiles are ongoing issues, driving a 20% increase in off-label prescribing in some clinics and underscoring the need for more versatile therapies that limit drug diversion prevention risks.

Exclusive Technavio Analysis on Customer Landscape

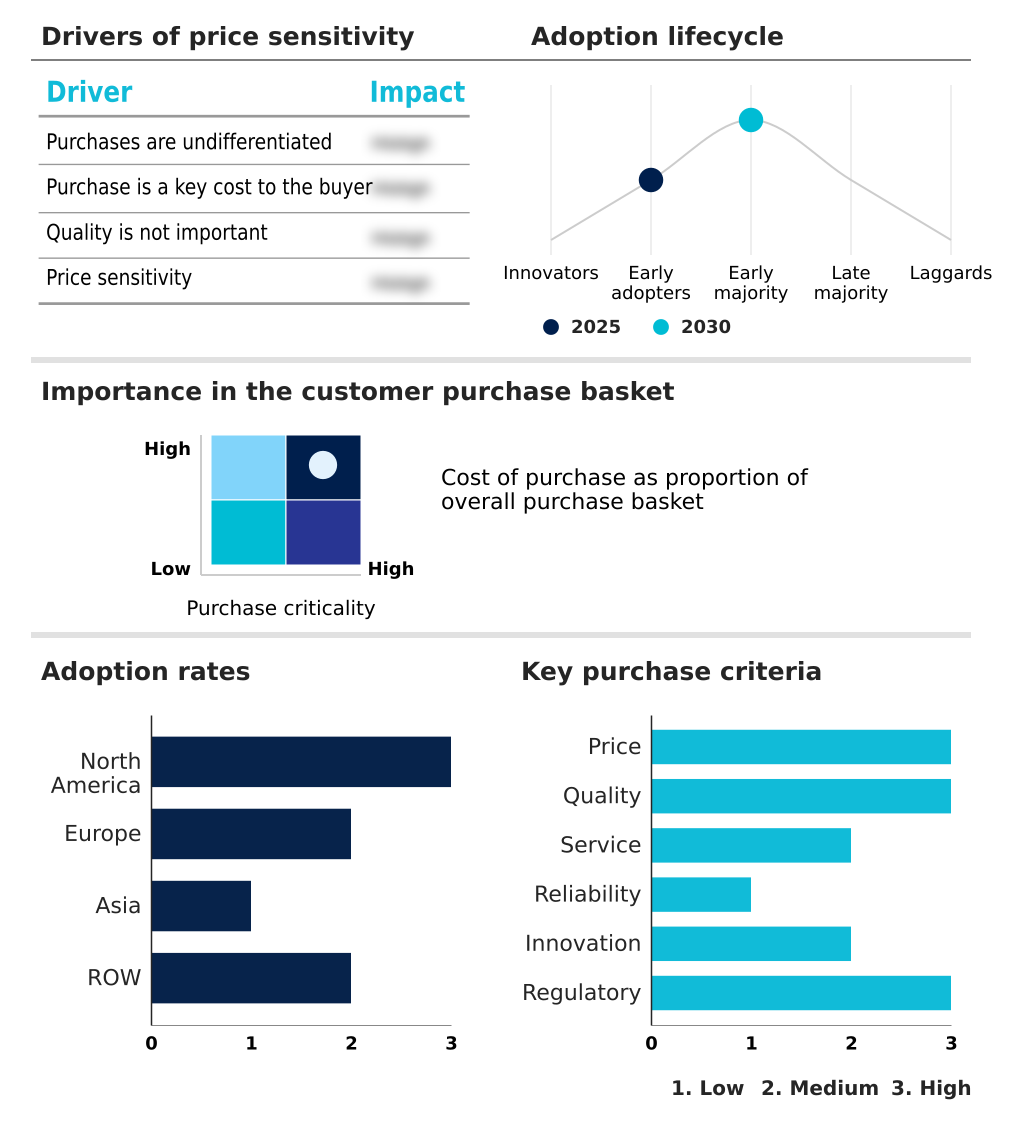
The attention deficit hyperactivity disorder (adhd) drugs market forecasting report includes the adoption lifecycle of the market, covering from the innovator’s stage to the laggard’s stage. It focuses on adoption rates in different regions based on penetration. Furthermore, the attention deficit hyperactivity disorder (adhd) drugs market report also includes key purchase criteria and drivers of price sensitivity to help companies evaluate and develop their market growth analysis strategies.

Customer Landscape of Attention Deficit Hyperactivity Disorder (ADHD) Drugs Industry

Competitive Landscape

Companies are implementing various strategies, such as strategic alliances, attention deficit hyperactivity disorder (adhd) drugs market forecast, partnerships, mergers and acquisitions, geographical expansion, and product/service launches, to enhance their presence in the industry.

AJENAT PHARMACEUTICALS - Specialized ADHD drugs, including non-stimulant and advanced extended-release formulations, address diverse patient needs within central nervous system disorders.

The industry research and growth report includes detailed analyses of the competitive landscape of the market and information about key companies, including:

  • AJENAT PHARMACEUTICALS
  • Amneal Pharmaceuticals Inc.
  • Aurobindo Pharma Ltd.
  • Aytu BioPharma Inc.
  • Azurity Pharmaceuticals Inc.
  • Camber Pharmaceuticals Inc.
  • Dr. Reddys Laboratories Ltd.
  • Eli Lilly and Co.
  • Glenmark Pharmaceuticals Ltd.
  • Granules India Ltd.
  • Johnson and Johnson Services
  • Novartis AG
  • Otsuka Holdings Co. Ltd.
  • Sandoz Group AG
  • SHIONOGI Co. Ltd.
  • Supernus Pharmaceuticals Inc.
  • Takeda Pharmaceutical Ltd.
  • Teva Pharmaceutical Ltd.
  • Tris Pharma Inc.
  • Viatris Inc.

Qualitative and quantitative analysis of companies has been conducted to help clients understand the wider business environment as well as the strengths and weaknesses of key industry players. Data is qualitatively analyzed to categorize companies as pure play, category-focused, industry-focused, and diversified; it is quantitatively analyzed to categorize companies as dominant, leading, strong, tentative, and weak.

Recent Development and News in Attention deficit hyperactivity disorder (adhd) drugs market

  • In January 2025, ABVC BioPharma announced the expansion of its global patent portfolio for ABV-1505, a botanical-based investigational treatment for ADHD.
  • In March 2025, Glenmark Pharmaceuticals Inc. recalled close to 1.48 million bottles of atomoxetine (a non-stimulant ADHD medication) in the U.S. market.
  • In June 2025, Lumos Labs obtained U.S. FDA 510(k) clearance for LumosityRx, a prescription digital therapeutic designed to enhance attention in adults with ADHD.
  • In July 2025, Supernus Pharmaceuticals completed the acquisition of Sage Therapeutics, significantly expanding its neuroscience portfolio.

Dive into Technavio’s robust research methodology, blending expert interviews, extensive data synthesis, and validated models for unparalleled Attention Deficit Hyperactivity Disorder (ADHD) Drugs Market insights. See full methodology.

Market Scope
Page number 283
Base year 2025
Historic period 2020-2024
Forecast period 2026-2030
Growth momentum & CAGR Accelerate at a CAGR of 6.7%
Market growth 2026-2030 USD 6181.7 million
Market structure Fragmented
YoY growth 2025-2026(%) 6.3%
Key countries US, Canada, Mexico, Germany, UK, France, Italy, The Netherlands, Spain, Russia, China, India, Japan, South Korea, Indonesia, Thailand, Singapore, Australia, Brazil, South Africa, UAE, Saudi Arabia and Turkey
Competitive landscape Leading Companies, Market Positioning of Companies, Competitive Strategies, and Industry Risks

Request Free Sample

Research Analyst Overview

  • The attention deficit hyperactivity disorder (ADHD) drugs market is shaped by innovation in pharmacological intervention and strict regulatory frameworks. While traditional stimulant medications like amphetamine salts and methylphenidate hcl remain prevalent, the focus is shifting toward non-stimulant medications such as atomoxetine and novel norepinephrine reuptake inhibitors to address neurodevelopmental symptoms.
  • A key boardroom consideration is navigating patent expiration through strategic formulation development of next-generation extended-release formulations. The high cost of the regulatory approval process for central nervous system disorders demands efficient clinical trial data management, where integrating patient-reported outcomes has been shown to improve trial success rates by over 20%.
  • The entire ecosystem, from sourcing active pharmaceutical ingredients to distribution, is governed by controls on schedule ii substances, making supply chain resilience a top priority. Managing comorbidity management and ensuring precise dosage titration are central to achieving positive therapeutic outcomes and demonstrating value in a market with intense generic drug competition.
  • Advanced drug delivery technology, including transdermal patches, is crucial for improving pharmacokinetic profiles and medication adherence.

What are the Key Data Covered in this Attention Deficit Hyperactivity Disorder (ADHD) Drugs Market Research and Growth Report?

  • What is the expected growth of the Attention Deficit Hyperactivity Disorder (ADHD) Drugs Market between 2026 and 2030?

    • USD 6.18 billion, at a CAGR of 6.7%

  • What segmentation does the market report cover?

    • The report is segmented by Product (Stimulant, and Non-stimulant), End-user (Children, and Adults), Distribution Channel (Retail pharmacy, Hospital pharmacy, and Online) and Geography (North America, Europe, Asia, Rest of World (ROW))

  • Which regions are analyzed in the report?

    • North America, Europe, Asia and Rest of World (ROW)

  • What are the key growth drivers and market challenges?

    • Enhanced diagnostic procedures for adult populations, Complex regulatory requirements and schedule II classifications

  • Who are the major players in the Attention Deficit Hyperactivity Disorder (ADHD) Drugs Market?

    • AJENAT PHARMACEUTICALS, Amneal Pharmaceuticals Inc., Aurobindo Pharma Ltd., Aytu BioPharma Inc., Azurity Pharmaceuticals Inc., Camber Pharmaceuticals Inc., Dr. Reddys Laboratories Ltd., Eli Lilly and Co., Glenmark Pharmaceuticals Ltd., Granules India Ltd., Johnson and Johnson Services, Novartis AG, Otsuka Holdings Co. Ltd., Sandoz Group AG, SHIONOGI Co. Ltd., Supernus Pharmaceuticals Inc., Takeda Pharmaceutical Ltd., Teva Pharmaceutical Ltd., Tris Pharma Inc. and Viatris Inc.

Market Research Insights

  • The market is shaped by a move toward patient-centric care, with an emphasis on holistic behavioral interventions and behavioral health integration. The rise of telepsychiatry services has broadened access, contributing to a 25% increase in adult adhd diagnosis rates in underserved areas.
  • This digital shift, combined with electronic health records integration, allows for better tracking of treatment-resistant adhd and informs market access strategies. Insurance reimbursement policies are adapting, with some plans now covering digital therapeutics, which have demonstrated up to a 15% improvement in executive function.
  • This evolving landscape requires manufacturers to navigate complex psychotropic substance oversight and align with clinical practice guidelines that increasingly favor a multimodal approach.

We can help! Our analysts can customize this attention deficit hyperactivity disorder (adhd) drugs market research report to meet your requirements.

Get in touch

1. Executive Summary

1.1 Market overview

Executive Summary - Chart on Market Overview
Executive Summary - Data Table on Market Overview
Executive Summary - Chart on Global Market Characteristics
Executive Summary - Chart on Market by Geography
Executive Summary - Chart on Market Segmentation by Product
Executive Summary - Chart on Market Segmentation by End-user
Executive Summary - Chart on Market Segmentation by Distribution Channel
Executive Summary - Chart on Incremental Growth
Executive Summary - Data Table on Incremental Growth
Executive Summary - Chart on Company Market Positioning

2. Technavio Analysis

2.1 Analysis of price sensitivity, lifecycle, customer purchase basket, adoption rates, and purchase criteria

2.2 Criticality of inputs and Factors of differentiation

Chart on Overview on criticality of inputs and factors of differentiation

2.3 Factors of disruption

Chart on Overview on factors of disruption

2.4 Impact of drivers and challenges

Chart on Impact of drivers and challenges in 2025 and 2030

3. Market Landscape

3.1 Market ecosystem

Chart on Parent Market
Data Table on - Parent Market

3.2 Market characteristics

Chart on Market characteristics analysis

3.3 Value chain analysis

Chart on Value chain analysis

4. Market Sizing

4.1 Market definition

Data Table on Offerings of companies included in the market definition

4.2 Market segment analysis

Market segments

4.3 Market size 2025

4.4 Market outlook: Forecast for 2025-2030

Chart on Global - Market size and forecast 2025-2030 ($ million)
Data Table on Global - Market size and forecast 2025-2030 ($ million)
Chart on Global Market: Year-over-year growth 2025-2030 (%)
Data Table on Global Market: Year-over-year growth 2025-2030 (%)

5. Historic Market Size

5.1 Global Attention Deficit Hyperactivity Disorder (ADHD) Drugs Market 2020 - 2024

Historic Market Size - Data Table on Global Attention Deficit Hyperactivity Disorder (ADHD) Drugs Market 2020 - 2024 ($ million)

5.2 Product segment analysis 2020 - 2024

Historic Market Size - Product Segment 2020 - 2024 ($ million)

5.3 End-user segment analysis 2020 - 2024

Historic Market Size - End-user Segment 2020 - 2024 ($ million)

5.4 Distribution Channel segment analysis 2020 - 2024

Historic Market Size - Distribution Channel Segment 2020 - 2024 ($ million)

5.5 Geography segment analysis 2020 - 2024

Historic Market Size - Geography Segment 2020 - 2024 ($ million)

5.6 Country segment analysis 2020 - 2024

Historic Market Size - Country Segment 2020 - 2024 ($ million)

6. Qualitative Analysis

6.1 Impact of AI on Global Attention Deficit Hyperactivity Disorder (ADHD) Drugs Market

7. Five Forces Analysis

7.1 Five forces summary

Five forces analysis - Comparison between 2025 and 2030

7.2 Bargaining power of buyers

Bargaining power of buyers - Impact of key factors 2025 and 2030

7.3 Bargaining power of suppliers

Bargaining power of suppliers - Impact of key factors in 2025 and 2030

7.4 Threat of new entrants

Threat of new entrants - Impact of key factors in 2025 and 2030

7.5 Threat of substitutes

Threat of substitutes - Impact of key factors in 2025 and 2030

7.6 Threat of rivalry

Threat of rivalry - Impact of key factors in 2025 and 2030

7.7 Market condition

Chart on Market condition - Five forces 2025 and 2030

8. Market Segmentation by Product

8.1 Market segments

Chart on Product - Market share 2025-2030 (%)
Data Table on Product - Market share 2025-2030 (%)

8.2 Comparison by Product

Chart on Comparison by Product
Data Table on Comparison by Product

8.3 Stimulant - Market size and forecast 2025-2030

Chart on Stimulant - Market size and forecast 2025-2030 ($ million)
Data Table on Stimulant - Market size and forecast 2025-2030 ($ million)
Chart on Stimulant - Year-over-year growth 2025-2030 (%)
Data Table on Stimulant - Year-over-year growth 2025-2030 (%)

8.4 Non-stimulant - Market size and forecast 2025-2030

Chart on Non-stimulant - Market size and forecast 2025-2030 ($ million)
Data Table on Non-stimulant - Market size and forecast 2025-2030 ($ million)
Chart on Non-stimulant - Year-over-year growth 2025-2030 (%)
Data Table on Non-stimulant - Year-over-year growth 2025-2030 (%)

8.5 Market opportunity by Product

Market opportunity by Product ($ million)
Data Table on Market opportunity by Product ($ million)

9. Market Segmentation by End-user

9.1 Market segments

Chart on End-user - Market share 2025-2030 (%)
Data Table on End-user - Market share 2025-2030 (%)

9.2 Comparison by End-user

Chart on Comparison by End-user
Data Table on Comparison by End-user

9.3 Children - Market size and forecast 2025-2030

Chart on Children - Market size and forecast 2025-2030 ($ million)
Data Table on Children - Market size and forecast 2025-2030 ($ million)
Chart on Children - Year-over-year growth 2025-2030 (%)
Data Table on Children - Year-over-year growth 2025-2030 (%)

9.4 Adults - Market size and forecast 2025-2030

Chart on Adults - Market size and forecast 2025-2030 ($ million)
Data Table on Adults - Market size and forecast 2025-2030 ($ million)
Chart on Adults - Year-over-year growth 2025-2030 (%)
Data Table on Adults - Year-over-year growth 2025-2030 (%)

9.5 Market opportunity by End-user

Market opportunity by End-user ($ million)
Data Table on Market opportunity by End-user ($ million)

10. Market Segmentation by Distribution Channel

10.1 Market segments

Chart on Distribution Channel - Market share 2025-2030 (%)
Data Table on Distribution Channel - Market share 2025-2030 (%)

10.2 Comparison by Distribution Channel

Chart on Comparison by Distribution Channel
Data Table on Comparison by Distribution Channel

10.3 Retail pharmacy - Market size and forecast 2025-2030

Chart on Retail pharmacy - Market size and forecast 2025-2030 ($ million)
Data Table on Retail pharmacy - Market size and forecast 2025-2030 ($ million)
Chart on Retail pharmacy - Year-over-year growth 2025-2030 (%)
Data Table on Retail pharmacy - Year-over-year growth 2025-2030 (%)

10.4 Hospital pharmacy - Market size and forecast 2025-2030

Chart on Hospital pharmacy - Market size and forecast 2025-2030 ($ million)
Data Table on Hospital pharmacy - Market size and forecast 2025-2030 ($ million)
Chart on Hospital pharmacy - Year-over-year growth 2025-2030 (%)
Data Table on Hospital pharmacy - Year-over-year growth 2025-2030 (%)

10.5 Online - Market size and forecast 2025-2030

Chart on Online - Market size and forecast 2025-2030 ($ million)
Data Table on Online - Market size and forecast 2025-2030 ($ million)
Chart on Online - Year-over-year growth 2025-2030 (%)
Data Table on Online - Year-over-year growth 2025-2030 (%)

10.6 Market opportunity by Distribution Channel

Market opportunity by Distribution Channel ($ million)
Data Table on Market opportunity by Distribution Channel ($ million)

11. Customer Landscape

11.1 Customer landscape overview

Analysis of price sensitivity, lifecycle, customer purchase basket, adoption rates, and purchase criteria

12. Geographic Landscape

12.1 Geographic segmentation

Chart on Market share by geography 2025-2030 (%)
Data Table on Market share by geography 2025-2030 (%)

12.2 Geographic comparison

Chart on Geographic comparison
Data Table on Geographic comparison

12.3 North America - Market size and forecast 2025-2030

Chart on North America - Market size and forecast 2025-2030 ($ million)
Data Table on North America - Market size and forecast 2025-2030 ($ million)
Chart on North America - Year-over-year growth 2025-2030 (%)
Data Table on North America - Year-over-year growth 2025-2030 (%)
Chart on Regional Comparison - North America
Data Table on Regional Comparison - North America

12.3.1 US - Market size and forecast 2025-2030

Chart on US - Market size and forecast 2025-2030 ($ million)
Data Table on US - Market size and forecast 2025-2030 ($ million)
Chart on US - Year-over-year growth 2025-2030 (%)
Data Table on US - Year-over-year growth 2025-2030 (%)

12.3.2 Canada - Market size and forecast 2025-2030

Chart on Canada - Market size and forecast 2025-2030 ($ million)
Data Table on Canada - Market size and forecast 2025-2030 ($ million)
Chart on Canada - Year-over-year growth 2025-2030 (%)
Data Table on Canada - Year-over-year growth 2025-2030 (%)

12.3.3 Mexico - Market size and forecast 2025-2030

Chart on Mexico - Market size and forecast 2025-2030 ($ million)
Data Table on Mexico - Market size and forecast 2025-2030 ($ million)
Chart on Mexico - Year-over-year growth 2025-2030 (%)
Data Table on Mexico - Year-over-year growth 2025-2030 (%)

12.4 Europe - Market size and forecast 2025-2030

Chart on Europe - Market size and forecast 2025-2030 ($ million)
Data Table on Europe - Market size and forecast 2025-2030 ($ million)
Chart on Europe - Year-over-year growth 2025-2030 (%)
Data Table on Europe - Year-over-year growth 2025-2030 (%)
Chart on Regional Comparison - Europe
Data Table on Regional Comparison - Europe

12.4.1 Germany - Market size and forecast 2025-2030

Chart on Germany - Market size and forecast 2025-2030 ($ million)
Data Table on Germany - Market size and forecast 2025-2030 ($ million)
Chart on Germany - Year-over-year growth 2025-2030 (%)
Data Table on Germany - Year-over-year growth 2025-2030 (%)

12.4.2 UK - Market size and forecast 2025-2030

Chart on UK - Market size and forecast 2025-2030 ($ million)
Data Table on UK - Market size and forecast 2025-2030 ($ million)
Chart on UK - Year-over-year growth 2025-2030 (%)
Data Table on UK - Year-over-year growth 2025-2030 (%)

12.4.3 France - Market size and forecast 2025-2030

Chart on France - Market size and forecast 2025-2030 ($ million)
Data Table on France - Market size and forecast 2025-2030 ($ million)
Chart on France - Year-over-year growth 2025-2030 (%)
Data Table on France - Year-over-year growth 2025-2030 (%)

12.4.4 Italy - Market size and forecast 2025-2030

Chart on Italy - Market size and forecast 2025-2030 ($ million)
Data Table on Italy - Market size and forecast 2025-2030 ($ million)
Chart on Italy - Year-over-year growth 2025-2030 (%)
Data Table on Italy - Year-over-year growth 2025-2030 (%)

12.4.5 The Netherlands - Market size and forecast 2025-2030

Chart on The Netherlands - Market size and forecast 2025-2030 ($ million)
Data Table on The Netherlands - Market size and forecast 2025-2030 ($ million)
Chart on The Netherlands - Year-over-year growth 2025-2030 (%)
Data Table on The Netherlands - Year-over-year growth 2025-2030 (%)

12.4.6 Spain - Market size and forecast 2025-2030

Chart on Spain - Market size and forecast 2025-2030 ($ million)
Data Table on Spain - Market size and forecast 2025-2030 ($ million)
Chart on Spain - Year-over-year growth 2025-2030 (%)
Data Table on Spain - Year-over-year growth 2025-2030 (%)

12.4.7 Russia - Market size and forecast 2025-2030

Chart on Russia - Market size and forecast 2025-2030 ($ million)
Data Table on Russia - Market size and forecast 2025-2030 ($ million)
Chart on Russia - Year-over-year growth 2025-2030 (%)
Data Table on Russia - Year-over-year growth 2025-2030 (%)

12.5 Asia - Market size and forecast 2025-2030

Chart on Asia - Market size and forecast 2025-2030 ($ million)
Data Table on Asia - Market size and forecast 2025-2030 ($ million)
Chart on Asia - Year-over-year growth 2025-2030 (%)
Data Table on Asia - Year-over-year growth 2025-2030 (%)
Chart on Regional Comparison - Asia
Data Table on Regional Comparison - Asia

12.5.1 China - Market size and forecast 2025-2030

Chart on China - Market size and forecast 2025-2030 ($ million)
Data Table on China - Market size and forecast 2025-2030 ($ million)
Chart on China - Year-over-year growth 2025-2030 (%)
Data Table on China - Year-over-year growth 2025-2030 (%)

12.5.2 India - Market size and forecast 2025-2030

Chart on India - Market size and forecast 2025-2030 ($ million)
Data Table on India - Market size and forecast 2025-2030 ($ million)
Chart on India - Year-over-year growth 2025-2030 (%)
Data Table on India - Year-over-year growth 2025-2030 (%)

12.5.3 Japan - Market size and forecast 2025-2030

Chart on Japan - Market size and forecast 2025-2030 ($ million)
Data Table on Japan - Market size and forecast 2025-2030 ($ million)
Chart on Japan - Year-over-year growth 2025-2030 (%)
Data Table on Japan - Year-over-year growth 2025-2030 (%)

12.5.4 South Korea - Market size and forecast 2025-2030

Chart on South Korea - Market size and forecast 2025-2030 ($ million)
Data Table on South Korea - Market size and forecast 2025-2030 ($ million)
Chart on South Korea - Year-over-year growth 2025-2030 (%)
Data Table on South Korea - Year-over-year growth 2025-2030 (%)

12.5.5 Indonesia - Market size and forecast 2025-2030

Chart on Indonesia - Market size and forecast 2025-2030 ($ million)
Data Table on Indonesia - Market size and forecast 2025-2030 ($ million)
Chart on Indonesia - Year-over-year growth 2025-2030 (%)
Data Table on Indonesia - Year-over-year growth 2025-2030 (%)

12.5.6 Thailand - Market size and forecast 2025-2030

Chart on Thailand - Market size and forecast 2025-2030 ($ million)
Data Table on Thailand - Market size and forecast 2025-2030 ($ million)
Chart on Thailand - Year-over-year growth 2025-2030 (%)
Data Table on Thailand - Year-over-year growth 2025-2030 (%)

12.5.7 Singapore - Market size and forecast 2025-2030

Chart on Singapore - Market size and forecast 2025-2030 ($ million)
Data Table on Singapore - Market size and forecast 2025-2030 ($ million)
Chart on Singapore - Year-over-year growth 2025-2030 (%)
Data Table on Singapore - Year-over-year growth 2025-2030 (%)

12.6 Rest of World (ROW) - Market size and forecast 2025-2030

Chart on Rest of World (ROW) - Market size and forecast 2025-2030 ($ million)
Data Table on Rest of World (ROW) - Market size and forecast 2025-2030 ($ million)
Chart on Rest of World (ROW) - Year-over-year growth 2025-2030 (%)
Data Table on Rest of World (ROW) - Year-over-year growth 2025-2030 (%)
Chart on Regional Comparison - Rest of World (ROW)
Data Table on Regional Comparison - Rest of World (ROW)

12.6.1 Australia - Market size and forecast 2025-2030

Chart on Australia - Market size and forecast 2025-2030 ($ million)
Data Table on Australia - Market size and forecast 2025-2030 ($ million)
Chart on Australia - Year-over-year growth 2025-2030 (%)
Data Table on Australia - Year-over-year growth 2025-2030 (%)

12.6.2 Brazil - Market size and forecast 2025-2030

Chart on Brazil - Market size and forecast 2025-2030 ($ million)
Data Table on Brazil - Market size and forecast 2025-2030 ($ million)
Chart on Brazil - Year-over-year growth 2025-2030 (%)
Data Table on Brazil - Year-over-year growth 2025-2030 (%)

12.6.3 South Africa - Market size and forecast 2025-2030

Chart on South Africa - Market size and forecast 2025-2030 ($ million)
Data Table on South Africa - Market size and forecast 2025-2030 ($ million)
Chart on South Africa - Year-over-year growth 2025-2030 (%)
Data Table on South Africa - Year-over-year growth 2025-2030 (%)

12.6.4 UAE - Market size and forecast 2025-2030

Chart on UAE - Market size and forecast 2025-2030 ($ million)
Data Table on UAE - Market size and forecast 2025-2030 ($ million)
Chart on UAE - Year-over-year growth 2025-2030 (%)
Data Table on UAE - Year-over-year growth 2025-2030 (%)

12.6.5 Saudi Arabia - Market size and forecast 2025-2030

Chart on Saudi Arabia - Market size and forecast 2025-2030 ($ million)
Data Table on Saudi Arabia - Market size and forecast 2025-2030 ($ million)
Chart on Saudi Arabia - Year-over-year growth 2025-2030 (%)
Data Table on Saudi Arabia - Year-over-year growth 2025-2030 (%)

12.6.6 Turkey - Market size and forecast 2025-2030

Chart on Turkey - Market size and forecast 2025-2030 ($ million)
Data Table on Turkey - Market size and forecast 2025-2030 ($ million)
Chart on Turkey - Year-over-year growth 2025-2030 (%)
Data Table on Turkey - Year-over-year growth 2025-2030 (%)

12.7 Market opportunity by geography

Market opportunity by geography ($ million)
Data Tables on Market opportunity by geography ($ million)

13. Drivers, Challenges, and Opportunity

13.1 Market drivers

Enhanced diagnostic procedures for adult populations
Technological innovations in sustained-release drug delivery systems
Expansion of mental health advocacy and reimbursement policies

13.2 Market challenges

Complex regulatory requirements and schedule II classifications
Chronic supply chain disruptions and shortages of raw materials
Emergence of digital therapeutics and holistic behavioral interventions

13.3 Impact of drivers and challenges

Impact of drivers and challenges in 2025 and 2030

13.4 Market opportunities

Proliferation of non-stimulant pharmacological alternatives
Integration of telehealth and digital pharmacy distribution networks
Strategic alliances and vertical integration in pharmaceutical supply chain

14. Competitive Landscape

14.1 Overview

14.2

Overview on criticality of inputs and factors of differentiation

14.3 Landscape disruption

Overview on factors of disruption

14.4 Industry risks

Impact of key risks on business

15. Competitive Analysis

15.1 Companies profiled

Companies covered

15.2 Company ranking index

15.3 Market positioning of companies

Matrix on companies position and classification

15.4 Amneal Pharmaceuticals Inc.

Amneal Pharmaceuticals Inc. - Overview
Amneal Pharmaceuticals Inc. - Business segments
Amneal Pharmaceuticals Inc. - Key news
Amneal Pharmaceuticals Inc. - Key offerings
Amneal Pharmaceuticals Inc. - Segment focus
SWOT

15.5 Aurobindo Pharma Ltd.

Aurobindo Pharma Ltd. - Overview
Aurobindo Pharma Ltd. - Product / Service
Aurobindo Pharma Ltd. - Key offerings
SWOT

15.6 Aytu BioPharma Inc.

Aytu BioPharma Inc. - Overview
Aytu BioPharma Inc. - Product / Service
Aytu BioPharma Inc. - Key offerings
SWOT

15.7 Dr. Reddys Laboratories Ltd.

Dr. Reddys Laboratories Ltd. - Overview
Dr. Reddys Laboratories Ltd. - Business segments
Dr. Reddys Laboratories Ltd. - Key news
Dr. Reddys Laboratories Ltd. - Key offerings
Dr. Reddys Laboratories Ltd. - Segment focus
SWOT

15.8 Eli Lilly and Co.

Eli Lilly and Co. - Overview
Eli Lilly and Co. - Product / Service
Eli Lilly and Co. - Key offerings
SWOT

15.9 Glenmark Pharmaceuticals Ltd.

Glenmark Pharmaceuticals Ltd. - Overview
Glenmark Pharmaceuticals Ltd. - Product / Service
Glenmark Pharmaceuticals Ltd. - Key offerings
SWOT

15.10 Johnson and Johnson Services

Johnson and Johnson Services - Overview
Johnson and Johnson Services - Business segments
Johnson and Johnson Services - Key news
Johnson and Johnson Services - Key offerings
Johnson and Johnson Services - Segment focus
SWOT

15.11 Novartis AG

Novartis AG - Overview
Novartis AG - Business segments
Novartis AG - Key news
Novartis AG - Key offerings
Novartis AG - Segment focus
SWOT

15.12 Otsuka Holdings Co. Ltd.

Otsuka Holdings Co. Ltd. - Overview
Otsuka Holdings Co. Ltd. - Business segments
Otsuka Holdings Co. Ltd. - Key news
Otsuka Holdings Co. Ltd. - Key offerings
Otsuka Holdings Co. Ltd. - Segment focus
SWOT

15.13 Sandoz Group AG

Sandoz Group AG - Overview
Sandoz Group AG - Product / Service
Sandoz Group AG - Key offerings
SWOT

15.14 SHIONOGI Co. Ltd.

SHIONOGI Co. Ltd. - Overview
SHIONOGI Co. Ltd. - Product / Service
SHIONOGI Co. Ltd. - Key offerings
SWOT

15.15 Supernus Pharmaceuticals Inc.

Supernus Pharmaceuticals Inc. - Overview
Supernus Pharmaceuticals Inc. - Product / Service
Supernus Pharmaceuticals Inc. - Key offerings
SWOT

15.16 Takeda Pharmaceutical Ltd.

Takeda Pharmaceutical Ltd. - Overview
Takeda Pharmaceutical Ltd. - Business segments
Takeda Pharmaceutical Ltd. - Key news
Takeda Pharmaceutical Ltd. - Key offerings
Takeda Pharmaceutical Ltd. - Segment focus
SWOT

15.17 Teva Pharmaceutical Ltd.

Teva Pharmaceutical Ltd. - Overview
Teva Pharmaceutical Ltd. - Business segments
Teva Pharmaceutical Ltd. - Key news
Teva Pharmaceutical Ltd. - Key offerings
Teva Pharmaceutical Ltd. - Segment focus
SWOT

15.18 Tris Pharma Inc.

Tris Pharma Inc. - Overview
Tris Pharma Inc. - Product / Service
Tris Pharma Inc. - Key offerings
SWOT

16. Appendix

16.1 Scope of the report

Market definition
Objectives
Notes and caveats

16.2 Inclusions and exclusions checklist

Inclusions checklist
Exclusions checklist

16.3 Currency conversion rates for US$

16.4 Research methodology

16.5 Data procurement

Information sources

16.6 Data validation

16.7 Validation techniques employed for market sizing

16.8 Data synthesis

16.9 360 degree market analysis

16.10 List of abbreviations

Research Methodology

Technavio presents a detailed picture of the market by way of study, synthesis, and summation of data from multiple sources. The analysts have presented the various facets of the market with a particular focus on identifying the key industry influencers. The data thus presented is comprehensive, reliable, and the result of extensive research, both primary and secondary.

INFORMATION SOURCES

Primary sources

  • Manufacturers and suppliers
  • Channel partners
  • Industry experts
  • Strategic decision makers

Secondary sources

  • Industry journals and periodicals
  • Government data
  • Financial reports of key industry players
  • Historical data
  • Press releases

DATA ANALYSIS

Data Synthesis

  • Collation of data
  • Estimation of key figures
  • Analysis of derived insights

Data Validation

  • Triangulation with data models
  • Reference against proprietary databases
  • Corroboration with industry experts

REPORT WRITING

Qualitative

  • Market drivers
  • Market challenges
  • Market trends
  • Five forces analysis

Quantitative

  • Market size and forecast
  • Market segmentation
  • Geographical insights
  • Competitive landscape

Interested in this report?

Get your sample now to see our research methodology and insights!

Download Now

Frequently Asked Questions

Attention Deficit Hyperactivity Disorder (ADHD) Drugs market growth will increase by USD 6181.7 million during 2026-2030.

The Attention Deficit Hyperactivity Disorder (ADHD) Drugs market is expected to grow at a CAGR of 6.7% during 2026-2030.

Attention Deficit Hyperactivity Disorder (ADHD) Drugs market is segmented by Product (Stimulant, Non-stimulant) End-user (Children, Adults) Distribution channel (Retail pharmacy, Hospital pharmacy, Online)

AJENAT PHARMACEUTICALS, Amneal Pharmaceuticals Inc., Aurobindo Pharma Ltd., Aytu BioPharma Inc., Azurity Pharmaceuticals Inc., Camber Pharmaceuticals Inc., Dr. Reddys Laboratories Ltd., Eli Lilly and Co., Glenmark Pharmaceuticals Ltd., Granules India Ltd., Johnson and Johnson Services, Novartis AG, Otsuka Holdings Co. Ltd., Sandoz Group AG, SHIONOGI Co. Ltd., Supernus Pharmaceuticals Inc., Takeda Pharmaceutical Ltd., Teva Pharmaceutical Ltd., Tris Pharma Inc., Viatris Inc. are a few of the key vendors in the Attention Deficit Hyperactivity Disorder (ADHD) Drugs market.

North America will register the highest growth rate of 31.6% among the other regions. Therefore, the Attention Deficit Hyperactivity Disorder (ADHD) Drugs market in North America is expected to garner significant business opportunities for the vendors during the forecast period.

US, Canada, Mexico, Germany, UK, France, Italy, The Netherlands, Spain, Russia, China, India, Japan, South Korea, Indonesia, Thailand, Singapore, Australia, Brazil, South Africa, UAE, Saudi Arabia, Turkey

  • Enhanced diagnostic procedures for adult populations is the driving factor this market.

The Attention Deficit Hyperactivity Disorder (ADHD) Drugs market vendors should focus on grabbing business opportunities from the Product segment as it accounted for the largest market share in the base year.
RIA - Research AI Assistant
Ask RIA