Artificial Intelligence Market in the Industrial Sector Analysis North America, APAC, Europe, Middle East and Africa, South America - US, Saudi Arabia, China, Germany, UK - Size and Forecast 2024-2028

Artificial Intelligence Market in the Industrial Sector Analysis North America, APAC, Europe, Middle East and Africa, South America - US, Saudi Arabia, China, Germany, UK - Size and Forecast 2024-2028

Published: Mar 2024 187 Pages SKU: IRTNTR70661

Market Overview at a Glance

$29.30 B
Market Opportunity
38.86%
CAGR
35.89
YoY growth 2023-2024(%)

Artificial Intelligence Market in the Industrial Sector Size 2024-2028 

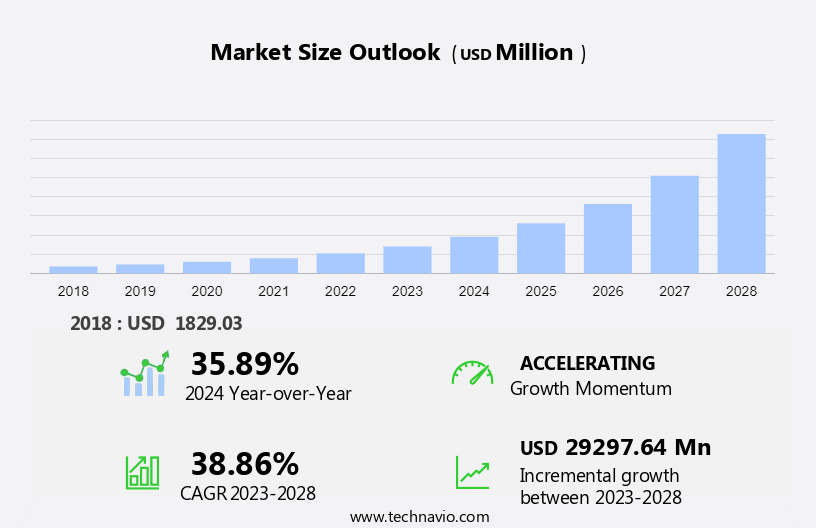
The artificial intelligence market in the industrial sector size is forecast to increase by USD 29.3 billion at a CAGR of 38.86% between 2023 and 2028.

  • The artificial intelligence (AI) market in the industrial sector is experiencing significant growth, driven by several key trends. Digital twin technology is gaining traction in industries, enabling real-time monitoring and predictive maintenance of machinery. The emergence of the Industrial Internet of Things (IIoT) is facilitating the integration of AI into industrial processes, enhancing efficiency and productivity. However, the lack of technical knowledge among operators poses a challenge, necessitating the development of user-friendly AI solutions.
  • Additionally, data security and privacy concerns are becoming increasingly important, requiring strong security measures to protect sensitive industrial data. Overall, the AI market in the industrial sector is poised for substantial growth, driven by these trends and the need to optimize industrial processes and enhance productivity.

What will be the Artificial Intelligence Market Size in the Industrial Sector During the Forecast Period?

Artificial Intelligence Market in the Industrial Sector Size

 Request Free Sample

  • Artificial Intelligence (AI) is revolutionizing the industrial sector with its ability to enhance efficiency, productivity, and accuracy. Big data and AI are at the heart of this transformation, with machine learning algorithms enabling real-time monitoring and predictive maintenance of industrial machines. Speech processing and natural language processing are key components of AI, enabling seamless communication between humans and smart machines. Generative AI and computer vision are driving innovation in areas such as quality control and supply chain optimization. Intelligent robotics are being integrated into manufacturing processes to automate repetitive tasks and improve overall production. Technology and communication are being transformed by AI, with chatbots and AI art generators enabling new forms of content creation.
  • Additionally, federated learning and explainable AI are emerging trends, enabling decentralized machine learning and improving the transparency and interpretability of AI systems. Decision-making is being enhanced through AI, with real-time data analysis and predictive analytics enabling more informed decisions. Edge AI is also gaining traction, enabling AI processing at the edge of the network for faster response times and reduced latency. Overall, AI is set to continue transforming the industrial sector, with applications ranging from quality control to supply chain optimization and intelligent robotics.

How is this market segmented and which is the largest segment?

The market research report provides comprehensive data (region-wise segment analysis), with forecasts and estimates in "USD billion" for the period 2024-2028, as well as historical data from 2018-2022 for the following segments.
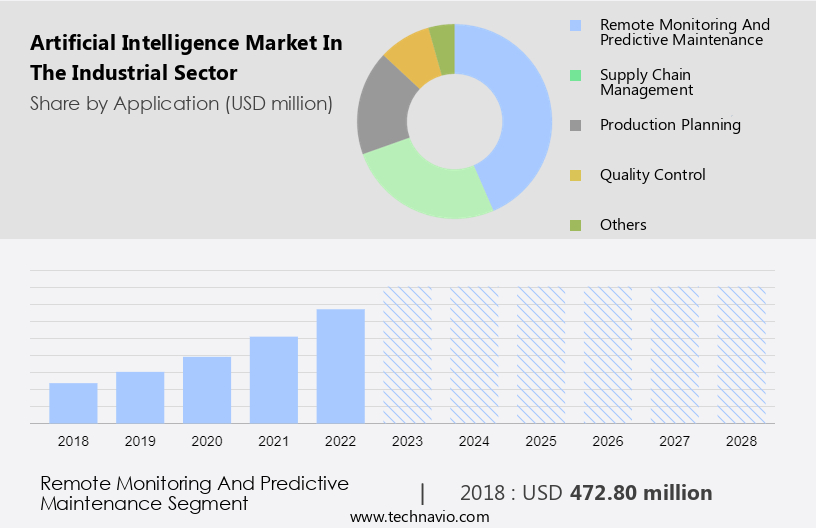
  • Application
    • Remote monitoring and predictive maintenance
    • Supply chain management
    • Production planning
    • Quality control
    • Others
  • End-user
    • Process industries
    • Discrete industries
  • Geography
    • North America
      • US
    • APAC
      • China
    • Europe
      • Germany
      • UK
    • Middle East and Africa
    • South America

By Application Insights

  • The remote monitoring and predictive maintenance segment is estimated to witness significant growth during the forecast period.

Artificial Intelligence (AI) is revolutionizing the industrial sector by enhancing efficiency, productivity, and safety. Big Data, machine learning, speech processing, generative AI, robotics, computer vision, and natural language processing are some of the key technologies driving this transformation. In industrial machines and smart machines, AI enables real-time monitoring, predictive maintenance, and process optimization. Computer vision and machine learning are used for quality control, supply chain optimization, and intelligent robotics. Autonomous vehicles and guided systems are revolutionizing transportation and logistics, while energy management and human-machine interfaces are transforming the energy sector. AI-powered virtual assistants, deep learning search algorithms, and recommendation systems are disrupting financial services, healthcare, and travel and hospitality.

Moreover, AI is essential for cybersecurity, energy management, and process optimization in various industries. With the proliferation of IoT devices, AI is becoming increasingly important for central processing units and semiconductor manufacturing. The adoption of AI solutions is expected to reduce maintenance costs, minimize safety hazards, and enhance overall operational excellence.

Artificial Intelligence Market in the Industrial Sector Size

Get a glance at the market report of share of various segments Request Free Sample

The remote monitoring and predictive maintenance segment was valued at USD 472.80 million in 2018 and showed a gradual increase during the forecast period.

Regional Analysis

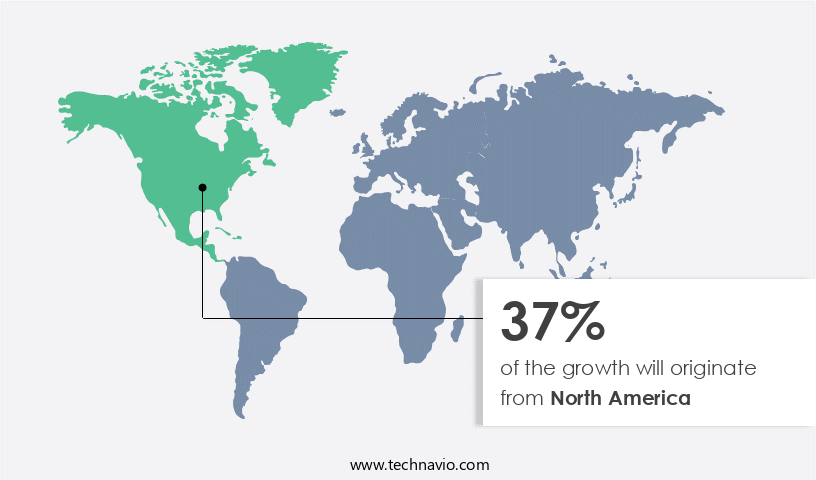
  • North America is estimated to contribute 37% to the growth of the global market during the forecast period.

Technavio's analysts have elaborately explained the regional trends and drivers that shape the market during the forecast period.

Artificial Intelligence Market in the Industrial Sector Share by Geography

For more insights on the market share of various regions, Request Free Sample

The artificial intelligence (AI) market in the industrial sector in North America is poised for significant growth, driven by advancements in technologies such as field-programmable gate arrays (FPGAs), application-specific integrated circuits (ASICs), graphics processing units (GPUs), and AI. Big data analytics, robotics, and AI-generated content are key applications. ChatGPT and AI art generators are revolutionizing content creation, while Federated Learning and explainable AI enhance decision-making.

Additionally, edge AI and mid-term roadmaps focus on federated optimization algorithms and machine learning techniques like natural language processing. Digital data from sensors, social media platforms, online transactions, and industry-wide standards fuel this exponential growth. The reshoring of manufacturing from overseas to North America and the establishment of smart factories to ensure proximity to end-users and customization are significant factors. Data cleaning, preprocessing, validation processes, and data sharing collaborations are crucial for data collection and preprocessing capabilities.

Market Dynamics

Our researchers analyzed the data with 2023 as the base year, along with the key drivers, trends, and challenges. A holistic analysis of drivers will help companies refine their marketing strategies to gain a competitive advantage.

What are the key market drivers leading to the rise in adoption of Artificial Intelligence Market in the Industrial Sector?

Digital twin technology is gaining traction in industries and is the key driver of the market.

  • Artificial Intelligence (AI) is revolutionizing the industrial sector by enhancing the capabilities of industrial machines through technologies like Big Data, machine learning, speech processing, generative AI, robotics, computer vision, and natural language processing. AI is being integrated into various industries such as technology and communication, transportation and logistics, financial services, healthcare, energy, travel and hospitality, and manufacturing. In manufacturing, AI is used for real-time monitoring, quality control, supply chain optimization, intelligent robotics, and energy management. Digital twin technology, a subset of AI, is gaining popularity by creating virtual replicas of physical assets or processes, enabling real-time data analysis and simulation capabilities.
  • Additionally, this leads to predictive behavior, improved decision-making, and performance optimization. Digital twins are utilized in industries like automotive to optimize vehicle designs before physical prototypes are built. AI algorithms, including deep learning, search algorithms, recommendation systems, and adtech networks, analyze data from digital twins to identify opportunities for product optimization, customization, and innovation. The integration of AI in industrial processes also enhances human-machine interfaces, food processing, mining, semiconductor manufacturing, and IoT devices, while addressing data proliferation and cybersecurity concerns through process optimization and central processing units.

What are the market trends shaping the Artificial Intelligence Market in the Industrial Sector?

The emergence of IIoT is the upcoming trend in the market.

  • The Industrial Artificial Intelligence (AI) market is witnessing significant growth due to the integration of Big Data, machine learning, speech processing, generative AI, robotics, computer vision, and natural language processing in various industries. Technology and communication, transportation and logistics, financial services, healthcare, energy, travel and hospitality, and manufacturing sectors are adopting AI to enhance process optimization, quality control, and supply chain management. AI technologies such as machine learning, deep learning, search algorithms, recommendation systems, and adtech networks are being utilized in real-time monitoring, intelligent robotics, autonomous vehicles, energy management, and human-machine interfaces.
  • Furthermore, the proliferation of IoT devices and data is fueling the demand for AI in industries like food processing, mining, semiconductor manufacturing, and cybersecurity. Additionally, companies are offering services, control modules, and user-friendly graphical user interfaces (GUIs) for remote control and operation flexibility. AI is revolutionizing industrial machines and processes, making them smarter and more efficient.

What challenges does Artificial Intelligence Market in the Industrial Sector face during the growth?

Lack of technical knowledge among operators is a key challenge affecting the market growth.

  • Artificial Intelligence (AI) is revolutionizing various sectors of the industrial industry, including Big Data, machine learning, speech processing, generative AI, robotics, computer vision, technology and communication, transportation and logistics, financial services, healthcare, energy, travel and hospitality, and more. AI technologies such as machine learning, deep learning, search algorithms, recommendation systems, and adtech networks are being employed for real-time monitoring, quality control, supply chain optimization, intelligent robotics, autonomous vehicles, guided systems, energy management, human-machine interfaces, food processing, mining, semiconductor manufacturing, and more.
  • However, the adoption of AI in the industrial sector faces challenges, particularly the lack of technical expertise among the workforce. Manufacturers implementing AI require a solid understanding of AI software platforms and their maintenance requirements to ensure seamless operations. This technical knowledge gap deters many end-users, particularly in developing countries, from adopting AI. To succeed in the market, companies must invest in online and offline training and consultation services to support end-users with limited technological familiarity. The proliferation of IoT devices and data, cybersecurity concerns, and process optimization are also crucial areas of focus for AI companies in the industrial sector.

Exclusive Customer Landscape

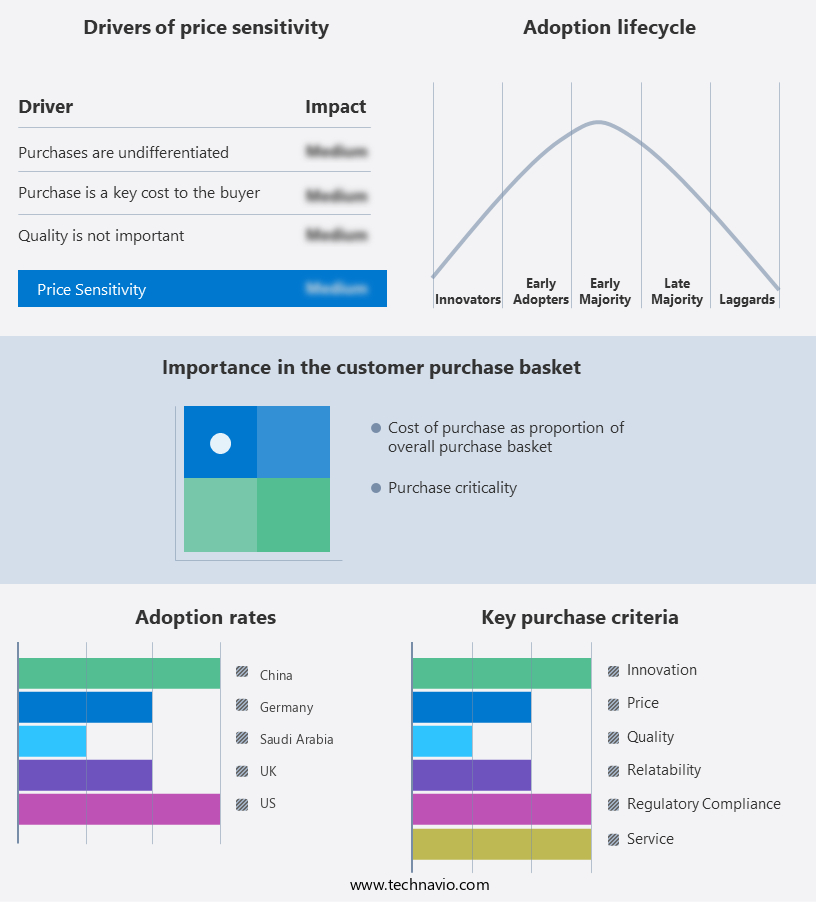
The market forecasting report includes the adoption lifecycle of the market, covering from the innovator's stage to the laggard's stage. It focuses on adoption rates in different regions based on penetration. Furthermore, the market report also includes key purchase criteria and drivers of price sensitivity to help companies evaluate and develop their market growth analysis strategies.

Artificial Intelligence Market in the Industrial Sector Share by Geography

 Customer Landscape

Key Companies & Market Insights

Companies are implementing various strategies, such as strategic alliances, market forecast, partnerships, mergers and acquisitions, geographical expansion, and product/service launches, to enhance their presence in the market. The market research and growth report includes detailed analyses of the competitive landscape of the market and information about key companies, including:

  • Alphabet Inc.
  • Amazon.com Inc.
  • Aquant
  • Automation Anywhere Inc.
  • FANUC Corp.
  • H2O.ai Inc.
  • Intel Corp.
  • International Business Machines Corp.
  • Landing AI
  • Micron Technology Inc.
  • Microsoft Corp.
  • Mitsubishi Electric Corp.
  • NVIDIA Corp.
  • Oracle Corp.
  • Rockwell Automation Inc.
  • SAP SE
  • Siemens AG
  • Sight Machine
  • Wipro Ltd.
  • General Electric Co.

Qualitative and quantitative analysis of companies has been conducted to help clients understand the wider business environment as well as the strengths and weaknesses of key market players. Data is qualitatively analyzed to categorize companies as pure play, category-focused, industry-focused, and diversified; it is quantitatively analyzed to categorize companies as dominant, leading, strong, tentative, and weak.

Research Analyst Overview

Artificial Intelligence (AI) is revolutionizing various industries by enabling advanced automation, data analysis, and decision-making capabilities. Big data, machine learning, and deep learning are the core technologies driving the AI market in sectors like transportation and logistics, financial services, healthcare, energy, travel and hospitality, and manufacturing. AI applications include machine learning algorithms for predictive maintenance in industrial machines, real-time monitoring and process optimization, and intelligent robotics for manufacturing and mining. In the industrial sector, AI technologies such as computer vision, speech processing, natural language processing, and generative AI are used for quality control, supply chain optimization, energy management, and human-machine interfaces.

In summary, AI is also transforming industries like food processing and semiconductor manufacturing through automation and process optimization. Moreover, the proliferation of IoT devices and data has led to an increased focus on cybersecurity and data privacy in the AI market. AI technologies like machine learning, search algorithms, recommendation systems, and adtech networks are being used to enhance customer experiences and improve operational efficiency. The future of AI in industry will see the integration of AI in various applications, from autonomous vehicles to intelligent energy management systems.

Artificial Intelligence Market in the Industrial Sector Scope

Report Coverage

Details

Page number

187

Base year

2023

Historic period

2018-2022

Forecast period

2024-2028

Growth momentum & CAGR

Accelerate at a CAGR of 38.86%

Market growth 2024-2028

USD 29.3 billion

Market structure

Fragmented

YoY growth 2023-2024(%)

35.89

Key countries

US, Saudi Arabia, China, Germany, and UK

Competitive landscape

Leading Companies, Market Positioning of Companies, Competitive Strategies, and Industry Risks

Request Free Sample

What are the Key Data Covered in this Market Research and Growth Report?

  • CAGR of the market during the forecast period
  • Detailed information on factors that will drive the market growth and forecasting between 2024 and 2028
  • Precise estimation of the size of the market  and its contribution of the market in focus to the parent market
  • Accurate predictions about upcoming market growth and trends and changes in consumer behaviour
  • Growth of the market across North America, APAC, Europe, Middle East and Africa, and South America
  • Thorough analysis of the market's competitive landscape and detailed information about companies
  • Comprehensive analysis of factors that will challenge the growth of market companies

We can help! Our analysts can customize this market research report to meet your requirements. Get in touch

1 Executive Summary

  • 1.1 Market overview
    • Exhibit 01: Executive Summary – Chart on Market Overview
    • Exhibit 02: Executive Summary – Data Table on Market Overview
    • Exhibit 03: Executive Summary – Chart on Global Market Characteristics
    • Exhibit 04: Executive Summary – Chart on Market by Geography
    • Exhibit 05: Executive Summary – Chart on Market Segmentation by Application
    • Exhibit 06: Executive Summary – Chart on Market Segmentation by End-user
    • Exhibit 07: Executive Summary – Chart on Incremental Growth
    • Exhibit 08: Executive Summary – Data Table on Incremental Growth
    • Exhibit 09: Executive Summary – Chart on Vendor Market Positioning

2 Market Landscape

  • 2.1 Market ecosystem
    • Exhibit 10: Parent market
    • Exhibit 11: Market Characteristics

3 Market Sizing

  • 3.1 Market definition
    • Exhibit 12: Offerings of vendors included in the market definition
  • 3.2 Market segment analysis
    • Exhibit 13: Market segments
  • 3.3 Market size 2023
    • 3.4 Market outlook: Forecast for 2023-2028
      • Exhibit 14: Chart on Global - Market size and forecast 2023-2028 ($ million)
      • Exhibit 15: Data Table on Global - Market size and forecast 2023-2028 ($ million)
      • Exhibit 16: Chart on Global Market: Year-over-year growth 2023-2028 (%)
      • Exhibit 17: Data Table on Global Market: Year-over-year growth 2023-2028 (%)

    4 Historic Market Size

    • 4.1 Global artificial intelligence market in the industrial sector 2018 - 2022
      • Exhibit 18: Historic Market Size – Data Table on global artificial intelligence market in the industrial sector 2018 - 2022 ($ million)
    • 4.2 Application Segment Analysis 2018 - 2022
      • Exhibit 19: Historic Market Size – Application Segment 2018 - 2022 ($ million)
    • 4.3 End-user Segment Analysis 2018 - 2022
      • Exhibit 20: Historic Market Size – End-user Segment 2018 - 2022 ($ million)
    • 4.4 Geography Segment Analysis 2018 - 2022
      • Exhibit 21: Historic Market Size – Geography Segment 2018 - 2022 ($ million)
    • 4.5 Country Segment Analysis 2018 - 2022
      • Exhibit 22: Historic Market Size – Country Segment 2018 - 2022 ($ million)

    5 Five Forces Analysis

    • 5.1 Five forces summary
      • Exhibit 23: Five forces analysis - Comparison between 2023 and 2028
    • 5.2 Bargaining power of buyers
      • Exhibit 24: Chart on Bargaining power of buyers – Impact of key factors 2023 and 2028
    • 5.3 Bargaining power of suppliers
      • Exhibit 25: Bargaining power of suppliers – Impact of key factors in 2023 and 2028
    • 5.4 Threat of new entrants
      • Exhibit 26: Threat of new entrants – Impact of key factors in 2023 and 2028
    • 5.5 Threat of substitutes
      • Exhibit 27: Threat of substitutes – Impact of key factors in 2023 and 2028
    • 5.6 Threat of rivalry
      • Exhibit 28: Threat of rivalry – Impact of key factors in 2023 and 2028
    • 5.7 Market condition
      • Exhibit 29: Chart on Market condition - Five forces 2023 and 2028

    6 Market Segmentation by Application

    • 6.1 Market segments
      • Exhibit 30: Chart on Application - Market share 2023-2028 (%)
      • Exhibit 31: Data Table on Application - Market share 2023-2028 (%)
    • 6.2 Comparison by Application
      • Exhibit 32: Chart on Comparison by Application
      • Exhibit 33: Data Table on Comparison by Application
    • 6.3 Remote monitoring and predictive maintenance - Market size and forecast 2023-2028
      • Exhibit 34: Chart on Remote monitoring and predictive maintenance - Market size and forecast 2023-2028 ($ million)
      • Exhibit 35: Data Table on Remote monitoring and predictive maintenance - Market size and forecast 2023-2028 ($ million)
      • Exhibit 36: Chart on Remote monitoring and predictive maintenance - Year-over-year growth 2023-2028 (%)
      • Exhibit 37: Data Table on Remote monitoring and predictive maintenance - Year-over-year growth 2023-2028 (%)
    • 6.4 Supply chain management - Market size and forecast 2023-2028
      • Exhibit 38: Chart on Supply chain management - Market size and forecast 2023-2028 ($ million)
      • Exhibit 39: Data Table on Supply chain management - Market size and forecast 2023-2028 ($ million)
      • Exhibit 40: Chart on Supply chain management - Year-over-year growth 2023-2028 (%)
      • Exhibit 41: Data Table on Supply chain management - Year-over-year growth 2023-2028 (%)
    • 6.5 Production planning - Market size and forecast 2023-2028
      • Exhibit 42: Chart on Production planning - Market size and forecast 2023-2028 ($ million)
      • Exhibit 43: Data Table on Production planning - Market size and forecast 2023-2028 ($ million)
      • Exhibit 44: Chart on Production planning - Year-over-year growth 2023-2028 (%)
      • Exhibit 45: Data Table on Production planning - Year-over-year growth 2023-2028 (%)
    • 6.6 Quality control - Market size and forecast 2023-2028
      • Exhibit 46: Chart on Quality control - Market size and forecast 2023-2028 ($ million)
      • Exhibit 47: Data Table on Quality control - Market size and forecast 2023-2028 ($ million)
      • Exhibit 48: Chart on Quality control - Year-over-year growth 2023-2028 (%)
      • Exhibit 49: Data Table on Quality control - Year-over-year growth 2023-2028 (%)
    • 6.7 Others - Market size and forecast 2023-2028
      • Exhibit 50: Chart on Others - Market size and forecast 2023-2028 ($ million)
      • Exhibit 51: Data Table on Others - Market size and forecast 2023-2028 ($ million)
      • Exhibit 52: Chart on Others - Year-over-year growth 2023-2028 (%)
      • Exhibit 53: Data Table on Others - Year-over-year growth 2023-2028 (%)
    • 6.8 Market opportunity by Application
      • Exhibit 54: Market opportunity by Application ($ million)
      • Exhibit 55: Data Table on Market opportunity by Application ($ million)

    7 Market Segmentation by End-user

    • 7.1 Market segments
      • Exhibit 56: Chart on End-user - Market share 2023-2028 (%)
      • Exhibit 57: Data Table on End-user - Market share 2023-2028 (%)
    • 7.2 Comparison by End-user
      • Exhibit 58: Chart on Comparison by End-user
      • Exhibit 59: Data Table on Comparison by End-user
    • 7.3 Process industries - Market size and forecast 2023-2028
      • Exhibit 60: Chart on Process industries - Market size and forecast 2023-2028 ($ million)
      • Exhibit 61: Data Table on Process industries - Market size and forecast 2023-2028 ($ million)
      • Exhibit 62: Chart on Process industries - Year-over-year growth 2023-2028 (%)
      • Exhibit 63: Data Table on Process industries - Year-over-year growth 2023-2028 (%)
    • 7.4 Discrete industries - Market size and forecast 2023-2028
      • Exhibit 64: Chart on Discrete industries - Market size and forecast 2023-2028 ($ million)
      • Exhibit 65: Data Table on Discrete industries - Market size and forecast 2023-2028 ($ million)
      • Exhibit 66: Chart on Discrete industries - Year-over-year growth 2023-2028 (%)
      • Exhibit 67: Data Table on Discrete industries - Year-over-year growth 2023-2028 (%)
    • 7.5 Market opportunity by End-user
      • Exhibit 68: Market opportunity by End-user ($ million)
      • Exhibit 69: Data Table on Market opportunity by End-user ($ million)

    8 Customer Landscape

    • 8.1 Customer landscape overview
      • Exhibit 70: Analysis of price sensitivity, lifecycle, customer purchase basket, adoption rates, and purchase criteria

    9 Geographic Landscape

    • 9.1 Geographic segmentation
      • Exhibit 71: Chart on Market share by geography 2023-2028 (%)
      • Exhibit 72: Data Table on Market share by geography 2023-2028 (%)
    • 9.2 Geographic comparison
      • Exhibit 73: Chart on Geographic comparison
      • Exhibit 74: Data Table on Geographic comparison
    • 9.3 North America - Market size and forecast 2023-2028
      • Exhibit 75: Chart on North America - Market size and forecast 2023-2028 ($ million)
      • Exhibit 76: Data Table on North America - Market size and forecast 2023-2028 ($ million)
      • Exhibit 77: Chart on North America - Year-over-year growth 2023-2028 (%)
      • Exhibit 78: Data Table on North America - Year-over-year growth 2023-2028 (%)
    • 9.4 APAC - Market size and forecast 2023-2028
      • Exhibit 79: Chart on APAC - Market size and forecast 2023-2028 ($ million)
      • Exhibit 80: Data Table on APAC - Market size and forecast 2023-2028 ($ million)
      • Exhibit 81: Chart on APAC - Year-over-year growth 2023-2028 (%)
      • Exhibit 82: Data Table on APAC - Year-over-year growth 2023-2028 (%)
    • 9.5 Europe - Market size and forecast 2023-2028
      • Exhibit 83: Chart on Europe - Market size and forecast 2023-2028 ($ million)
      • Exhibit 84: Data Table on Europe - Market size and forecast 2023-2028 ($ million)
      • Exhibit 85: Chart on Europe - Year-over-year growth 2023-2028 (%)
      • Exhibit 86: Data Table on Europe - Year-over-year growth 2023-2028 (%)
    • 9.6 Middle East and Africa - Market size and forecast 2023-2028
      • Exhibit 87: Chart on Middle East and Africa - Market size and forecast 2023-2028 ($ million)
      • Exhibit 88: Data Table on Middle East and Africa - Market size and forecast 2023-2028 ($ million)
      • Exhibit 89: Chart on Middle East and Africa - Year-over-year growth 2023-2028 (%)
      • Exhibit 90: Data Table on Middle East and Africa - Year-over-year growth 2023-2028 (%)
    • 9.7 South America - Market size and forecast 2023-2028
      • Exhibit 91: Chart on South America - Market size and forecast 2023-2028 ($ million)
      • Exhibit 92: Data Table on South America - Market size and forecast 2023-2028 ($ million)
      • Exhibit 93: Chart on South America - Year-over-year growth 2023-2028 (%)
      • Exhibit 94: Data Table on South America - Year-over-year growth 2023-2028 (%)
    • 9.8 US - Market size and forecast 2023-2028
      • Exhibit 95: Chart on US - Market size and forecast 2023-2028 ($ million)
      • Exhibit 96: Data Table on US - Market size and forecast 2023-2028 ($ million)
      • Exhibit 97: Chart on US - Year-over-year growth 2023-2028 (%)
      • Exhibit 98: Data Table on US - Year-over-year growth 2023-2028 (%)
    • 9.9 China - Market size and forecast 2023-2028
      • Exhibit 99: Chart on China - Market size and forecast 2023-2028 ($ million)
      • Exhibit 100: Data Table on China - Market size and forecast 2023-2028 ($ million)
      • Exhibit 101: Chart on China - Year-over-year growth 2023-2028 (%)
      • Exhibit 102: Data Table on China - Year-over-year growth 2023-2028 (%)
    • 9.10 Germany - Market size and forecast 2023-2028
      • Exhibit 103: Chart on Germany - Market size and forecast 2023-2028 ($ million)
      • Exhibit 104: Data Table on Germany - Market size and forecast 2023-2028 ($ million)
      • Exhibit 105: Chart on Germany - Year-over-year growth 2023-2028 (%)
      • Exhibit 106: Data Table on Germany - Year-over-year growth 2023-2028 (%)
    • 9.11 UK - Market size and forecast 2023-2028
      • Exhibit 107: Chart on UK - Market size and forecast 2023-2028 ($ million)
      • Exhibit 108: Data Table on UK - Market size and forecast 2023-2028 ($ million)
      • Exhibit 109: Chart on UK - Year-over-year growth 2023-2028 (%)
      • Exhibit 110: Data Table on UK - Year-over-year growth 2023-2028 (%)
    • 9.12 Saudi Arabia - Market size and forecast 2023-2028
      • Exhibit 111: Chart on Saudi Arabia - Market size and forecast 2023-2028 ($ million)
      • Exhibit 112: Data Table on Saudi Arabia - Market size and forecast 2023-2028 ($ million)
      • Exhibit 113: Chart on Saudi Arabia - Year-over-year growth 2023-2028 (%)
      • Exhibit 114: Data Table on Saudi Arabia - Year-over-year growth 2023-2028 (%)
    • 9.13 Market opportunity by geography
      • Exhibit 115: Market opportunity by geography ($ million)
      • Exhibit 116: Data Tables on Market opportunity by geography ($ million)

    10 Drivers, Challenges, and Trends

    • 10.1 Market drivers
      • 10.2 Market challenges
        • 10.3 Impact of drivers and challenges
          • Exhibit 117: Impact of drivers and challenges in 2023 and 2028
        • 10.4 Market trends

          11 Vendor Landscape

          • 11.1 Overview
            • 11.2 Vendor landscape
              • Exhibit 118: Overview on Criticality of inputs and Factors of differentiation
            • 11.3 Landscape disruption
              • Exhibit 119: Overview on factors of disruption
            • 11.4 Industry risks
              • Exhibit 120: Impact of key risks on business

            12 Vendor Analysis

            • 12.1 Vendors covered
              • Exhibit 121: Vendors covered
            • 12.2 Market positioning of vendors
              • Exhibit 122: Matrix on vendor position and classification
            • 12.3 Alphabet Inc.
              • Exhibit 123: Alphabet Inc. - Overview
              • Exhibit 124: Alphabet Inc. - Business segments
              • Exhibit 125: Alphabet Inc. - Key news
              • Exhibit 126: Alphabet Inc. - Key offerings
              • Exhibit 127: Alphabet Inc. - Segment focus
            • 12.4 Amazon.com Inc.
              • Exhibit 128: Amazon.com Inc. - Overview
              • Exhibit 129: Amazon.com Inc. - Business segments
              • Exhibit 130: Amazon.com Inc. - Key offerings
              • Exhibit 131: Amazon.com Inc. - Segment focus
            • 12.5 General Electric Co.
              • Exhibit 132: General Electric Co. - Overview
              • Exhibit 133: General Electric Co. - Business segments
              • Exhibit 134: General Electric Co. - Key news
              • Exhibit 135: General Electric Co. - Key offerings
              • Exhibit 136: General Electric Co. - Segment focus
            • 12.6 H2O.ai Inc.
              • Exhibit 137: H2O.ai Inc. - Overview
              • Exhibit 138: H2O.ai Inc. - Product / Service
              • Exhibit 139: H2O.ai Inc. - Key offerings
            • 12.7 Intel Corp.
              • Exhibit 140: Intel Corp. - Overview
              • Exhibit 141: Intel Corp. - Business segments
              • Exhibit 142: Intel Corp. - Key news
              • Exhibit 143: Intel Corp. - Key offerings
              • Exhibit 144: Intel Corp. - Segment focus
            • 12.8 International Business Machines Corp.
              • Exhibit 145: International Business Machines Corp. - Overview
              • Exhibit 146: International Business Machines Corp. - Business segments
              • Exhibit 147: International Business Machines Corp. - Key news
              • Exhibit 148: International Business Machines Corp. - Key offerings
              • Exhibit 149: International Business Machines Corp. - Segment focus
            • 12.9 Landing AI
              • Exhibit 150: Landing AI - Overview
              • Exhibit 151: Landing AI - Product / Service
              • Exhibit 152: Landing AI - Key offerings
            • 12.10 Microsoft Corp.
              • Exhibit 153: Microsoft Corp. - Overview
              • Exhibit 154: Microsoft Corp. - Business segments
              • Exhibit 155: Microsoft Corp. - Key news
              • Exhibit 156: Microsoft Corp. - Key offerings
              • Exhibit 157: Microsoft Corp. - Segment focus
            • 12.11 Mitsubishi Electric Corp.
              • Exhibit 158: Mitsubishi Electric Corp. - Overview
              • Exhibit 159: Mitsubishi Electric Corp. - Business segments
              • Exhibit 160: Mitsubishi Electric Corp. - Key news
              • Exhibit 161: Mitsubishi Electric Corp. - Key offerings
              • Exhibit 162: Mitsubishi Electric Corp. - Segment focus
            • 12.12 NVIDIA Corp.
              • Exhibit 163: NVIDIA Corp. - Overview
              • Exhibit 164: NVIDIA Corp. - Business segments
              • Exhibit 165: NVIDIA Corp. - Key news
              • Exhibit 166: NVIDIA Corp. - Key offerings
              • Exhibit 167: NVIDIA Corp. - Segment focus
            • 12.13 Oracle Corp.
              • Exhibit 168: Oracle Corp. - Overview
              • Exhibit 169: Oracle Corp. - Business segments
              • Exhibit 170: Oracle Corp. - Key news
              • Exhibit 171: Oracle Corp. - Key offerings
              • Exhibit 172: Oracle Corp. - Segment focus
            • 12.14 Rockwell Automation Inc.
              • Exhibit 173: Rockwell Automation Inc. - Overview
              • Exhibit 174: Rockwell Automation Inc. - Business segments
              • Exhibit 175: Rockwell Automation Inc. - Key news
              • Exhibit 176: Rockwell Automation Inc. - Key offerings
              • Exhibit 177: Rockwell Automation Inc. - Segment focus
            • 12.15 SAP SE
              • Exhibit 178: SAP SE - Overview
              • Exhibit 179: SAP SE - Business segments
              • Exhibit 180: SAP SE - Key news
              • Exhibit 181: SAP SE - Key offerings
              • Exhibit 182: SAP SE - Segment focus
            • 12.16 Siemens AG
              • Exhibit 183: Siemens AG - Overview
              • Exhibit 184: Siemens AG - Business segments
              • Exhibit 185: Siemens AG - Key news
              • Exhibit 186: Siemens AG - Key offerings
              • Exhibit 187: Siemens AG - Segment focus
            • 12.17 Wipro Ltd.
              • Exhibit 188: Wipro Ltd. - Overview
              • Exhibit 189: Wipro Ltd. - Business segments
              • Exhibit 190: Wipro Ltd. - Key news
              • Exhibit 191: Wipro Ltd. - Key offerings
              • Exhibit 192: Wipro Ltd. - Segment focus

            13 Appendix

            • 13.1 Scope of the report
              • 13.2 Inclusions and exclusions checklist
                • Exhibit 193: Inclusions checklist
                • Exhibit 194: Exclusions checklist
              • 13.3 Currency conversion rates for US$
                • Exhibit 195: Currency conversion rates for US$
              • 13.4 Research methodology
                • Exhibit 196: Research methodology
                • Exhibit 197: Validation techniques employed for market sizing
                • Exhibit 198: Information sources
              • 13.5 List of abbreviations
                • Exhibit 199: List of abbreviations

              Research Methodology

              Technavio presents a detailed picture of the market by way of study, synthesis, and summation of data from multiple sources. The analysts have presented the various facets of the market with a particular focus on identifying the key industry influencers. The data thus presented is comprehensive, reliable, and the result of extensive research, both primary and secondary.

              INFORMATION SOURCES

              Primary sources

              • Manufacturers and suppliers
              • Channel partners
              • Industry experts
              • Strategic decision makers

              Secondary sources

              • Industry journals and periodicals
              • Government data
              • Financial reports of key industry players
              • Historical data
              • Press releases

              DATA ANALYSIS

              Data Synthesis

              • Collation of data
              • Estimation of key figures
              • Analysis of derived insights

              Data Validation

              • Triangulation with data models
              • Reference against proprietary databases
              • Corroboration with industry experts

              REPORT WRITING

              Qualitative

              • Market drivers
              • Market challenges
              • Market trends
              • Five forces analysis

              Quantitative

              • Market size and forecast
              • Market segmentation
              • Geographical insights
              • Competitive landscape

              Interested in this report?

              Get your sample now to see our research methodology and insights!

              Download Now

              Frequently Asked Questions

              Artificial Intelligencein the Industrial Sector market growth will increase by $ 29297.64 mn during 2024-2028.

              The Artificial Intelligencein the Industrial Sector market is expected to grow at a CAGR of 38.86% during 2024-2028.

              Artificial Intelligencein the Industrial Sector market is segmented by Application( Remote monitoring and predictive maintenance, Supply chain management, Production planning, Quality control, Others) End-user( Process industries, Discrete industries, APAC, MEA, South America)

              Alphabet Inc., Amazon.com Inc., Aquant, Automation Anywhere Inc., FANUC Corp., H2O.ai Inc., Intel Corp., International Business Machines Corp., Landing AI, Micron Technology Inc., Microsoft Corp., Mitsubishi Electric Corp., NVIDIA Corp., Oracle Corp., Rockwell Automation Inc., SAP SE, Siemens AG, Sight Machine, Wipro Ltd., General Electric Co. are a few of the key vendors in the Artificial Intelligencein the Industrial Sector market.

              North America will register the highest growth rate of 37% among the other regions. Therefore, the Artificial Intelligencein the Industrial Sector market in North America is expected to garner significant business opportunities for the vendors during the forecast period.

              US, Saudi Arabia, China, Germany, UK

              • Digital twin technology gaining traction in industriesDigital twin technology is the driving factor this market.
              • which creates virtual replicas of physical assets or processes is the driving factor this market.
              • is gaining traction in the industrial sector. AI-powered digital twins leverage real-time data and simulation capabilities to model and optimize industrial systems is the driving factor this market.
              • predict behavior is the driving factor this market.
              • and enable better decision-making and performance optimization. Digital twins facilitate product development and innovation by providing insights into product performance is the driving factor this market.
              • behavior is the driving factor this market.
              • and usage. AI algorithms analyze data from digital twins to identify opportunities for product optimization is the driving factor this market.
              • customization is the driving factor this market.
              • and innovation. By simulating product designs and testing different configurations virtually is the driving factor this market.
              • companies can accelerate the development process is the driving factor this market.
              • reduce costs is the driving factor this market.
              • and bring new products to market faster. In the automotive industry is the driving factor this market.
              • digital twins are employed to simulate and optimize vehicle designs before physical prototypes are built. Automotive OEMs create digital twins of vehicle models is the driving factor this market.
              • components is the driving factor this market.
              • and systems to assess their performance is the driving factor this market.
              • functionality is the driving factor this market.
              • and manufacturing feasibility. By simulating different design configurations and conducting virtual tests is the driving factor this market.
              • automotive OEMs can accelerate the product development process is the driving factor this market.
              • reduce costs is the driving factor this market.
              • and improve vehicle quality. Digital twins are used to monitor and predict the health and performance of equipment in food and beverage manufacturing plants. In the oil and gas industry is the driving factor this market.
              • digital twins are used to optimize drilling operations and manage oil and gas wells more effectively. Operators create digital twins of drilling rigs is the driving factor this market.
              • wellbores is the driving factor this market.
              • and reservoirs to simulate drilling scenarios is the driving factor this market.
              • analyze geological data is the driving factor this market.
              • and optimize drilling parameters. By conducting virtual tests and simulations is the driving factor this market.
              • oil and gas operators can improve drilling efficiency is the driving factor this market.
              • reduce costs is the driving factor this market.
              • and enhance safety in oil and gas exploration and production (E and P) activities. As companies in different industry verticals like automotive is the driving factor this market.
              • food and beverage is the driving factor this market.
              • and oil and gas increasingly adopt digital twins is the driving factor this market.
              • they can achieve operational excellence is the driving factor this market.
              • improve competitiveness is the driving factor this market.
              • and deliver value to customers and stakeholders is the driving factor this market.
              • which will fuel the growth of the global artificial intelligence market in the industrial sector during the forecast period. is the driving factor this market.

              The Artificial Intelligencein the Industrial Sector market vendors should focus on grabbing business opportunities from the Remote monitoring and predictive maintenance segment as it accounted for the largest market share in the base year.