Amphoteric Surfactant Market Analysis, Size, and Forecast 2026-2030: APAC (China, Japan, and India), Europe (Germany, UK, and France), North America (US, Canada, and Mexico), South America (Brazil, Argentina, and Colombia), Middle East and Africa (Saudi Arabia, UAE, and South Africa), and Rest of World (ROW)

Amphoteric Surfactant Market Analysis, Size, and Forecast 2026-2030:
APAC (China, Japan, and India), Europe (Germany, UK, and France), North America (US, Canada, and Mexico), South America (Brazil, Argentina, and Colombia), Middle East and Africa (Saudi Arabia, UAE, and South Africa), and Rest of World (ROW)

Published: Jan 2026 308 Pages SKU: IRTNTR74054

Market Overview at a Glance

$1.93 B
Market Opportunity
7.1%
CAGR 2025 - 2030
43%
APAC Growth
$1.70 B
Personal care segment 2024

Amphoteric Surfactant Market Size 2026-2030

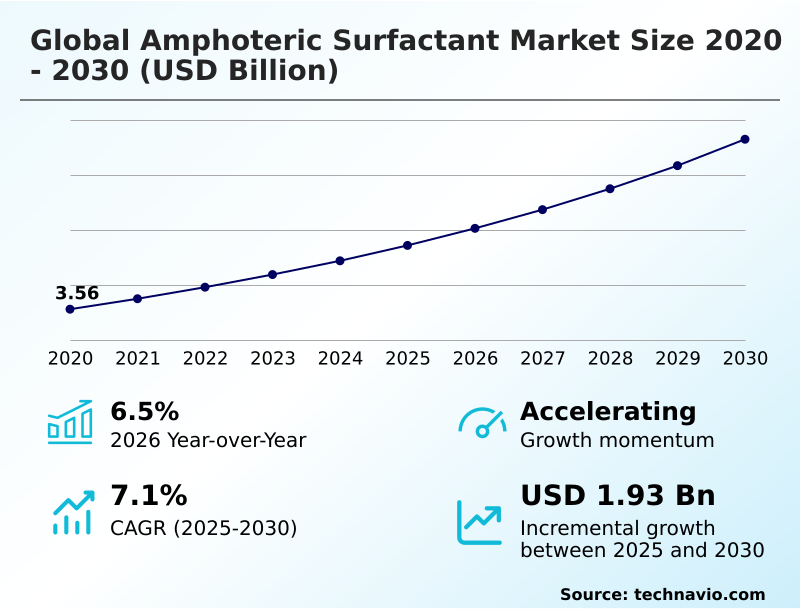
The amphoteric surfactant market size is valued to increase by USD 1.93 billion, at a CAGR of 7.1% from 2025 to 2030. Escalating demand for mild and sulfate-free personal care formulations will drive the amphoteric surfactant market.

Major Market Trends & Insights

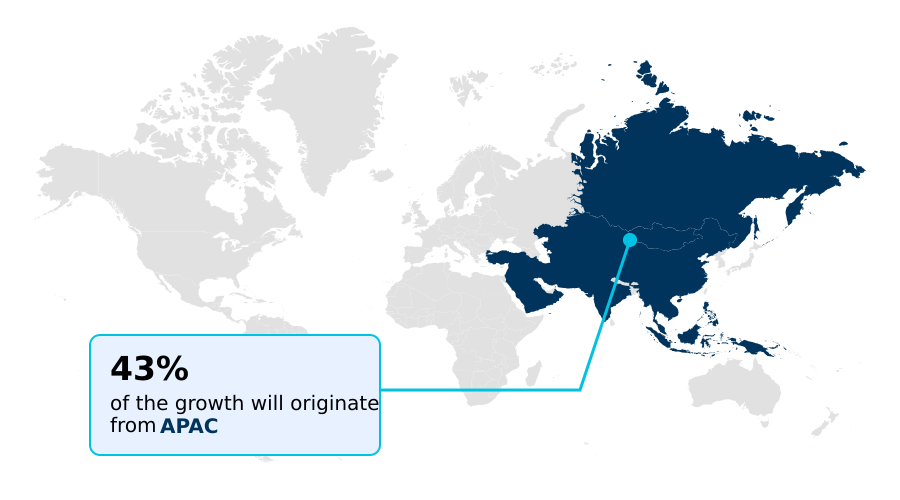
  • APAC dominated the market and accounted for a 43% growth during the forecast period.
  • By Application - Personal care segment was valued at USD 1.70 billion in 2024
  • By Type - Betaines segment accounted for the largest market revenue share in 2024

Market Size & Forecast

  • Market Opportunities: USD 3.09 billion
  • Market Future Opportunities: USD 1.93 billion
  • CAGR from 2025 to 2030 : 7.1%

Market Summary

  • The amphoteric surfactant market is defined by its versatile zwitterionic surfactant chemistry, which is crucial for creating high-performance, non-irritating formulations. Growth is driven by the escalating demand for sulfate-free cleansing systems in personal care and the need for stable, multifunctional agents in industrial applications.
  • A significant trend involves the strategic shift from petrochemical derivatives to sustainable oleochemical feedstocks to improve the environmental footprint of products. However, this pivot introduces challenges related to raw material price volatility and supply chain complexities.
  • For instance, a formulator of industrial cleaners must balance the cost-performance ratio of bio-based ingredients against conventional options, a decision that directly impacts production budgets and market positioning. This dynamic requires manufacturers to innovate continuously, developing high-purity amphoterics and leveraging green chemistry principles to meet both regulatory mandates and evolving consumer expectations for safety and sustainability.

What will be the Size of the Amphoteric Surfactant Market during the forecast period?

Get Key Insights on Market Forecast (PDF) Request Free Sample

How is the Amphoteric Surfactant Market Segmented?

The amphoteric surfactant industry research report provides comprehensive data (region-wise segment analysis), with forecasts and estimates in "USD million" for the period 2026-2030, as well as historical data from 2020-2024 for the following segments.
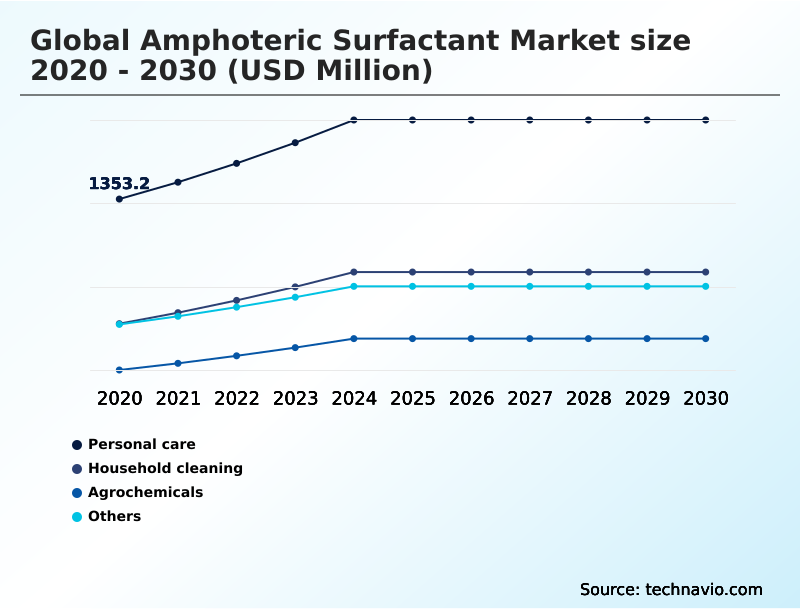
  • Application
    • Personal care
    • Household cleaning
    • Agrochemicals
    • Others
  • Type
    • Betaines
    • Aminoxides
    • Others
  • End-user
    • Cosmetics
    • Food and beverage
    • Others
  • Geography
    • APAC
      • China
      • Japan
      • India
    • Europe
      • Germany
      • UK
      • France
    • North America
      • US
      • Canada
      • Mexico
    • South America
      • Brazil
      • Argentina
      • Colombia
    • Middle East and Africa
      • Saudi Arabia
      • UAE
      • South Africa
    • Rest of World (ROW)

By Application Insights

The personal care segment is estimated to witness significant growth during the forecast period.

The personal care segment is a dominant force, driven by the clean beauty movement and demand for skin-friendly cleansers. Formulators prioritize zwitterionic surfactant chemistry for mild surfactant systems in premium hair care ingredients and sensitive skin products.

The use of oleochemical feedstocks is central to creating high-purity amphoterics. Innovations in cocamidopropyl betaine synthesis and the development of sultaine derivatives and amine oxide surfactants are enabling low-salt surfactant systems suitable for baby care formulations.

This focus on gentle yet effective ingredients is critical, as the segment accounts for a substantial portion of market innovation, with development cycles often being 25% faster than in industrial segments to meet rapidly changing consumer preferences.

Request Free Sample

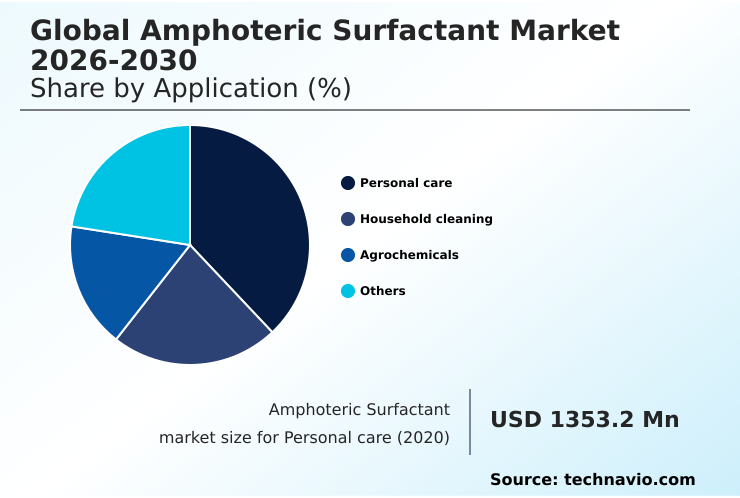
The Personal care segment was valued at USD 1.70 billion in 2024 and showed a gradual increase during the forecast period.

Request Free Sample

Regional Analysis

APAC is estimated to contribute 43% to the growth of the global market during the forecast period.Technavio’s analysts have elaborately explained the regional trends and drivers that shape the market during the forecast period.

See How Amphoteric Surfactant Market Demand is Rising in APAC Request Free Sample

The geographic landscape is characterized by diverse regional demands and production capabilities. APAC is the primary growth engine, projected to contribute 43% of the market's incremental growth, with a regional CAGR of 7.5%, outpacing North America's 6.6%.

This expansion is driven by rising demand for high-value cosmetic grades and institutional cleaning solutions.

European markets are heavily influenced by stringent regulations like EU Ecolabel compliance, which require detailed REACH registration data and aquatic toxicity assessment, promoting the use of concentrated detergent systems and high-active formulations.

North America focuses on dermo-cosmetic compatibility and anti-static finishing agents. In this environment, manufacturers are adopting mass balance certification to verify their renewable carbon index, while navigating commodity chemical pricing for feedstocks to remain competitive in developing rinse-free cleansing agents.

Market Dynamics

Our researchers analyzed the data with 2025 as the base year, along with the key drivers, trends, and challenges. A holistic analysis of drivers will help companies refine their marketing strategies to gain a competitive advantage.

  • Formulators are continually seeking the best amphoteric surfactant for sulfate-free shampoo, often comparing cocamidopropyl betaine vs cocamidopropyl hydroxysultaine for performance benefits. The demand for mild amphoteric surfactants for baby wash is particularly strong, driving innovation in high-foaming amphoteric surfactants for cleansers that remain gentle. Beyond personal care, amphoteric surfactant use in agricultural adjuvants is expanding to improve crop protection efficacy.
  • Similarly, their unique properties are leveraged in amphoteric surfactants for high-salinity oilfields. The push for sustainability has increased the search for biodegradable amphoteric surfactants for green cleaners and natural alternatives to cocamidopropyl betaine. Understanding amphoteric surfactant compatibility with anionic surfactants is crucial for reducing irritation potential with amphoteric surfactants. This synergy also aids in viscosity building with low-salt amphoteric surfactants.
  • In industrial applications, amine oxide surfactants in bleach-based cleaners provide stability, while amphoteric hydrotropes in concentrated detergents enable high-active formulations. The role of amphoteric surfactants in micellar water highlights their mild cleansing power.
  • The industrial sector uses them for specialized tasks such as amphoteric surfactants for industrial metal cleaning, leveraging their temperature stability of amphoteric drilling fluids, and in amphoteric surfactants in textile scouring processes.
  • The cost analysis of oleochemical vs petrochemical surfactants remains a key consideration, with companies managing regulatory challenges for amphoteric surfactant impurities to ensure market access for products like food-contact safe amphoteric emulsifiers, which show 15% better stability in certain systems.

What are the key market drivers leading to the rise in the adoption of Amphoteric Surfactant Industry?

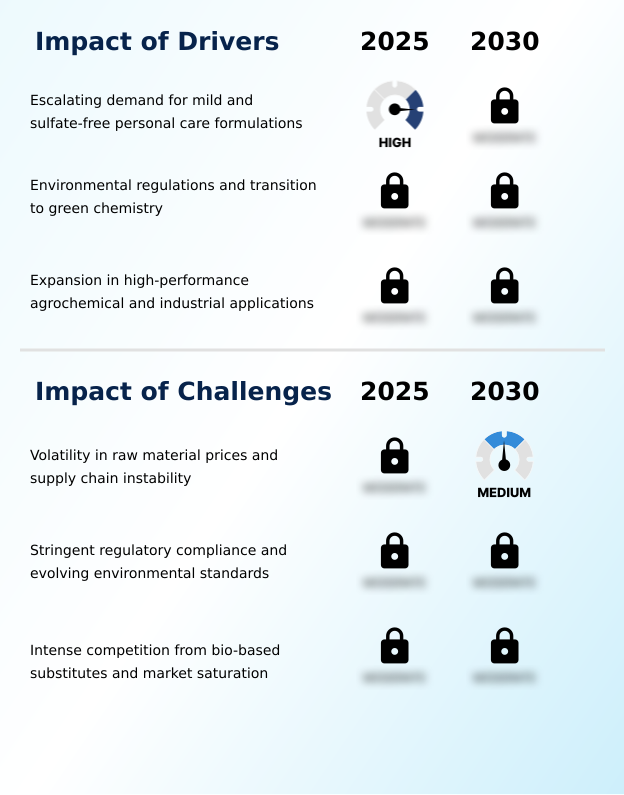
  • Escalating demand for mild and sulfate-free personal care formulations is a key driver propelling growth in the amphoteric surfactant market.

  • The primary driver remains the escalating demand for sulfate-free cleansing systems, where the pH-dependent charge behavior of amphoterics is essential.
  • Consumer advocacy for safety has cemented their role in personal care, while their superior hard water tolerance and hydrotropic properties expand their use in industrial cleaning surfactants.
  • Formulators rely on advanced formulation science to achieve the right cost-performance ratio, with specialized technical support services becoming a key competitive differentiator.
  • For example, firms offering application-specific innovation for agrochemical adjuvants or corrosion inhibitor chemistry can command a 10% price premium.
  • This expansion into high-performance industrial verticals helps diversify revenue and reduces the industry's reliance on the personal care sector, contributing to a more balanced and resilient market structure focused on environmental footprint reduction.

What are the market trends shaping the Amphoteric Surfactant Industry?

  • The market is experiencing a significant trend toward the acceleration of bio-based feedstocks. This shift is coupled with a growing emphasis on certified sustainability to meet evolving regulatory and consumer demands.

  • A significant market trend is the acceleration of sustainable ingredient sourcing, driven by consumer demand for non-irritating formulations and products with a favorable biodegradable surfactant profile. This shift is compelling manufacturers to move away from petrochemical derivatives, despite challenges like vegetable oil price volatility, and toward green alternatives.
  • The secondary surfactant function of amphoterics is crucial in creating advanced dermo-cosmetic ingredients. Innovations in cold-processable surfactants are improving manufacturing efficiency by over 10%. As regulatory compliance costs rise, the adoption of a digital product passport is becoming essential for supply chain resilience.
  • This focus on sustainability is reshaping formulation science, with foam boosting agents and viscosity modification now expected to come from eco-friendly sources, leading to a 15% increase in the launch of certified bio-based products.

What challenges does the Amphoteric Surfactant Industry face during its growth?

  • Volatility in raw material prices and ongoing supply chain instability present a key challenge to the amphoteric surfactant industry's growth trajectory.

  • The market faces intense competition from next-generation rhamnolipid biosurfactants and sophorolipid alternatives produced via microbial fermentation surfactants. This is a core challenge for specialty chemical manufacturing, as these alternatives align with green chemistry principles and appeal to consumers seeking fully bio-based ingredients. Asset optimization strategy and nearshoring production trends are being explored to counter high manufacturing costs.
  • The upstream chemical ecosystem is under pressure to deliver cost-competitive feedstocks for traditional amphoterics, such as oilfield demulsifiers and textile processing auxiliaries. Companies must create value-added formulations and innovate beyond standard food-grade emulsifiers to compete.
  • The shift toward biosurfactants has already captured approximately 5% of the niche mild surfactant market, forcing traditional producers to pivot their strategies for downstream specialty chemicals.

Exclusive Technavio Analysis on Customer Landscape

The amphoteric surfactant market forecasting report includes the adoption lifecycle of the market, covering from the innovator’s stage to the laggard’s stage. It focuses on adoption rates in different regions based on penetration. Furthermore, the amphoteric surfactant market report also includes key purchase criteria and drivers of price sensitivity to help companies evaluate and develop their market growth analysis strategies.

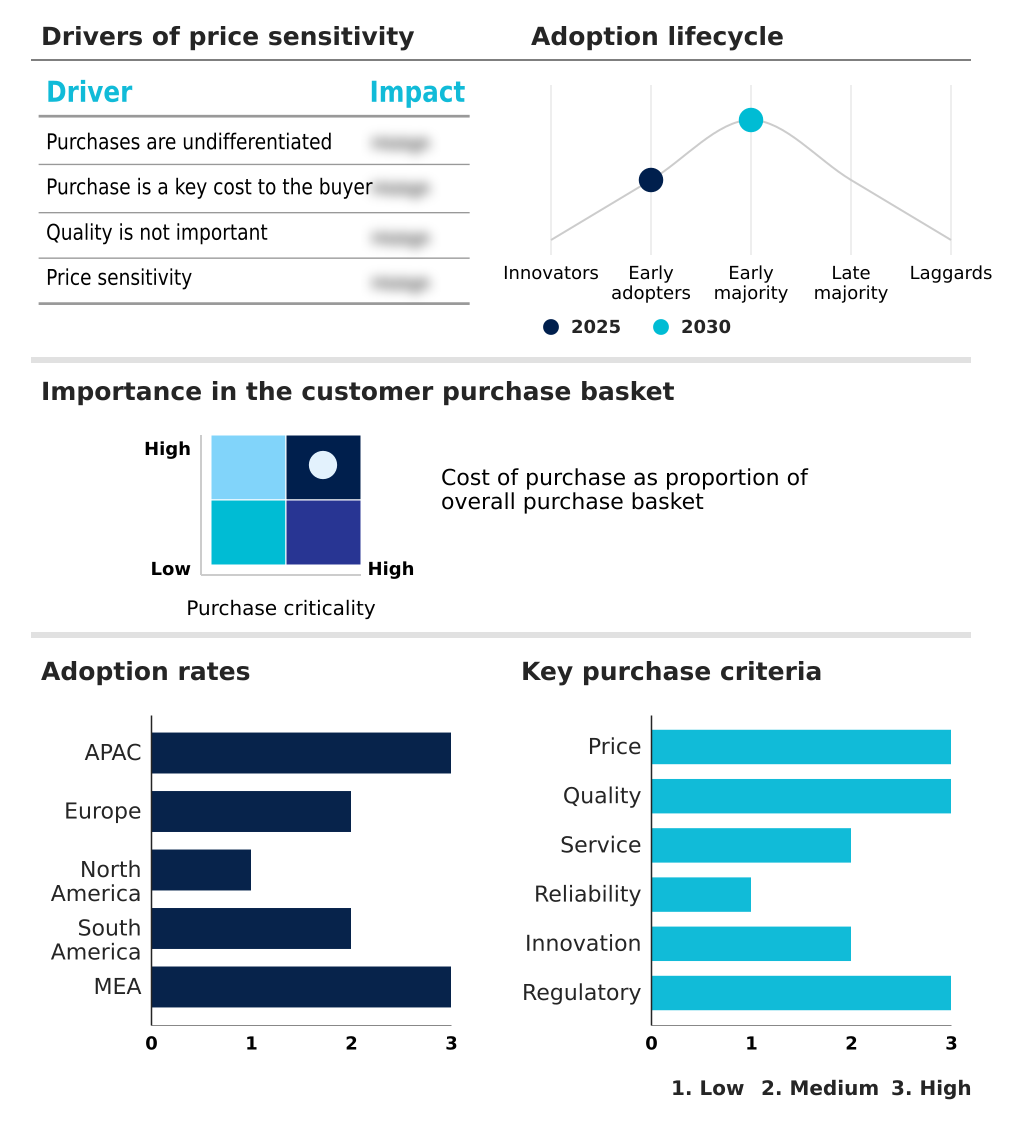
Customer Landscape of Amphoteric Surfactant Industry

Competitive Landscape

Companies are implementing various strategies, such as strategic alliances, amphoteric surfactant market forecast, partnerships, mergers and acquisitions, geographical expansion, and product/service launches, to enhance their presence in the industry.

Alfa Chemistry - Delivering advanced formulation science through a portfolio of high-purity amphoterics and specialty chemical manufacturing, designed to enhance performance in dermo-cosmetic ingredients and value-added formulations.

The industry research and growth report includes detailed analyses of the competitive landscape of the market and information about key companies, including:

  • Alfa Chemistry
  • BASF SE
  • Clariant International Ltd.
  • Croda International Plc
  • Dow Chemical Co.
  • Elementis Plc
  • Evonik Industries AG
  • Galaxy Surfactants Ltd.
  • Huntsman International LLC
  • Kao Corp.
  • Lonza Group Ltd.
  • Nouryon Chemicals Holding B.V.
  • PCC SE
  • Stepan Co.
  • The Lubrizol Corp.

Qualitative and quantitative analysis of companies has been conducted to help clients understand the wider business environment as well as the strengths and weaknesses of key industry players. Data is qualitatively analyzed to categorize companies as pure play, category-focused, industry-focused, and diversified; it is quantitatively analyzed to categorize companies as dominant, leading, strong, tentative, and weak.

Recent Development and News in Amphoteric surfactant market

  • In August 2024, Galaxy Surfactants launched a new zwitterionic surfactant engineered to meet consumer demand for safe, sustainable ingredients in home and personal care products.
  • In November 2024, Indorama Ventures, through its Indovinya segment, announced an agreement to acquire the KEMELIX and FLOWSOLVE brands from Cargill Bioindustrial, strengthening its specialty surfactants portfolio for the energy sector.
  • In March 2025, Indonesia announced plans to raise its palm oil export levy, a move impacting the global supply chain and cost structure for oleochemical-based surfactants.
  • In April 2025, BASF launched Dehyton PK45 GA/RA, a cocamidopropyl betaine derived from Rainforest Alliance Certified coconut oil, offering formulators a high-performance ingredient with a verifiable sustainable supply chain.

Dive into Technavio’s robust research methodology, blending expert interviews, extensive data synthesis, and validated models for unparalleled Amphoteric Surfactant Market insights. See full methodology.

Market Scope
Page number 308
Base year 2025
Historic period 2020-2024
Forecast period 2026-2030
Growth momentum & CAGR Accelerate at a CAGR of 7.1%
Market growth 2026-2030 USD 1932.5 million
Market structure Fragmented
YoY growth 2025-2026(%) 6.5%
Key countries China, Japan, India, South Korea, Australia, Indonesia, Germany, UK, France, Italy, Spain, The Netherlands, US, Canada, Mexico, Brazil, Argentina, Colombia, Saudi Arabia, UAE, South Africa, Israel and Turkey
Competitive landscape Leading Companies, Market Positioning of Companies, Competitive Strategies, and Industry Risks

Request Free Sample

Research Analyst Overview

  • The market's evolution is anchored in advanced zwitterionic surfactant chemistry, which enables pH-dependent charge behavior and unique hydrotropic properties. The industry is pivoting from petrochemical derivatives toward sustainable oleochemical feedstocks for cocamidopropyl betaine synthesis and the creation of other high-purity amphoterics, including amine oxide surfactants and sultaine derivatives.
  • This shift supports the development of non-irritating formulations with a favorable biodegradable surfactant profile, essential for dermo-cosmetic ingredients and sulfate-free cleansing systems. Key performance attributes such as secondary surfactant function, viscosity modification, and foam boosting agents are refined in low-salt surfactant systems.
  • For boardroom strategy, the decision to invest in green chemistry principles and microbial fermentation surfactants like rhamnolipid biosurfactants or sophorolipid alternatives is critical for long-term competitiveness. Companies adopting these technologies have reported a 20% improvement in their renewable carbon index.
  • This transition also impacts industrial applications, including agrochemical adjuvants, corrosion inhibitor chemistry, oilfield demulsifiers, food-grade emulsifiers, and textile processing auxiliaries, where hard water tolerance and cold-processable surfactants are valued.
  • Adherence to EU Ecolabel compliance and mass balance certification, supported by robust REACH registration data and aquatic toxicity assessment, is now a baseline for market access, influencing the design of high-active formulations and concentrated detergent systems.

What are the Key Data Covered in this Amphoteric Surfactant Market Research and Growth Report?

  • What is the expected growth of the Amphoteric Surfactant Market between 2026 and 2030?

    • USD 1.93 billion, at a CAGR of 7.1%

  • What segmentation does the market report cover?

    • The report is segmented by Application (Personal care, Household cleaning, Agrochemicals, and Others), Type (Betaines, Aminoxides, and Others), End-user (Cosmetics, Food and beverage, and Others) and Geography (APAC, Europe, North America, South America, Middle East and Africa)

  • Which regions are analyzed in the report?

    • APAC, Europe, North America, South America and Middle East and Africa

  • What are the key growth drivers and market challenges?

    • Escalating demand for mild and sulfate-free personal care formulations, Volatility in raw material prices and supply chain instability

  • Who are the major players in the Amphoteric Surfactant Market?

    • Alfa Chemistry, BASF SE, Clariant International Ltd., Croda International Plc, Dow Chemical Co., Elementis Plc, Evonik Industries AG, Galaxy Surfactants Ltd., Huntsman International LLC, Kao Corp., Lonza Group Ltd., Nouryon Chemicals Holding B.V., PCC SE, Stepan Co. and The Lubrizol Corp.

Market Research Insights

  • The market dynamics are shaped by a complex interplay of performance requirements and cost pressures. While the threat of rivalry is moderate, the push for sustainable ingredient sourcing is compelling manufacturers to innovate beyond commodity chemical pricing. Formulations leveraging advanced amphoterics can reduce reliance on secondary thickeners by up to 15%, enhancing cost-performance ratios.
  • Although price sensitivity among buyers is high, the impact of quality on output is significant, with formulators prioritizing performance over incremental cost savings in over 70% of premium hair care ingredient applications. This focus on value-added formulations and dermo-cosmetic compatibility underscores a market where technical support services and application-specific innovation are key differentiators.

We can help! Our analysts can customize this amphoteric surfactant market research report to meet your requirements.

Get in touch

1. Executive Summary

1.1 Market overview

Executive Summary - Chart on Market Overview
Executive Summary - Data Table on Market Overview
Executive Summary - Chart on Global Market Characteristics
Executive Summary - Chart on Market by Geography
Executive Summary - Chart on Market Segmentation by Application
Executive Summary - Chart on Market Segmentation by Type
Executive Summary - Chart on Market Segmentation by End-user
Executive Summary - Chart on Incremental Growth
Executive Summary - Data Table on Incremental Growth
Executive Summary - Chart on Company Market Positioning

2. Technavio Analysis

2.1 Analysis of price sensitivity, lifecycle, customer purchase basket, adoption rates, and purchase criteria

2.2 Criticality of inputs and Factors of differentiation

Chart on Overview on criticality of inputs and factors of differentiation

2.3 Factors of disruption

Chart on Overview on factors of disruption

2.4 Impact of drivers and challenges

Chart on Impact of drivers and challenges in 2025 and 2030

3. Market Landscape

3.1 Market ecosystem

Chart on Parent Market
Data Table on - Parent Market

3.2 Market characteristics

Chart on Market characteristics analysis

3.3 Value chain analysis

Chart on Value chain analysis

4. Market Sizing

4.1 Market definition

Data Table on Offerings of companies included in the market definition

4.2 Market segment analysis

Market segments

4.3 Market size 2025

4.4 Market outlook: Forecast for 2025-2030

Chart on Global - Market size and forecast 2025-2030 ($ million)
Data Table on Global - Market size and forecast 2025-2030 ($ million)
Chart on Global Market: Year-over-year growth 2025-2030 (%)
Data Table on Global Market: Year-over-year growth 2025-2030 (%)

5. Historic Market Size

5.1 Global Amphoteric Surfactant Market 2020 - 2024

Historic Market Size - Data Table on Global Amphoteric Surfactant Market 2020 - 2024 ($ million)

5.2 Application segment analysis 2020 - 2024

Historic Market Size - Application Segment 2020 - 2024 ($ million)

5.3 Type segment analysis 2020 - 2024

Historic Market Size - Type Segment 2020 - 2024 ($ million)

5.4 End-user segment analysis 2020 - 2024

Historic Market Size - End-user Segment 2020 - 2024 ($ million)

5.5 Geography segment analysis 2020 - 2024

Historic Market Size - Geography Segment 2020 - 2024 ($ million)

5.6 Country segment analysis 2020 - 2024

Historic Market Size - Country Segment 2020 - 2024 ($ million)

6. Qualitative Analysis

6.1 The AI impact on Global Amphoteric Surfactant Market

7. Five Forces Analysis

7.1 Five forces summary

Five forces analysis - Comparison between 2025 and 2030

7.2 Bargaining power of buyers

Bargaining power of buyers - Impact of key factors 2025 and 2030

7.3 Bargaining power of suppliers

Bargaining power of suppliers - Impact of key factors in 2025 and 2030

7.4 Threat of new entrants

Threat of new entrants - Impact of key factors in 2025 and 2030

7.5 Threat of substitutes

Threat of substitutes - Impact of key factors in 2025 and 2030

7.6 Threat of rivalry

Threat of rivalry - Impact of key factors in 2025 and 2030

7.7 Market condition

Chart on Market condition - Five forces 2025 and 2030

8. Market Segmentation by Application

8.1 Market segments

Chart on Application - Market share 2025-2030 (%)
Data Table on Application - Market share 2025-2030 (%)

8.2 Comparison by Application

Chart on Comparison by Application
Data Table on Comparison by Application

8.3 Personal care - Market size and forecast 2025-2030

Chart on Personal care - Market size and forecast 2025-2030 ($ million)
Data Table on Personal care - Market size and forecast 2025-2030 ($ million)
Chart on Personal care - Year-over-year growth 2025-2030 (%)
Data Table on Personal care - Year-over-year growth 2025-2030 (%)

8.4 Household cleaning - Market size and forecast 2025-2030

Chart on Household cleaning - Market size and forecast 2025-2030 ($ million)
Data Table on Household cleaning - Market size and forecast 2025-2030 ($ million)
Chart on Household cleaning - Year-over-year growth 2025-2030 (%)
Data Table on Household cleaning - Year-over-year growth 2025-2030 (%)

8.5 Agrochemicals - Market size and forecast 2025-2030

Chart on Agrochemicals - Market size and forecast 2025-2030 ($ million)
Data Table on Agrochemicals - Market size and forecast 2025-2030 ($ million)
Chart on Agrochemicals - Year-over-year growth 2025-2030 (%)
Data Table on Agrochemicals - Year-over-year growth 2025-2030 (%)

8.6 Others - Market size and forecast 2025-2030

Chart on Others - Market size and forecast 2025-2030 ($ million)
Data Table on Others - Market size and forecast 2025-2030 ($ million)
Chart on Others - Year-over-year growth 2025-2030 (%)
Data Table on Others - Year-over-year growth 2025-2030 (%)

8.7 Market opportunity by Application

Market opportunity by Application ($ million)
Data Table on Market opportunity by Application ($ million)

9. Market Segmentation by Type

9.1 Market segments

Chart on Type - Market share 2025-2030 (%)
Data Table on Type - Market share 2025-2030 (%)

9.2 Comparison by Type

Chart on Comparison by Type
Data Table on Comparison by Type

9.3 Betaines - Market size and forecast 2025-2030

Chart on Betaines - Market size and forecast 2025-2030 ($ million)
Data Table on Betaines - Market size and forecast 2025-2030 ($ million)
Chart on Betaines - Year-over-year growth 2025-2030 (%)
Data Table on Betaines - Year-over-year growth 2025-2030 (%)

9.4 Aminoxides - Market size and forecast 2025-2030

Chart on Aminoxides - Market size and forecast 2025-2030 ($ million)
Data Table on Aminoxides - Market size and forecast 2025-2030 ($ million)
Chart on Aminoxides - Year-over-year growth 2025-2030 (%)
Data Table on Aminoxides - Year-over-year growth 2025-2030 (%)

9.5 Others - Market size and forecast 2025-2030

Chart on Others - Market size and forecast 2025-2030 ($ million)
Data Table on Others - Market size and forecast 2025-2030 ($ million)
Chart on Others - Year-over-year growth 2025-2030 (%)
Data Table on Others - Year-over-year growth 2025-2030 (%)

9.6 Market opportunity by Type

Market opportunity by Type ($ million)
Data Table on Market opportunity by Type ($ million)

10. Market Segmentation by End-user

10.1 Market segments

Chart on End-user - Market share 2025-2030 (%)
Data Table on End-user - Market share 2025-2030 (%)

10.2 Comparison by End-user

Chart on Comparison by End-user
Data Table on Comparison by End-user

10.3 Cosmetics - Market size and forecast 2025-2030

Chart on Cosmetics - Market size and forecast 2025-2030 ($ million)
Data Table on Cosmetics - Market size and forecast 2025-2030 ($ million)
Chart on Cosmetics - Year-over-year growth 2025-2030 (%)
Data Table on Cosmetics - Year-over-year growth 2025-2030 (%)

10.4 Food and beverage - Market size and forecast 2025-2030

Chart on Food and beverage - Market size and forecast 2025-2030 ($ million)
Data Table on Food and beverage - Market size and forecast 2025-2030 ($ million)
Chart on Food and beverage - Year-over-year growth 2025-2030 (%)
Data Table on Food and beverage - Year-over-year growth 2025-2030 (%)

10.5 Others - Market size and forecast 2025-2030

Chart on Others - Market size and forecast 2025-2030 ($ million)
Data Table on Others - Market size and forecast 2025-2030 ($ million)
Chart on Others - Year-over-year growth 2025-2030 (%)
Data Table on Others - Year-over-year growth 2025-2030 (%)

10.6 Market opportunity by End-user

Market opportunity by End-user ($ million)
Data Table on Market opportunity by End-user ($ million)

11. Customer Landscape

11.1 Customer landscape overview

Analysis of price sensitivity, lifecycle, customer purchase basket, adoption rates, and purchase criteria

12. Geographic Landscape

12.1 Geographic segmentation

Chart on Market share by geography 2025-2030 (%)
Data Table on Market share by geography 2025-2030 (%)

12.2 Geographic comparison

Chart on Geographic comparison
Data Table on Geographic comparison

12.3 APAC - Market size and forecast 2025-2030

Chart on APAC - Market size and forecast 2025-2030 ($ million)
Data Table on APAC - Market size and forecast 2025-2030 ($ million)
Chart on APAC - Year-over-year growth 2025-2030 (%)
Data Table on APAC - Year-over-year growth 2025-2030 (%)
Chart on Regional Comparison - APAC
Data Table on Regional Comparison - APAC

12.3.1 China - Market size and forecast 2025-2030

Chart on China - Market size and forecast 2025-2030 ($ million)
Data Table on China - Market size and forecast 2025-2030 ($ million)
Chart on China - Year-over-year growth 2025-2030 (%)
Data Table on China - Year-over-year growth 2025-2030 (%)

12.3.2 Japan - Market size and forecast 2025-2030

Chart on Japan - Market size and forecast 2025-2030 ($ million)
Data Table on Japan - Market size and forecast 2025-2030 ($ million)
Chart on Japan - Year-over-year growth 2025-2030 (%)
Data Table on Japan - Year-over-year growth 2025-2030 (%)

12.3.3 India - Market size and forecast 2025-2030

Chart on India - Market size and forecast 2025-2030 ($ million)
Data Table on India - Market size and forecast 2025-2030 ($ million)
Chart on India - Year-over-year growth 2025-2030 (%)
Data Table on India - Year-over-year growth 2025-2030 (%)

12.3.4 South Korea - Market size and forecast 2025-2030

Chart on South Korea - Market size and forecast 2025-2030 ($ million)
Data Table on South Korea - Market size and forecast 2025-2030 ($ million)
Chart on South Korea - Year-over-year growth 2025-2030 (%)
Data Table on South Korea - Year-over-year growth 2025-2030 (%)

12.3.5 Australia - Market size and forecast 2025-2030

Chart on Australia - Market size and forecast 2025-2030 ($ million)
Data Table on Australia - Market size and forecast 2025-2030 ($ million)
Chart on Australia - Year-over-year growth 2025-2030 (%)
Data Table on Australia - Year-over-year growth 2025-2030 (%)

12.3.6 Indonesia - Market size and forecast 2025-2030

Chart on Indonesia - Market size and forecast 2025-2030 ($ million)
Data Table on Indonesia - Market size and forecast 2025-2030 ($ million)
Chart on Indonesia - Year-over-year growth 2025-2030 (%)
Data Table on Indonesia - Year-over-year growth 2025-2030 (%)

12.4 Europe - Market size and forecast 2025-2030

Chart on Europe - Market size and forecast 2025-2030 ($ million)
Data Table on Europe - Market size and forecast 2025-2030 ($ million)
Chart on Europe - Year-over-year growth 2025-2030 (%)
Data Table on Europe - Year-over-year growth 2025-2030 (%)
Chart on Regional Comparison - Europe
Data Table on Regional Comparison - Europe

12.4.1 Germany - Market size and forecast 2025-2030

Chart on Germany - Market size and forecast 2025-2030 ($ million)
Data Table on Germany - Market size and forecast 2025-2030 ($ million)
Chart on Germany - Year-over-year growth 2025-2030 (%)
Data Table on Germany - Year-over-year growth 2025-2030 (%)

12.4.2 UK - Market size and forecast 2025-2030

Chart on UK - Market size and forecast 2025-2030 ($ million)
Data Table on UK - Market size and forecast 2025-2030 ($ million)
Chart on UK - Year-over-year growth 2025-2030 (%)
Data Table on UK - Year-over-year growth 2025-2030 (%)

12.4.3 France - Market size and forecast 2025-2030

Chart on France - Market size and forecast 2025-2030 ($ million)
Data Table on France - Market size and forecast 2025-2030 ($ million)
Chart on France - Year-over-year growth 2025-2030 (%)
Data Table on France - Year-over-year growth 2025-2030 (%)

12.4.4 Italy - Market size and forecast 2025-2030

Chart on Italy - Market size and forecast 2025-2030 ($ million)
Data Table on Italy - Market size and forecast 2025-2030 ($ million)
Chart on Italy - Year-over-year growth 2025-2030 (%)
Data Table on Italy - Year-over-year growth 2025-2030 (%)

12.4.5 Spain - Market size and forecast 2025-2030

Chart on Spain - Market size and forecast 2025-2030 ($ million)
Data Table on Spain - Market size and forecast 2025-2030 ($ million)
Chart on Spain - Year-over-year growth 2025-2030 (%)
Data Table on Spain - Year-over-year growth 2025-2030 (%)

12.4.6 The Netherlands - Market size and forecast 2025-2030

Chart on The Netherlands - Market size and forecast 2025-2030 ($ million)
Data Table on The Netherlands - Market size and forecast 2025-2030 ($ million)
Chart on The Netherlands - Year-over-year growth 2025-2030 (%)
Data Table on The Netherlands - Year-over-year growth 2025-2030 (%)

12.5 North America - Market size and forecast 2025-2030

Chart on North America - Market size and forecast 2025-2030 ($ million)
Data Table on North America - Market size and forecast 2025-2030 ($ million)
Chart on North America - Year-over-year growth 2025-2030 (%)
Data Table on North America - Year-over-year growth 2025-2030 (%)
Chart on Regional Comparison - North America
Data Table on Regional Comparison - North America

12.5.1 US - Market size and forecast 2025-2030

Chart on US - Market size and forecast 2025-2030 ($ million)
Data Table on US - Market size and forecast 2025-2030 ($ million)
Chart on US - Year-over-year growth 2025-2030 (%)
Data Table on US - Year-over-year growth 2025-2030 (%)

12.5.2 Canada - Market size and forecast 2025-2030

Chart on Canada - Market size and forecast 2025-2030 ($ million)
Data Table on Canada - Market size and forecast 2025-2030 ($ million)
Chart on Canada - Year-over-year growth 2025-2030 (%)
Data Table on Canada - Year-over-year growth 2025-2030 (%)

12.5.3 Mexico - Market size and forecast 2025-2030

Chart on Mexico - Market size and forecast 2025-2030 ($ million)
Data Table on Mexico - Market size and forecast 2025-2030 ($ million)
Chart on Mexico - Year-over-year growth 2025-2030 (%)
Data Table on Mexico - Year-over-year growth 2025-2030 (%)

12.6 South America - Market size and forecast 2025-2030

Chart on South America - Market size and forecast 2025-2030 ($ million)
Data Table on South America - Market size and forecast 2025-2030 ($ million)
Chart on South America - Year-over-year growth 2025-2030 (%)
Data Table on South America - Year-over-year growth 2025-2030 (%)
Chart on Regional Comparison - South America
Data Table on Regional Comparison - South America

12.6.1 Brazil - Market size and forecast 2025-2030

Chart on Brazil - Market size and forecast 2025-2030 ($ million)
Data Table on Brazil - Market size and forecast 2025-2030 ($ million)
Chart on Brazil - Year-over-year growth 2025-2030 (%)
Data Table on Brazil - Year-over-year growth 2025-2030 (%)

12.6.2 Argentina - Market size and forecast 2025-2030

Chart on Argentina - Market size and forecast 2025-2030 ($ million)
Data Table on Argentina - Market size and forecast 2025-2030 ($ million)
Chart on Argentina - Year-over-year growth 2025-2030 (%)
Data Table on Argentina - Year-over-year growth 2025-2030 (%)

12.6.3 Colombia - Market size and forecast 2025-2030

Chart on Colombia - Market size and forecast 2025-2030 ($ million)
Data Table on Colombia - Market size and forecast 2025-2030 ($ million)
Chart on Colombia - Year-over-year growth 2025-2030 (%)
Data Table on Colombia - Year-over-year growth 2025-2030 (%)

12.7 Middle East and Africa - Market size and forecast 2025-2030

Chart on Middle East and Africa - Market size and forecast 2025-2030 ($ million)
Data Table on Middle East and Africa - Market size and forecast 2025-2030 ($ million)
Chart on Middle East and Africa - Year-over-year growth 2025-2030 (%)
Data Table on Middle East and Africa - Year-over-year growth 2025-2030 (%)
Chart on Regional Comparison - Middle East and Africa
Data Table on Regional Comparison - Middle East and Africa

12.7.1 Saudi Arabia - Market size and forecast 2025-2030

Chart on Saudi Arabia - Market size and forecast 2025-2030 ($ million)
Data Table on Saudi Arabia - Market size and forecast 2025-2030 ($ million)
Chart on Saudi Arabia - Year-over-year growth 2025-2030 (%)
Data Table on Saudi Arabia - Year-over-year growth 2025-2030 (%)

12.7.2 UAE - Market size and forecast 2025-2030

Chart on UAE - Market size and forecast 2025-2030 ($ million)
Data Table on UAE - Market size and forecast 2025-2030 ($ million)
Chart on UAE - Year-over-year growth 2025-2030 (%)
Data Table on UAE - Year-over-year growth 2025-2030 (%)

12.7.3 South Africa - Market size and forecast 2025-2030

Chart on South Africa - Market size and forecast 2025-2030 ($ million)
Data Table on South Africa - Market size and forecast 2025-2030 ($ million)
Chart on South Africa - Year-over-year growth 2025-2030 (%)
Data Table on South Africa - Year-over-year growth 2025-2030 (%)

12.7.4 Israel - Market size and forecast 2025-2030

Chart on Israel - Market size and forecast 2025-2030 ($ million)
Data Table on Israel - Market size and forecast 2025-2030 ($ million)
Chart on Israel - Year-over-year growth 2025-2030 (%)
Data Table on Israel - Year-over-year growth 2025-2030 (%)

12.7.5 Turkey - Market size and forecast 2025-2030

Chart on Turkey - Market size and forecast 2025-2030 ($ million)
Data Table on Turkey - Market size and forecast 2025-2030 ($ million)
Chart on Turkey - Year-over-year growth 2025-2030 (%)
Data Table on Turkey - Year-over-year growth 2025-2030 (%)

12.8 Market opportunity by geography

Market opportunity by geography ($ million)
Data Tables on Market opportunity by geography ($ million)

13. Drivers, Challenges, and Opportunity

13.1 Market drivers

Escalating demand for mild and sulfate-free personal care formulations
Environmental regulations and transition to green chemistry
Expansion in high-performance agrochemical and industrial applications

13.2 Market challenges

Volatility in raw material prices and supply chain instability
Stringent regulatory compliance and evolving environmental standards
Intense competition from bio-based substitutes and market saturation

13.3 Impact of drivers and challenges

Impact of drivers and challenges in 2025 and 2030

13.4 Market opportunities

Acceleration of bio-based feedstocks and certified sustainability
Dominance of mild surfactants in sulfate-free personal care
Strategic expansion and industrial diversification

14. Competitive Landscape

14.1 Overview

14.2

Overview on criticality of inputs and factors of differentiation

14.3 Landscape disruption

Overview on factors of disruption

14.4 Industry risks

Impact of key risks on business

15. Competitive Analysis

15.1 Companies profiled

Companies covered

15.2 Company ranking index

15.3 Market positioning of companies

Matrix on companies position and classification

15.4 Alfa Chemistry

Alfa Chemistry - Overview
Alfa Chemistry - Product / Service
Alfa Chemistry - Key offerings
SWOT

15.5 BASF SE

BASF SE - Overview
BASF SE - Business segments
BASF SE - Key news
BASF SE - Key offerings
BASF SE - Segment focus
SWOT

15.6 Clariant International Ltd.

Clariant International Ltd. - Overview
Clariant International Ltd. - Business segments
Clariant International Ltd. - Key news
Clariant International Ltd. - Key offerings
Clariant International Ltd. - Segment focus
SWOT

15.7 Croda International Plc

Croda International Plc - Overview
Croda International Plc - Business segments
Croda International Plc - Key offerings
Croda International Plc - Segment focus
SWOT

15.8 Dow Chemical Co.

Dow Chemical Co. - Overview
Dow Chemical Co. - Business segments
Dow Chemical Co. - Key news
Dow Chemical Co. - Key offerings
Dow Chemical Co. - Segment focus
SWOT

15.9 Elementis Plc

Elementis Plc - Overview
Elementis Plc - Business segments
Elementis Plc - Key news
Elementis Plc - Key offerings
Elementis Plc - Segment focus
SWOT

15.10 Evonik Industries AG

Evonik Industries AG - Overview
Evonik Industries AG - Business segments
Evonik Industries AG - Key news
Evonik Industries AG - Key offerings
Evonik Industries AG - Segment focus
SWOT

15.11 Galaxy Surfactants Ltd.

Galaxy Surfactants Ltd. - Overview
Galaxy Surfactants Ltd. - Product / Service
Galaxy Surfactants Ltd. - Key offerings
SWOT

15.12 Huntsman International LLC

Huntsman International LLC - Overview
Huntsman International LLC - Business segments
Huntsman International LLC - Key news
Huntsman International LLC - Key offerings
Huntsman International LLC - Segment focus
SWOT

15.13 Kao Corp.

Kao Corp. - Overview
Kao Corp. - Business segments
Kao Corp. - Key news
Kao Corp. - Key offerings
Kao Corp. - Segment focus
SWOT

15.14 Lonza Group Ltd.

Lonza Group Ltd. - Overview
Lonza Group Ltd. - Business segments
Lonza Group Ltd. - Key news
Lonza Group Ltd. - Key offerings
Lonza Group Ltd. - Segment focus
SWOT

15.15 Nouryon Chemicals Holding B.V.

Nouryon Chemicals Holding B.V. - Overview
Nouryon Chemicals Holding B.V. - Product / Service
Nouryon Chemicals Holding B.V. - Key offerings
SWOT

15.16 PCC SE

PCC SE - Overview
PCC SE - Product / Service
PCC SE - Key offerings
SWOT

15.17 Stepan Co.

Stepan Co. - Overview
Stepan Co. - Business segments
Stepan Co. - Key offerings
Stepan Co. - Segment focus
SWOT

15.18 The Lubrizol Corp.

The Lubrizol Corp. - Overview
The Lubrizol Corp. - Product / Service
The Lubrizol Corp. - Key offerings
SWOT

16. Appendix

16.1 Scope of the report

Market definition
Objectives
Notes and caveats

16.2 Inclusions and exclusions checklist

Inclusions checklist
Exclusions checklist

16.3 Currency conversion rates for US$

16.4 Research methodology

16.5 Data procurement

Information sources

16.6 Data validation

16.7 Validation techniques employed for market sizing

16.8 Data synthesis

16.9 360 degree market analysis

16.10 List of abbreviations

Research Methodology

Technavio presents a detailed picture of the market by way of study, synthesis, and summation of data from multiple sources. The analysts have presented the various facets of the market with a particular focus on identifying the key industry influencers. The data thus presented is comprehensive, reliable, and the result of extensive research, both primary and secondary.

INFORMATION SOURCES

Primary sources

  • Manufacturers and suppliers
  • Channel partners
  • Industry experts
  • Strategic decision makers

Secondary sources

  • Industry journals and periodicals
  • Government data
  • Financial reports of key industry players
  • Historical data
  • Press releases

DATA ANALYSIS

Data Synthesis

  • Collation of data
  • Estimation of key figures
  • Analysis of derived insights

Data Validation

  • Triangulation with data models
  • Reference against proprietary databases
  • Corroboration with industry experts

REPORT WRITING

Qualitative

  • Market drivers
  • Market challenges
  • Market trends
  • Five forces analysis

Quantitative

  • Market size and forecast
  • Market segmentation
  • Geographical insights
  • Competitive landscape

Interested in this report?

Get your sample now to see our research methodology and insights!

Download Now

Frequently Asked Questions

Amphoteric Surfactant market growth will increase by USD 1932.5 million during 2026-2030.

The Amphoteric Surfactant market is expected to grow at a CAGR of 7.1% during 2026-2030.

Amphoteric Surfactant market is segmented by Application (Personal care, Household cleaning, Agrochemicals, Others) Type (Betaines, Aminoxides, Others) End-user (Cosmetics, Food and beverage, Others)

Alfa Chemistry, BASF SE, Clariant International Ltd., Croda International Plc, Dow Chemical Co., Elementis Plc, Evonik Industries AG, Galaxy Surfactants Ltd., Huntsman International LLC, Kao Corp., Lonza Group Ltd., Nouryon Chemicals Holding B.V., PCC SE, Stepan Co., The Lubrizol Corp. are a few of the key vendors in the Amphoteric Surfactant market.

APAC will register the highest growth rate of 43% among the other regions. Therefore, the Amphoteric Surfactant market in APAC is expected to garner significant business opportunities for the vendors during the forecast period.

China, Japan, India, South Korea, Australia, Indonesia, Germany, UK, France, Italy, Spain, The Netherlands, US, Canada, Mexico, Brazil, Argentina, Colombia, Saudi Arabia, UAE, South Africa, Israel, Turkey

  • Escalating demand for mild and sulfate-free personal care formulations is the driving factor this market.

The Amphoteric Surfactant market vendors should focus on grabbing business opportunities from the Application segment as it accounted for the largest market share in the base year.