Ambulatory Surgical Centers Market Analysis, Size, and Forecast 2026-2030: North America (US, Canada, and Mexico), Europe (Germany, France, and UK), APAC (China, Japan, and India), South America (Brazil, Argentina, and Colombia), Middle East and Africa (Saudi Arabia, UAE, and Turkey), Asia, Rest of World (ROW)

Ambulatory Surgical Centers Market Analysis, Size, and Forecast 2026-2030:
North America (US, Canada, and Mexico), Europe (Germany, France, and UK), APAC (China, Japan, and India), South America (Brazil, Argentina, and Colombia), Middle East and Africa (Saudi Arabia, UAE, and Turkey), Asia, Rest of World (ROW)

Published: Mar 2026 312 Pages SKU: IRTNTR75127

Market Overview at a Glance

$29.82 B
Market Opportunity
6.3%
CAGR 2025 - 2030
50.4%
North America Growth
$51.19 B
Single-specialty centers segment 2024

Ambulatory Surgical Centers Market Size 2026-2030

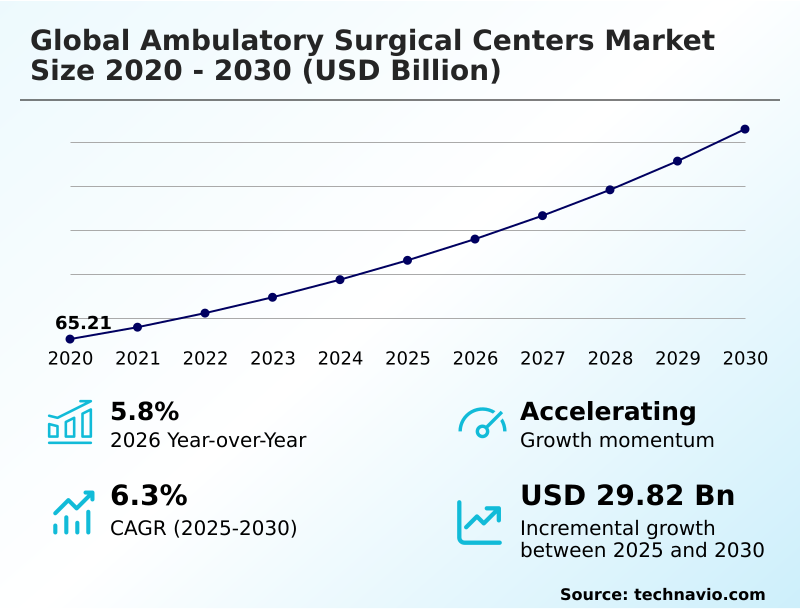
The ambulatory surgical centers market size is valued to increase by USD 29.82 billion, at a CAGR of 6.3% from 2025 to 2030. Regulatory support and acceleration of value-based payment models will drive the ambulatory surgical centers market.

Major Market Trends & Insights

  • North America dominated the market and accounted for a 50.4% growth during the forecast period.
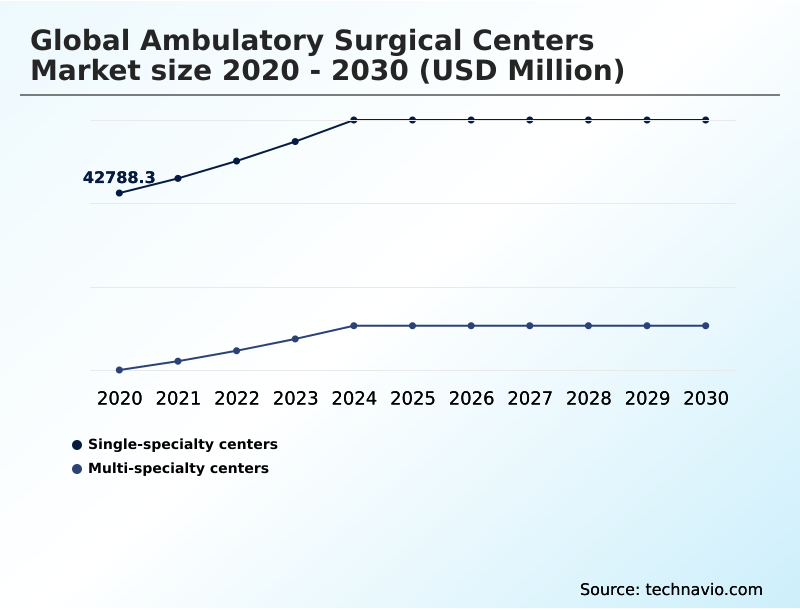
  • By Type - Single-specialty centers segment was valued at USD 51.19 billion in 2024
  • By Modality - Hospital-affiliated ASCs segment accounted for the largest market revenue share in 2024

Market Size & Forecast

  • Market Opportunities: USD 47.72 billion
  • Market Future Opportunities: USD 29.82 billion
  • CAGR from 2025 to 2030 : 6.3%

Market Summary

  • The ambulatory surgical centers market is undergoing a structural transformation, driven by a concerted push toward value-based care and cost containment. Advancements in minimally invasive surgical techniques, coupled with enhanced anesthetic protocols, are enabling the migration of high-acuity procedures like total joint replacements and cardiovascular interventions from hospitals to outpatient settings.
  • This shift is supported by payers who incentivize the use of ambulatory surgical centers due to their lower cost structure. As a result, the competitive landscape is defined by aggressive consolidation, with private equity firms and large corporate operators acquiring independent, physician-owned centers to build scalable platforms.
  • For instance, a mid-sized operator faces the strategic decision of whether to invest heavily in a new robotic surgery platform to attract top orthopedic surgeons or to seek a partnership with a larger health system. This decision directly impacts their ability to negotiate favorable payer contracts and manage the increasing administrative burden of regulatory compliance.
  • However, the industry's expansion is constrained by a chronic shortage of specialized clinical labor and wage inflation, which compresses margins and threatens operational continuity. Navigating these dynamics requires a focus on operational efficiency and strategic physician alignment models to ensure long-term viability.

What will be the Size of the Ambulatory Surgical Centers Market during the forecast period?

Get Key Insights on Market Forecast (PDF) Request Free Sample

How is the Ambulatory Surgical Centers Market Segmented?

The ambulatory surgical centers industry research report provides comprehensive data (region-wise segment analysis), with forecasts and estimates in "USD million" for the period 2026-2030, as well as historical data from 2020-2024 for the following segments.

  • Type
    • Single-specialty centers
    • Multi-specialty centers
  • Modality
    • Hospital-affiliated ASCs
    • Freestanding ASCs
  • Service
    • Treatment
    • Diagnosis
  • Service type
    • Otolaryngology
    • Endoscopy
    • Obstetrics or gynecology
    • Dental
    • Others
  • Geography
    • North America
      • US
      • Canada
      • Mexico
    • Europe
      • Germany
      • France
      • UK
    • Asia
    • Rest of World (ROW)

By Type Insights

The single-specialty centers segment is estimated to witness significant growth during the forecast period.

The single-specialty center segment is driven by high-volume disciplines like ophthalmology and gastroenterology, designed for maximum efficiency in outpatient surgical care. These facilities leverage standardized workflows for specific outpatient procedures, enabling streamlined surgical scheduling optimization and superior payer contract negotiation.

By focusing on narrow specialty service lines, they achieve high repetition, which is critical for mastering minimally invasive surgery techniques and refining anesthetic protocols.

This model offers physicians significant control over the surgical environment, a key factor in their migration from hospital employment. Consolidation is rampant as management services organizations aggregate these centers to form scalable platforms.

These platforms are better equipped to handle stringent quality reporting requirements and invest in technologies like robotic-assisted surgery, improving outcomes in same-day surgery by over 15% in certain complex cases.

Request Free Sample

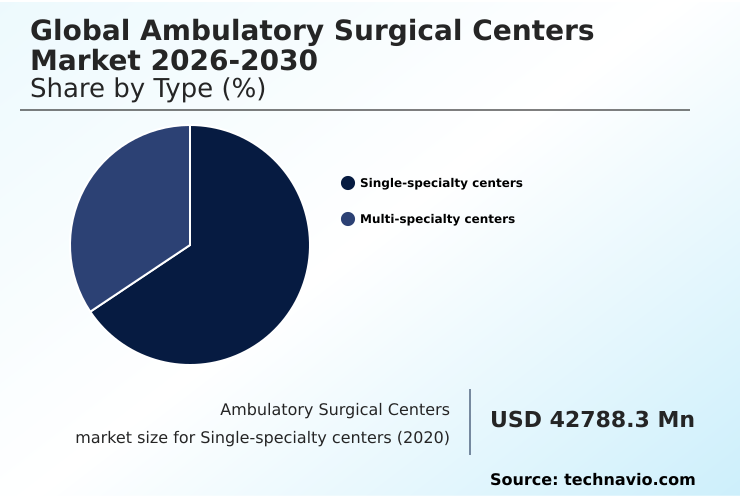
The Single-specialty centers segment was valued at USD 51.19 billion in 2024 and showed a gradual increase during the forecast period.

Request Free Sample

Regional Analysis

North America is estimated to contribute 50.4% to the growth of the global market during the forecast period.Technavio’s analysts have elaborately explained the regional trends and drivers that shape the market during the forecast period.

See How Ambulatory Surgical Centers Market Demand is Rising in North America Request Free Sample

The geographic landscape of the ambulatory surgical centers market is led by North America, which accounts for over 50% of the incremental growth, driven by favorable site-neutral payments and bundled payment initiatives.

In this region, a sophisticated ambulatory care strategy focuses on de novo facility construction in suburban areas.

In contrast, Europe is adopting value-based care models to manage public healthcare backlogs, with an emphasis on enhanced recovery after surgery protocols to improve efficiency.

Asian markets are experiencing the fastest expansion, with private chains implementing hub-and-spoke models that reduce facility overhead by up to 30% compared to tertiary hospitals.

Across all regions, effective outpatient facility management and robust revenue cycle management systems are crucial for navigating regulatory complexities and ensuring high clinical safety standards amid intense physician recruitment and retention competition.

Market Dynamics

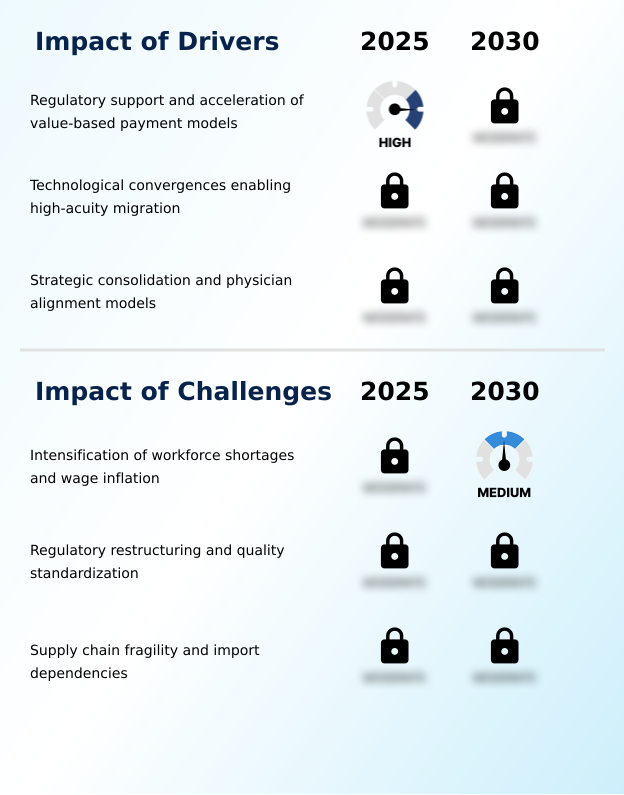
Our researchers analyzed the data with 2025 as the base year, along with the key drivers, trends, and challenges. A holistic analysis of drivers will help companies refine their marketing strategies to gain a competitive advantage.

  • Strategic decision-making in the ambulatory surgical centers market hinges on a careful analysis of several interconnected factors. A key consideration is the cost comparison hospital versus asc, which consistently shows that outpatient settings offer significant savings, a fact that underpins payer strategies. The private equity impact on asc operations is profound, accelerating consolidation and providing capital for key investments.
  • This includes the robotic surgery adoption in ascs, a critical move for attracting top surgeons and enabling the orthopedic surgery migration to ascs. Concurrently, the growth of cardiovascular procedures in outpatient setting opens new high-margin service lines. However, operators must navigate significant headwinds. Managing asc workforce shortages has become a primary operational focus, directly impacting profitability.
  • Supply chain challenges for ascs can lead to case cancellations, necessitating resilient procurement strategies. Furthermore, evolving regulatory changes for asc procedures require constant vigilance to maintain compliance.
  • Ultimately, the success of different ownership structures is evaluated by patient outcomes in freestanding ascs versus integrated models, with many turning to asc joint venture models benefits to align hospital and physician interests, which has proven to increase case volume by more than 15% in some partnerships.

What are the key market drivers leading to the rise in the adoption of Ambulatory Surgical Centers Industry?

  • Regulatory support and the acceleration of value-based payment models serve as a key driver for the ambulatory surgical centers market.

  • A primary driver is aggressive private equity investment, which fuels the expansion of corporate operator networks and the professionalization of outpatient surgery facilities through the management services organization model.
  • This capital influx facilitates surgical technology adoption, with centers investing in robotics achieving over 15% improvement in clinical outcome improvement for complex cases. These platforms enable significant healthcare cost reduction, performing procedures at costs 40-50% lower than hospitals.
  • Physician equity models are instrumental in aligning incentives, boosting productivity and attracting talent to manage a rising case mix complexity.
  • Effective post-operative care coordination and precise outpatient procedure coding are critical for maximizing reimbursement and ensuring financial viability in this consolidating landscape.

What are the market trends shaping the Ambulatory Surgical Centers Industry?

  • A dominant market trend is the acceleration of cardiovascular procedure migration, which is shifting complex interventions from traditional hospitals to specialized outpatient settings.

  • A dominant trend is the acceleration of high-acuity case migration into outpatient settings, particularly within high-volume surgical specialties like cardiology and orthopedics. Advanced medical device integration and clinical pathway standardization have enabled facilities to safely increase surgical case volume, with some centers reporting a 25% increase in complex procedures year-over-year.
  • This shift is compelling physician-owned centers to pursue physician partnership syndication to fund technology acquisitions. Ambulatory care platforms are crucial for managing new outpatient reimbursement models and complex regulatory compliance frameworks. Maintaining high patient satisfaction metrics is now a key performance indicator, directly impacting reimbursement in over 30% of new value-based contracts and driving adherence to strict accreditation standards.

What challenges does the Ambulatory Surgical Centers Industry face during its growth?

  • The intensification of workforce shortages and related wage inflation poses a significant challenge to the growth of the ambulatory surgical centers industry.

  • A major challenge is navigating volatile procedure reimbursement policies and the high upfront capital equipment expenditure required for ambulatory service line growth. The ongoing healthcare infrastructure shift necessitates robust cost-containment strategies as margin pressures intensify; labor costs alone have risen by over 10% in competitive markets.
  • Ambulatory network expansion is further complicated by stringent surgical center accreditation rules and the need for sophisticated regulatory change management. While healthcare joint ventures can mitigate financial risk, achieving profitability on elective surgical procedures under value-based purchasing models remains difficult.
  • This environment forces operators to focus on outpatient setting optimization to ensure that investments in surgical hub development deliver a sustainable return amid market uncertainties.

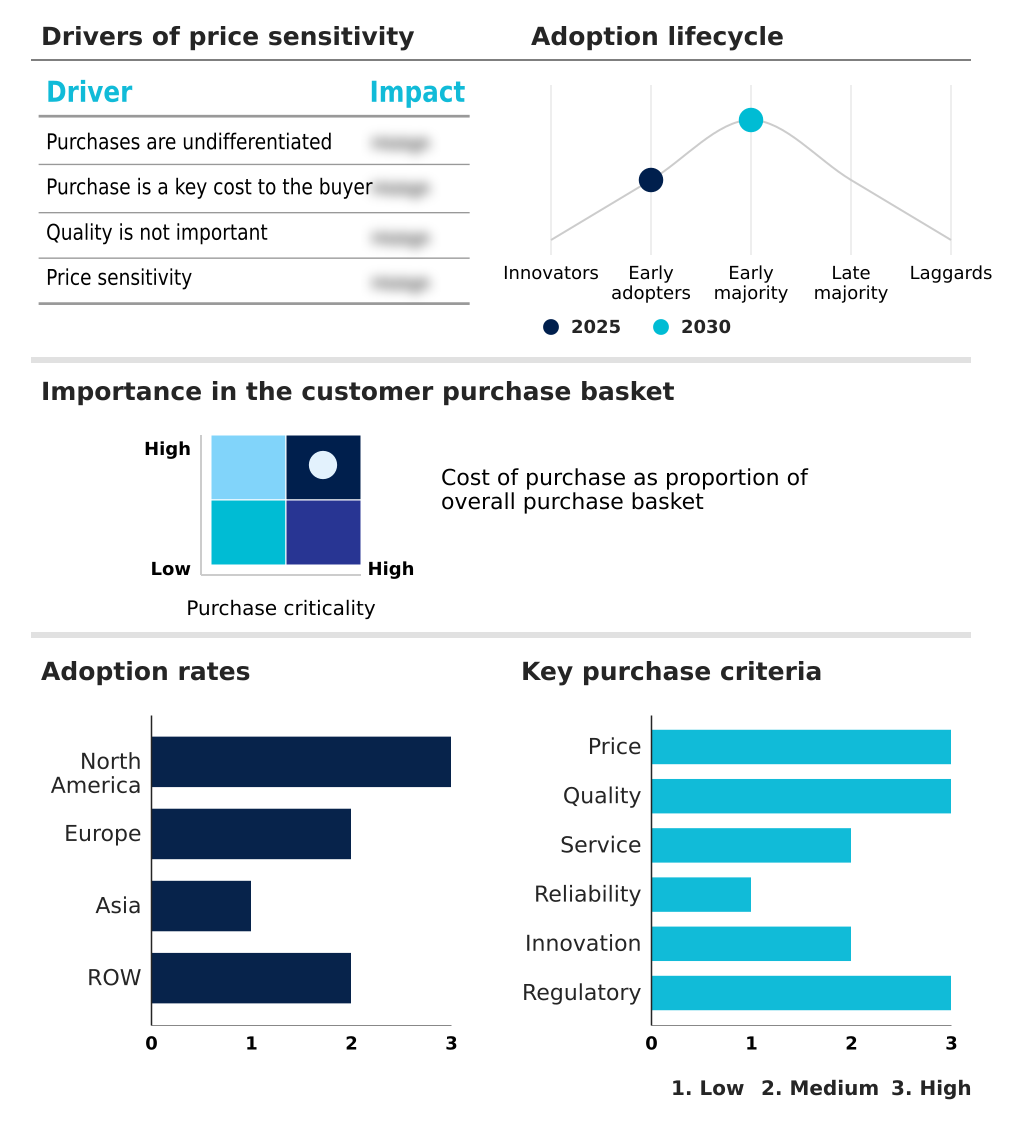
Exclusive Technavio Analysis on Customer Landscape

The ambulatory surgical centers market forecasting report includes the adoption lifecycle of the market, covering from the innovator’s stage to the laggard’s stage. It focuses on adoption rates in different regions based on penetration. Furthermore, the ambulatory surgical centers market report also includes key purchase criteria and drivers of price sensitivity to help companies evaluate and develop their market growth analysis strategies.

Customer Landscape of Ambulatory Surgical Centers Industry

Competitive Landscape

Companies are implementing various strategies, such as strategic alliances, ambulatory surgical centers market forecast, partnerships, mergers and acquisitions, geographical expansion, and product/service launches, to enhance their presence in the industry.

Align Surgical Associates Inc. - Delivers strategic and operational management for ambulatory surgical centers, enabling high-quality, same-day surgical care and enhanced patient experiences.

The industry research and growth report includes detailed analyses of the competitive landscape of the market and information about key companies, including:

  • Align Surgical Associates Inc.
  • Ambulatory Surgery Center
  • American Vision Partners
  • AMSURG Corp.
  • Azura Vascular Care
  • Becton Dickinson and Co.
  • Boston Scientific Corp.
  • HCA Healthcare Inc.
  • IOR Partners
  • Medtronic Plc
  • NueHealth
  • Regent Surgical Health
  • SCA health
  • Stryker Corp.
  • Surgery Partners Inc.
  • Tenet Healthcare Corp.
  • Unifeye Vision Partners
  • University Hospitals

Qualitative and quantitative analysis of companies has been conducted to help clients understand the wider business environment as well as the strengths and weaknesses of key industry players. Data is qualitatively analyzed to categorize companies as pure play, category-focused, industry-focused, and diversified; it is quantitatively analyzed to categorize companies as dominant, leading, strong, tentative, and weak.

Recent Development and News in Ambulatory surgical centers market

  • In February 2025, Tenet Healthcare earmarked approximately $450 million in capital for ambulatory surgical center mergers and acquisitions, signaling a corporate pivot toward expanding its outpatient sector.
  • In March 2025, United Surgical Partners International inaugurated a state-of-the-art cardiovascular ambulatory surgery center in Phoenix, Arizona, designed to handle complex interventions like pacemaker implantations and stenting.
  • In April 2025, Intuitive Surgical announced the commercial availability of its da Vinci 5 surgical system, featuring software upgrades for outpatient efficiency, leading to increased adoption in high-acuity robotic cases.
  • In September 2025, Webster Equity Partners announced the merger of three regional eye care practices to form Retina and Eye Surgery Partners, a national platform that includes twelve ambulatory surgical centers.

Dive into Technavio’s robust research methodology, blending expert interviews, extensive data synthesis, and validated models for unparalleled Ambulatory Surgical Centers Market insights. See full methodology.

Market Scope
Page number 312
Base year 2025
Historic period 2020-2024
Forecast period 2026-2030
Growth momentum & CAGR Accelerate at a CAGR of 6.3%
Market growth 2026-2030 USD 29817.2 million
Market structure Fragmented
YoY growth 2025-2026(%) 5.8%
Key countries US, Canada, Mexico, Germany, France, UK, Italy, Spain, The Netherlands, China, Japan, India, South Korea, Indonesia, Thailand, Brazil, Saudi Arabia, UAE, Turkey, Argentina, Colombia, South Africa and Israel
Competitive landscape Leading Companies, Market Positioning of Companies, Competitive Strategies, and Industry Risks

Request Free Sample

Research Analyst Overview

  • The ambulatory surgical centers market is defined by the rapid migration of high-acuity case migration from inpatient settings, driven by advancements in minimally invasive surgery and refined anesthetic protocols. This shift necessitates a focus on impeccable clinical safety standards and accreditation standards to ensure positive outcomes for same-day surgery.
  • Operationally, success depends on sophisticated revenue cycle management and effective payer contract negotiation to navigate site-neutral payments and bundled payment initiatives. Corporate operator networks and physician-owned centers alike are leveraging management services organization structures and physician alignment models to thrive.
  • The boardroom focus is on capital equipment expenditure, particularly for robotic-assisted surgery, which has been shown to reduce procedural variability by over 20%. As the industry pursues de novo facility construction and ambulatory network expansion, maintaining high patient satisfaction metrics within value-based care models is paramount.
  • This evolving healthcare infrastructure shift requires strategic cost-containment strategies to manage the economics of elective surgical procedures and complex surgical procedure coding, while optimizing surgical case volume through enhanced recovery after surgery protocols and securing supply chain procurement.

What are the Key Data Covered in this Ambulatory Surgical Centers Market Research and Growth Report?

  • What is the expected growth of the Ambulatory Surgical Centers Market between 2026 and 2030?

    • USD 29.82 billion, at a CAGR of 6.3%

  • What segmentation does the market report cover?

    • The report is segmented by Type (Single-specialty centers, and Multi-specialty centers), Modality (Hospital-affiliated ASCs, and Freestanding ASCs), Service (Treatment, and Diagnosis), Service Type (Otolaryngology, Endoscopy, Obstetrics or gynecology, Dental, and Others) and Geography (North America, Europe, Asia, Rest of World (ROW))

  • Which regions are analyzed in the report?

    • North America, Europe, Asia and Rest of World (ROW)

  • What are the key growth drivers and market challenges?

    • Regulatory support and acceleration of value-based payment models, Intensification of workforce shortages and wage inflation

  • Who are the major players in the Ambulatory Surgical Centers Market?

    • Align Surgical Associates Inc., Ambulatory Surgery Center, American Vision Partners, AMSURG Corp., Azura Vascular Care, Becton Dickinson and Co., Boston Scientific Corp., HCA Healthcare Inc., IOR Partners, Medtronic Plc, NueHealth, Regent Surgical Health, SCA health, Stryker Corp., Surgery Partners Inc., Tenet Healthcare Corp., Unifeye Vision Partners and University Hospitals

Market Research Insights

  • The ambulatory care strategy is increasingly focused on care continuum integration and achieving superior operational efficiency metrics. This strategic shift is delivering measurable results, with integrated ambulatory care platforms demonstrating up to a 40-50% cost reduction compared to traditional hospital outpatient departments for similar procedures.
  • Health system partnerships are pivotal, allowing for streamlined patient referral pathways and improved surgical scheduling optimization, which has been shown to boost facility throughput by over 15%.
  • As high-volume surgical specialties continue to migrate to the outpatient setting, a focus on patient experience enhancement and robust quality reporting requirements becomes critical for maintaining competitive advantage and securing favorable outpatient reimbursement models.

We can help! Our analysts can customize this ambulatory surgical centers market research report to meet your requirements.

Get in touch

1. Executive Summary

1.1 Market overview

Executive Summary - Chart on Market Overview
Executive Summary - Data Table on Market Overview
Executive Summary - Chart on Global Market Characteristics
Executive Summary - Chart on Market by Geography
Executive Summary - Chart on Market Segmentation by Type
Executive Summary - Chart on Market Segmentation by Modality
Executive Summary - Chart on Market Segmentation by Service
Executive Summary - Chart on Market Segmentation by Service Type
Executive Summary - Chart on Incremental Growth
Executive Summary - Data Table on Incremental Growth
Executive Summary - Chart on Company Market Positioning

2. Technavio Analysis

2.1 Analysis of price sensitivity, lifecycle, customer purchase basket, adoption rates, and purchase criteria

2.2 Criticality of inputs and Factors of differentiation

Chart on Overview on criticality of inputs and factors of differentiation

2.3 Factors of disruption

Chart on Overview on factors of disruption

2.4 Impact of drivers and challenges

Chart on Impact of drivers and challenges in 2025 and 2030

3. Market Landscape

3.1 Market ecosystem

Chart on Parent Market
Data Table on - Parent Market

3.2 Market characteristics

Chart on Market characteristics analysis

3.3 Value chain analysis

Chart on Value chain analysis

4. Market Sizing

4.1 Market definition

Data Table on Offerings of companies included in the market definition

4.2 Market segment analysis

Market segments

4.3 Market size 2025

4.4 Market outlook: Forecast for 2025-2030

Chart on Global - Market size and forecast 2025-2030 ($ million)
Data Table on Global - Market size and forecast 2025-2030 ($ million)
Chart on Global Market: Year-over-year growth 2025-2030 (%)
Data Table on Global Market: Year-over-year growth 2025-2030 (%)

5. Historic Market Size

5.1 Global Ambulatory Surgical Centers Market 2020 - 2024

Historic Market Size - Data Table on Global Ambulatory Surgical Centers Market 2020 - 2024 ($ million)

5.2 Type segment analysis 2020 - 2024

Historic Market Size - Type Segment 2020 - 2024 ($ million)

5.3 Modality segment analysis 2020 - 2024

Historic Market Size - Modality Segment 2020 - 2024 ($ million)

5.4 Service segment analysis 2020 - 2024

Historic Market Size - Service Segment 2020 - 2024 ($ million)

5.5 Service Type segment analysis 2020 - 2024

Historic Market Size - Service Type Segment 2020 - 2024 ($ million)

5.6 Geography segment analysis 2020 - 2024

Historic Market Size - Geography Segment 2020 - 2024 ($ million)

5.7 Country segment analysis 2020 - 2024

Historic Market Size - Country Segment 2020 - 2024 ($ million)

6. Qualitative Analysis

6.1 Impact of AI on Global Ambulatory Surgical Centers Market

7. Five Forces Analysis

7.1 Five forces summary

Five forces analysis - Comparison between 2025 and 2030

7.2 Bargaining power of buyers

Bargaining power of buyers - Impact of key factors 2025 and 2030

7.3 Bargaining power of suppliers

Bargaining power of suppliers - Impact of key factors in 2025 and 2030

7.4 Threat of new entrants

Threat of new entrants - Impact of key factors in 2025 and 2030

7.5 Threat of substitutes

Threat of substitutes - Impact of key factors in 2025 and 2030

7.6 Threat of rivalry

Threat of rivalry - Impact of key factors in 2025 and 2030

7.7 Market condition

Chart on Market condition - Five forces 2025 and 2030

8. Market Segmentation by Type

8.1 Market segments

Chart on Type - Market share 2025-2030 (%)
Data Table on Type - Market share 2025-2030 (%)

8.2 Comparison by Type

Chart on Comparison by Type
Data Table on Comparison by Type

8.3 Single-specialty centers - Market size and forecast 2025-2030

Chart on Single-specialty centers - Market size and forecast 2025-2030 ($ million)
Data Table on Single-specialty centers - Market size and forecast 2025-2030 ($ million)
Chart on Single-specialty centers - Year-over-year growth 2025-2030 (%)
Data Table on Single-specialty centers - Year-over-year growth 2025-2030 (%)

8.4 Multi-specialty centers - Market size and forecast 2025-2030

Chart on Multi-specialty centers - Market size and forecast 2025-2030 ($ million)
Data Table on Multi-specialty centers - Market size and forecast 2025-2030 ($ million)
Chart on Multi-specialty centers - Year-over-year growth 2025-2030 (%)
Data Table on Multi-specialty centers - Year-over-year growth 2025-2030 (%)

8.5 Market opportunity by Type

Market opportunity by Type ($ million)
Data Table on Market opportunity by Type ($ million)

9. Market Segmentation by Modality

9.1 Market segments

Chart on Modality - Market share 2025-2030 (%)
Data Table on Modality - Market share 2025-2030 (%)

9.2 Comparison by Modality

Chart on Comparison by Modality
Data Table on Comparison by Modality

9.3 Hospital-affiliated ASCs - Market size and forecast 2025-2030

Chart on Hospital-affiliated ASCs - Market size and forecast 2025-2030 ($ million)
Data Table on Hospital-affiliated ASCs - Market size and forecast 2025-2030 ($ million)
Chart on Hospital-affiliated ASCs - Year-over-year growth 2025-2030 (%)
Data Table on Hospital-affiliated ASCs - Year-over-year growth 2025-2030 (%)

9.4 Freestanding ASCs - Market size and forecast 2025-2030

Chart on Freestanding ASCs - Market size and forecast 2025-2030 ($ million)
Data Table on Freestanding ASCs - Market size and forecast 2025-2030 ($ million)
Chart on Freestanding ASCs - Year-over-year growth 2025-2030 (%)
Data Table on Freestanding ASCs - Year-over-year growth 2025-2030 (%)

9.5 Market opportunity by Modality

Market opportunity by Modality ($ million)
Data Table on Market opportunity by Modality ($ million)

10. Market Segmentation by Service

10.1 Market segments

Chart on Service - Market share 2025-2030 (%)
Data Table on Service - Market share 2025-2030 (%)

10.2 Comparison by Service

Chart on Comparison by Service
Data Table on Comparison by Service

10.3 Treatment - Market size and forecast 2025-2030

Chart on Treatment - Market size and forecast 2025-2030 ($ million)
Data Table on Treatment - Market size and forecast 2025-2030 ($ million)
Chart on Treatment - Year-over-year growth 2025-2030 (%)
Data Table on Treatment - Year-over-year growth 2025-2030 (%)

10.4 Diagnosis - Market size and forecast 2025-2030

Chart on Diagnosis - Market size and forecast 2025-2030 ($ million)
Data Table on Diagnosis - Market size and forecast 2025-2030 ($ million)
Chart on Diagnosis - Year-over-year growth 2025-2030 (%)
Data Table on Diagnosis - Year-over-year growth 2025-2030 (%)

10.5 Market opportunity by Service

Market opportunity by Service ($ million)
Data Table on Market opportunity by Service ($ million)

11. Market Segmentation by Service Type

11.1 Market segments

Chart on Service Type - Market share 2025-2030 (%)
Data Table on Service Type - Market share 2025-2030 (%)

11.2 Comparison by Service Type

Chart on Comparison by Service Type
Data Table on Comparison by Service Type

11.3 Otolaryngology - Market size and forecast 2025-2030

Chart on Otolaryngology - Market size and forecast 2025-2030 ($ million)
Data Table on Otolaryngology - Market size and forecast 2025-2030 ($ million)
Chart on Otolaryngology - Year-over-year growth 2025-2030 (%)
Data Table on Otolaryngology - Year-over-year growth 2025-2030 (%)

11.4 Endoscopy - Market size and forecast 2025-2030

Chart on Endoscopy - Market size and forecast 2025-2030 ($ million)
Data Table on Endoscopy - Market size and forecast 2025-2030 ($ million)
Chart on Endoscopy - Year-over-year growth 2025-2030 (%)
Data Table on Endoscopy - Year-over-year growth 2025-2030 (%)

11.5 Obstetrics or gynecology - Market size and forecast 2025-2030

Chart on Obstetrics or gynecology - Market size and forecast 2025-2030 ($ million)
Data Table on Obstetrics or gynecology - Market size and forecast 2025-2030 ($ million)
Chart on Obstetrics or gynecology - Year-over-year growth 2025-2030 (%)
Data Table on Obstetrics or gynecology - Year-over-year growth 2025-2030 (%)

11.6 Dental - Market size and forecast 2025-2030

Chart on Dental - Market size and forecast 2025-2030 ($ million)
Data Table on Dental - Market size and forecast 2025-2030 ($ million)
Chart on Dental - Year-over-year growth 2025-2030 (%)
Data Table on Dental - Year-over-year growth 2025-2030 (%)

11.7 Others - Market size and forecast 2025-2030

Chart on Others - Market size and forecast 2025-2030 ($ million)
Data Table on Others - Market size and forecast 2025-2030 ($ million)
Chart on Others - Year-over-year growth 2025-2030 (%)
Data Table on Others - Year-over-year growth 2025-2030 (%)

11.8 Market opportunity by Service Type

Market opportunity by Service Type ($ million)
Data Table on Market opportunity by Service Type ($ million)

12. Customer Landscape

12.1 Customer landscape overview

Analysis of price sensitivity, lifecycle, customer purchase basket, adoption rates, and purchase criteria

13. Geographic Landscape

13.1 Geographic segmentation

Chart on Market share by geography 2025-2030 (%)
Data Table on Market share by geography 2025-2030 (%)

13.2 Geographic comparison

Chart on Geographic comparison
Data Table on Geographic comparison

13.3 North America - Market size and forecast 2025-2030

Chart on North America - Market size and forecast 2025-2030 ($ million)
Data Table on North America - Market size and forecast 2025-2030 ($ million)
Chart on North America - Year-over-year growth 2025-2030 (%)
Data Table on North America - Year-over-year growth 2025-2030 (%)
Chart on Regional Comparison - North America
Data Table on Regional Comparison - North America

13.3.1 US - Market size and forecast 2025-2030

Chart on US - Market size and forecast 2025-2030 ($ million)
Data Table on US - Market size and forecast 2025-2030 ($ million)
Chart on US - Year-over-year growth 2025-2030 (%)
Data Table on US - Year-over-year growth 2025-2030 (%)

13.3.2 Canada - Market size and forecast 2025-2030

Chart on Canada - Market size and forecast 2025-2030 ($ million)
Data Table on Canada - Market size and forecast 2025-2030 ($ million)
Chart on Canada - Year-over-year growth 2025-2030 (%)
Data Table on Canada - Year-over-year growth 2025-2030 (%)

13.3.3 Mexico - Market size and forecast 2025-2030

Chart on Mexico - Market size and forecast 2025-2030 ($ million)
Data Table on Mexico - Market size and forecast 2025-2030 ($ million)
Chart on Mexico - Year-over-year growth 2025-2030 (%)
Data Table on Mexico - Year-over-year growth 2025-2030 (%)

13.4 Europe - Market size and forecast 2025-2030

Chart on Europe - Market size and forecast 2025-2030 ($ million)
Data Table on Europe - Market size and forecast 2025-2030 ($ million)
Chart on Europe - Year-over-year growth 2025-2030 (%)
Data Table on Europe - Year-over-year growth 2025-2030 (%)
Chart on Regional Comparison - Europe
Data Table on Regional Comparison - Europe

13.4.1 Germany - Market size and forecast 2025-2030

Chart on Germany - Market size and forecast 2025-2030 ($ million)
Data Table on Germany - Market size and forecast 2025-2030 ($ million)
Chart on Germany - Year-over-year growth 2025-2030 (%)
Data Table on Germany - Year-over-year growth 2025-2030 (%)

13.4.2 France - Market size and forecast 2025-2030

Chart on France - Market size and forecast 2025-2030 ($ million)
Data Table on France - Market size and forecast 2025-2030 ($ million)
Chart on France - Year-over-year growth 2025-2030 (%)
Data Table on France - Year-over-year growth 2025-2030 (%)

13.4.3 UK - Market size and forecast 2025-2030

Chart on UK - Market size and forecast 2025-2030 ($ million)
Data Table on UK - Market size and forecast 2025-2030 ($ million)
Chart on UK - Year-over-year growth 2025-2030 (%)
Data Table on UK - Year-over-year growth 2025-2030 (%)

13.4.4 Italy - Market size and forecast 2025-2030

Chart on Italy - Market size and forecast 2025-2030 ($ million)
Data Table on Italy - Market size and forecast 2025-2030 ($ million)
Chart on Italy - Year-over-year growth 2025-2030 (%)
Data Table on Italy - Year-over-year growth 2025-2030 (%)

13.4.5 Spain - Market size and forecast 2025-2030

Chart on Spain - Market size and forecast 2025-2030 ($ million)
Data Table on Spain - Market size and forecast 2025-2030 ($ million)
Chart on Spain - Year-over-year growth 2025-2030 (%)
Data Table on Spain - Year-over-year growth 2025-2030 (%)

13.4.6 The Netherlands - Market size and forecast 2025-2030

Chart on The Netherlands - Market size and forecast 2025-2030 ($ million)
Data Table on The Netherlands - Market size and forecast 2025-2030 ($ million)
Chart on The Netherlands - Year-over-year growth 2025-2030 (%)
Data Table on The Netherlands - Year-over-year growth 2025-2030 (%)

13.5 Asia - Market size and forecast 2025-2030

Chart on Asia - Market size and forecast 2025-2030 ($ million)
Data Table on Asia - Market size and forecast 2025-2030 ($ million)
Chart on Asia - Year-over-year growth 2025-2030 (%)
Data Table on Asia - Year-over-year growth 2025-2030 (%)
Chart on Regional Comparison - Asia
Data Table on Regional Comparison - Asia

13.5.1 China - Market size and forecast 2025-2030

Chart on China - Market size and forecast 2025-2030 ($ million)
Data Table on China - Market size and forecast 2025-2030 ($ million)
Chart on China - Year-over-year growth 2025-2030 (%)
Data Table on China - Year-over-year growth 2025-2030 (%)

13.5.2 Japan - Market size and forecast 2025-2030

Chart on Japan - Market size and forecast 2025-2030 ($ million)
Data Table on Japan - Market size and forecast 2025-2030 ($ million)
Chart on Japan - Year-over-year growth 2025-2030 (%)
Data Table on Japan - Year-over-year growth 2025-2030 (%)

13.5.3 India - Market size and forecast 2025-2030

Chart on India - Market size and forecast 2025-2030 ($ million)
Data Table on India - Market size and forecast 2025-2030 ($ million)
Chart on India - Year-over-year growth 2025-2030 (%)
Data Table on India - Year-over-year growth 2025-2030 (%)

13.5.4 South Korea - Market size and forecast 2025-2030

Chart on South Korea - Market size and forecast 2025-2030 ($ million)
Data Table on South Korea - Market size and forecast 2025-2030 ($ million)
Chart on South Korea - Year-over-year growth 2025-2030 (%)
Data Table on South Korea - Year-over-year growth 2025-2030 (%)

13.5.5 Indonesia - Market size and forecast 2025-2030

Chart on Indonesia - Market size and forecast 2025-2030 ($ million)
Data Table on Indonesia - Market size and forecast 2025-2030 ($ million)
Chart on Indonesia - Year-over-year growth 2025-2030 (%)
Data Table on Indonesia - Year-over-year growth 2025-2030 (%)

13.5.6 Thailand - Market size and forecast 2025-2030

Chart on Thailand - Market size and forecast 2025-2030 ($ million)
Data Table on Thailand - Market size and forecast 2025-2030 ($ million)
Chart on Thailand - Year-over-year growth 2025-2030 (%)
Data Table on Thailand - Year-over-year growth 2025-2030 (%)

13.6 Rest of World (ROW) - Market size and forecast 2025-2030

Chart on Rest of World (ROW) - Market size and forecast 2025-2030 ($ million)
Data Table on Rest of World (ROW) - Market size and forecast 2025-2030 ($ million)
Chart on Rest of World (ROW) - Year-over-year growth 2025-2030 (%)
Data Table on Rest of World (ROW) - Year-over-year growth 2025-2030 (%)
Chart on Regional Comparison - Rest of World (ROW)
Data Table on Regional Comparison - Rest of World (ROW)

13.6.1 Brazil - Market size and forecast 2025-2030

Chart on Brazil - Market size and forecast 2025-2030 ($ million)
Data Table on Brazil - Market size and forecast 2025-2030 ($ million)
Chart on Brazil - Year-over-year growth 2025-2030 (%)
Data Table on Brazil - Year-over-year growth 2025-2030 (%)

13.6.2 Saudi Arabia - Market size and forecast 2025-2030

Chart on Saudi Arabia - Market size and forecast 2025-2030 ($ million)
Data Table on Saudi Arabia - Market size and forecast 2025-2030 ($ million)
Chart on Saudi Arabia - Year-over-year growth 2025-2030 (%)
Data Table on Saudi Arabia - Year-over-year growth 2025-2030 (%)

13.6.3 UAE - Market size and forecast 2025-2030

Chart on UAE - Market size and forecast 2025-2030 ($ million)
Data Table on UAE - Market size and forecast 2025-2030 ($ million)
Chart on UAE - Year-over-year growth 2025-2030 (%)
Data Table on UAE - Year-over-year growth 2025-2030 (%)

13.6.4 Turkey - Market size and forecast 2025-2030

Chart on Turkey - Market size and forecast 2025-2030 ($ million)
Data Table on Turkey - Market size and forecast 2025-2030 ($ million)
Chart on Turkey - Year-over-year growth 2025-2030 (%)
Data Table on Turkey - Year-over-year growth 2025-2030 (%)

13.6.5 Argentina - Market size and forecast 2025-2030

Chart on Argentina - Market size and forecast 2025-2030 ($ million)
Data Table on Argentina - Market size and forecast 2025-2030 ($ million)
Chart on Argentina - Year-over-year growth 2025-2030 (%)
Data Table on Argentina - Year-over-year growth 2025-2030 (%)

13.6.6 Colombia - Market size and forecast 2025-2030

Chart on Colombia - Market size and forecast 2025-2030 ($ million)
Data Table on Colombia - Market size and forecast 2025-2030 ($ million)
Chart on Colombia - Year-over-year growth 2025-2030 (%)
Data Table on Colombia - Year-over-year growth 2025-2030 (%)

13.6.7 South Africa - Market size and forecast 2025-2030

Chart on South Africa - Market size and forecast 2025-2030 ($ million)
Data Table on South Africa - Market size and forecast 2025-2030 ($ million)
Chart on South Africa - Year-over-year growth 2025-2030 (%)
Data Table on South Africa - Year-over-year growth 2025-2030 (%)

13.6.8 Israel - Market size and forecast 2025-2030

Chart on Israel - Market size and forecast 2025-2030 ($ million)
Data Table on Israel - Market size and forecast 2025-2030 ($ million)
Chart on Israel - Year-over-year growth 2025-2030 (%)
Data Table on Israel - Year-over-year growth 2025-2030 (%)

13.7 Market opportunity by geography

Market opportunity by geography ($ million)
Data Tables on Market opportunity by geography ($ million)

14. Drivers, Challenges, and Opportunity

14.1 Market drivers

Regulatory support and acceleration of value-based payment models
Technological convergences enabling high-acuity migration
Strategic consolidation and physician alignment models

14.2 Market challenges

Intensification of workforce shortages and wage inflation
Regulatory restructuring and quality standardization
Supply chain fragility and import dependencies

14.3 Impact of drivers and challenges

Impact of drivers and challenges in 2025 and 2030

14.4 Market opportunities

Acceleration of cardiovascular procedure migration to outpatient settings
Integration of robotic-assisted surgery in orthopedics
Consolidation via private equity-backed platforms

15. Competitive Landscape

15.1 Overview

15.2

Overview on criticality of inputs and factors of differentiation

15.3 Landscape disruption

Overview on factors of disruption

15.4 Industry risks

Impact of key risks on business

16. Competitive Analysis

16.1 Companies profiled

Companies covered

16.2 Company ranking index

16.3 Market positioning of companies

Matrix on companies position and classification

16.4 Align Surgical Associates Inc.

Align Surgical Associates Inc. - Overview
Align Surgical Associates Inc. - Product / Service
Align Surgical Associates Inc. - Key offerings
SWOT

16.5 Ambulatory Surgery Center

Ambulatory Surgery Center - Overview
Ambulatory Surgery Center - Product / Service
Ambulatory Surgery Center - Key offerings
SWOT

16.6 American Vision Partners

American Vision Partners - Overview
American Vision Partners - Product / Service
American Vision Partners - Key offerings
SWOT

16.7 Azura Vascular Care

Azura Vascular Care - Overview
Azura Vascular Care - Product / Service
Azura Vascular Care - Key offerings
SWOT

16.8 Becton Dickinson and Co.

Becton Dickinson and Co. - Overview
Becton Dickinson and Co. - Business segments
Becton Dickinson and Co. - Key news
Becton Dickinson and Co. - Key offerings
Becton Dickinson and Co. - Segment focus
SWOT

16.9 Boston Scientific Corp.

Boston Scientific Corp. - Overview
Boston Scientific Corp. - Business segments
Boston Scientific Corp. - Key news
Boston Scientific Corp. - Key offerings
Boston Scientific Corp. - Segment focus
SWOT

16.10 HCA Healthcare Inc.

HCA Healthcare Inc. - Overview
HCA Healthcare Inc. - Product / Service
HCA Healthcare Inc. - Key offerings
SWOT

16.11 Medtronic Plc

Medtronic Plc - Overview
Medtronic Plc - Business segments
Medtronic Plc - Key news
Medtronic Plc - Key offerings
Medtronic Plc - Segment focus
SWOT

16.12 NueHealth

NueHealth - Overview
NueHealth - Product / Service
NueHealth - Key offerings
SWOT

16.13 Regent Surgical Health

Regent Surgical Health - Overview
Regent Surgical Health - Product / Service
Regent Surgical Health - Key offerings
SWOT

16.14 SCA health

SCA health - Overview
SCA health - Product / Service
SCA health - Key offerings
SWOT

16.15 Stryker Corp.

Stryker Corp. - Overview
Stryker Corp. - Business segments
Stryker Corp. - Key news
Stryker Corp. - Key offerings
Stryker Corp. - Segment focus
SWOT

16.16 Surgery Partners Inc.

Surgery Partners Inc. - Overview
Surgery Partners Inc. - Business segments
Surgery Partners Inc. - Key offerings
Surgery Partners Inc. - Segment focus
SWOT

16.17 Tenet Healthcare Corp.

Tenet Healthcare Corp. - Overview
Tenet Healthcare Corp. - Business segments
Tenet Healthcare Corp. - Key offerings
Tenet Healthcare Corp. - Segment focus
SWOT

16.18 Unifeye Vision Partners

Unifeye Vision Partners - Overview
Unifeye Vision Partners - Product / Service
Unifeye Vision Partners - Key offerings
SWOT

17. Appendix

17.1 Scope of the report

Market definition
Objectives
Notes and caveats

17.2 Inclusions and exclusions checklist

Inclusions checklist
Exclusions checklist

17.3 Currency conversion rates for US$

17.4 Research methodology

17.5 Data procurement

Information sources

17.6 Data validation

17.7 Validation techniques employed for market sizing

17.8 Data synthesis

17.9 360 degree market analysis

17.10 List of abbreviations

Research Methodology

Technavio presents a detailed picture of the market by way of study, synthesis, and summation of data from multiple sources. The analysts have presented the various facets of the market with a particular focus on identifying the key industry influencers. The data thus presented is comprehensive, reliable, and the result of extensive research, both primary and secondary.

INFORMATION SOURCES

Primary sources

  • Manufacturers and suppliers
  • Channel partners
  • Industry experts
  • Strategic decision makers

Secondary sources

  • Industry journals and periodicals
  • Government data
  • Financial reports of key industry players
  • Historical data
  • Press releases

DATA ANALYSIS

Data Synthesis

  • Collation of data
  • Estimation of key figures
  • Analysis of derived insights

Data Validation

  • Triangulation with data models
  • Reference against proprietary databases
  • Corroboration with industry experts

REPORT WRITING

Qualitative

  • Market drivers
  • Market challenges
  • Market trends
  • Five forces analysis

Quantitative

  • Market size and forecast
  • Market segmentation
  • Geographical insights
  • Competitive landscape

Interested in this report?

Get your sample now to see our research methodology and insights!

Download Now

Frequently Asked Questions

Ambulatory Surgical Centers market growth will increase by USD 29817.2 million during 2026-2030.

The Ambulatory Surgical Centers market is expected to grow at a CAGR of 6.3% during 2026-2030.

Ambulatory Surgical Centers market is segmented by Type (Single-specialty centers, Multi-specialty centers) Modality (Hospital-affiliated ASCs, Freestanding ASCs) Service (Treatment, Diagnosis) Service type (Otolaryngology, Endoscopy, Obstetrics or gynecology, Dental, Others)

Align Surgical Associates Inc., Ambulatory Surgery Center, American Vision Partners, AMSURG Corp., Azura Vascular Care, Becton Dickinson and Co., Boston Scientific Corp., HCA Healthcare Inc., IOR Partners, Medtronic Plc, NueHealth, Regent Surgical Health, SCA health, Stryker Corp., Surgery Partners Inc., Tenet Healthcare Corp., Unifeye Vision Partners, University Hospitals are a few of the key vendors in the Ambulatory Surgical Centers market.

North America will register the highest growth rate of 50.4% among the other regions. Therefore, the Ambulatory Surgical Centers market in North America is expected to garner significant business opportunities for the vendors during the forecast period.

US, Canada, Mexico, Germany, France, UK, Italy, Spain, The Netherlands, China, Japan, India, South Korea, Indonesia, Thailand, Brazil, Saudi Arabia, UAE, Turkey, Argentina, Colombia, South Africa, Israel

  • Regulatory support and acceleration of value-based payment models is the driving factor this market.

The Ambulatory Surgical Centers market vendors should focus on grabbing business opportunities from the Type segment as it accounted for the largest market share in the base year.
RIA - Research AI Assistant
Ask RIA